| Param | Original file | Final file |
|---|---|---|
| Filename | modeM0/AS1A05_082T09_9000003054_20650cztM0_level2.evt | modeM0/AS1A05_082T09_9000003054_20650cztM0_level2_quad_clean.evt |
| Size (bytes) | 508,423,680 | 89,236,800 |
| Size | 484.9 MB | 85.1 MB |
| Events in quadrant A | 3,506,540 | 573,910 |
| Events in quadrant B | 3,552,485 | 574,880 |
| Events in quadrant C | 3,351,296 | 547,039 |
| Events in quadrant D | 4,526,313 | 533,214 |
| Mode M9 | |||
|---|---|---|---|
| Quadrant | BADHDUFLAG | Total packets | Discarded packets |
| A | 0 | 13 | 0 |
| B | 0 | 14 | 0 |
| C | 0 | 14 | 0 |
| D | 0 | 14 | 0 |
| Mode M0 | |||
|---|---|---|---|
| Quadrant | BADHDUFLAG | Total packets | Discarded packets |
| A | 0 | 14717 | 2 |
| B | 0 | 14651 | 2 |
| C | 0 | 14163 | 2 |
| D | 0 | 17893 | 2 |
| Mode SS | |||
|---|---|---|---|
| Quadrant | BADHDUFLAG | Total packets | Discarded packets |
| A | 0 | 136 | 0 |
| B | 0 | 136 | 0 |
| C | 0 | 136 | 0 |
| D | 0 | 136 | 0 |
| Quadrant | Total seconds | Saturated seconds | Saturation percentage |
|---|---|---|---|
| A | 6797 | 133 | 1.956746% |
| B | 6797 | 113 | 1.662498% |
| C | 6797 | 127 | 1.868471% |
| D | 6797 | 212 | 3.119023% |
Noise dominated data is calculated using 1-second bins in cleaned event files. If a bin has >2000 counts, and if more than 50% of those come from <1% of pixels, then it is considered to be noise-dominated and hence unusable.
| Quadrant | # 1 sec bins | Bins with >0 counts | Bins with >2000 counts | High rate bins dominated by noise | Noise dominated (total time) | Noise dominated (detector-on time) | Marked lightcurve |
|---|---|---|---|---|---|---|---|
| A | 7752 | 6797 | 23 | 23 | 0.30% | 0.34% | 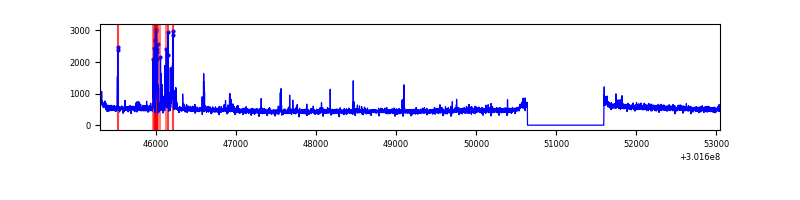 |
| B | 7752 | 6797 | 5 | 5 | 0.06% | 0.07% | 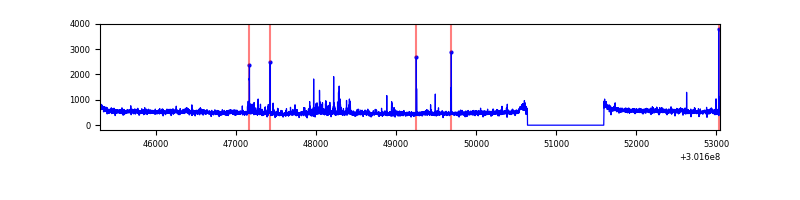 |
| C | 7752 | 6797 | 3 | 3 | 0.04% | 0.04% | 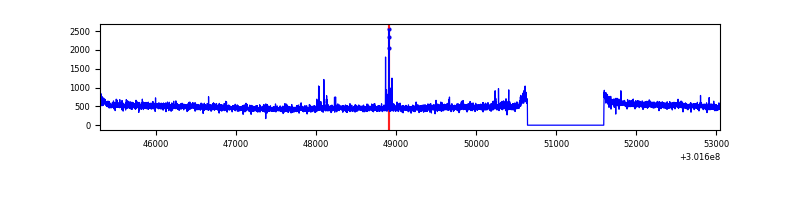 |
| D | 7752 | 6797 | 120 | 120 | 1.55% | 1.77% | 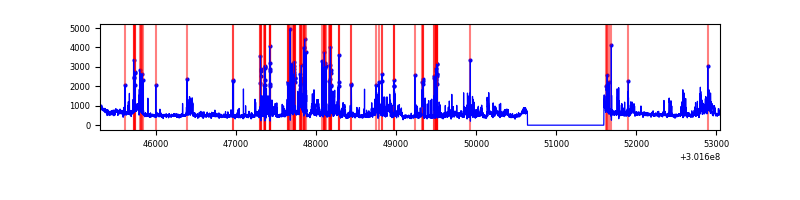 |
Top three noisy pixels from each quadrant. If the there are fewer than three noisy pixels in the level2.evt file, extra rows are filled as -1
| Pixel properties | Quadrant properties | ||||||
|---|---|---|---|---|---|---|---|
| Quadrant | DetID | PixID | Counts | Sigma | Mean | Median | Sigma |
| A | 5 | 16 | 175813 | 1003.06 | 860 | 841 | 174.4 |
| A | 13 | 252 | 17344 | 94.6 | 860 | 841 | 174.4 |
| A | 0 | 226 | 7662 | 39.1 | 860 | 841 | 174.4 |
| B | 7 | 220 | 42514 | 253.93 | 851 | 829 | 164.2 |
| B | 0 | 189 | 34907 | 207.59 | 851 | 829 | 164.2 |
| B | 4 | 216 | 32037 | 190.11 | 851 | 829 | 164.2 |
| C | 14 | 238 | 127744 | 666.36 | 811 | 816 | 190.5 |
| C | 7 | 247 | 42874 | 220.8 | 811 | 816 | 190.5 |
| C | 3 | 233 | 6273 | 28.65 | 811 | 816 | 190.5 |
| D | 1 | 52 | 929286 | 4618.32 | 827 | 803 | 201.0 |
| D | 7 | 238 | 177591 | 879.35 | 827 | 803 | 201.0 |
| D | 2 | 165 | 100263 | 494.72 | 827 | 803 | 201.0 |
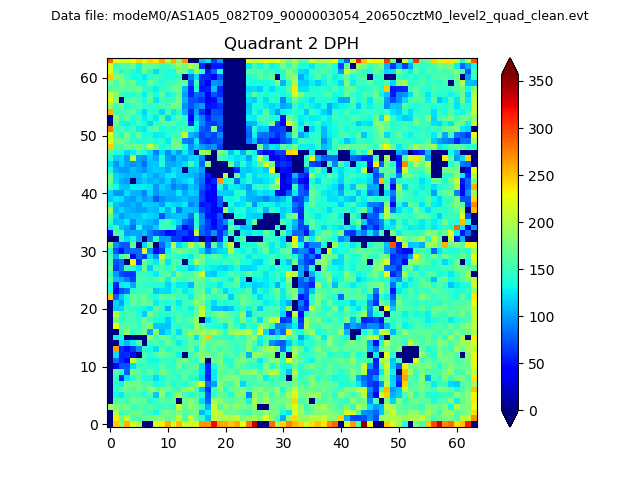
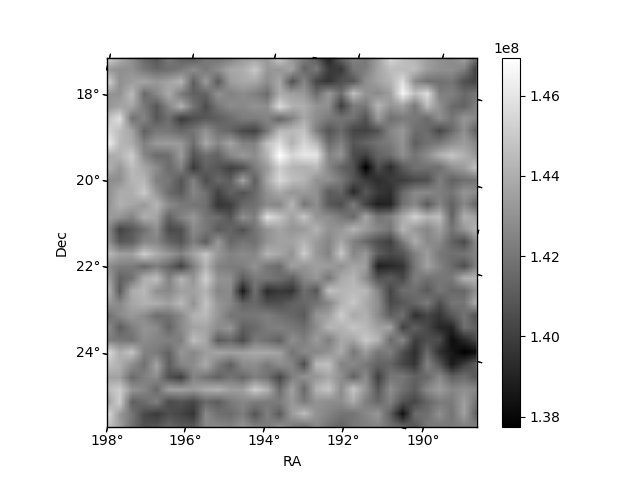
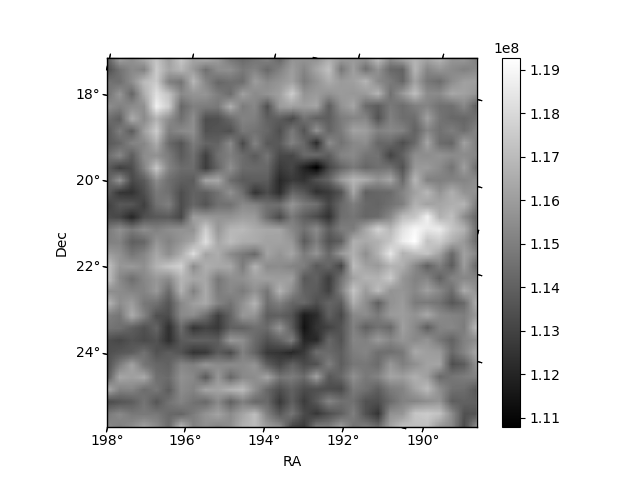
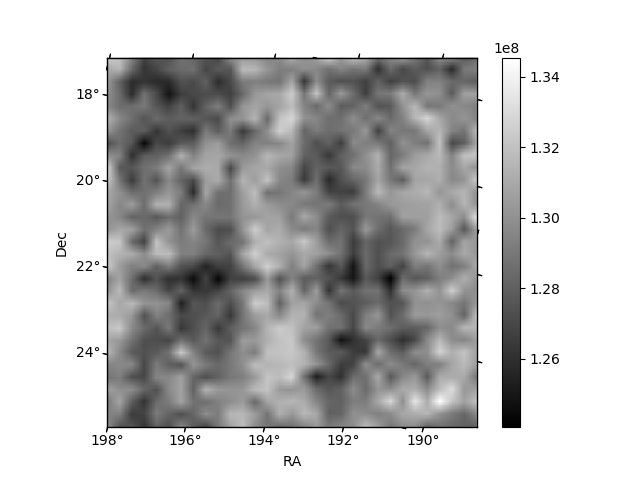
Histogram calculated using DETX and DETY for each event in the final _common_clean file
| Quadrant A | 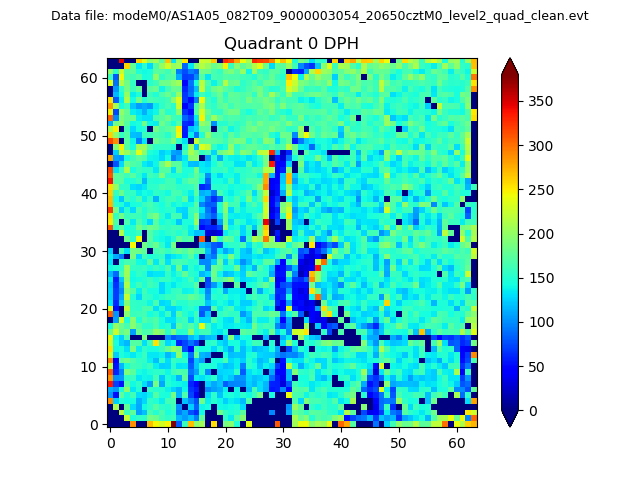 |
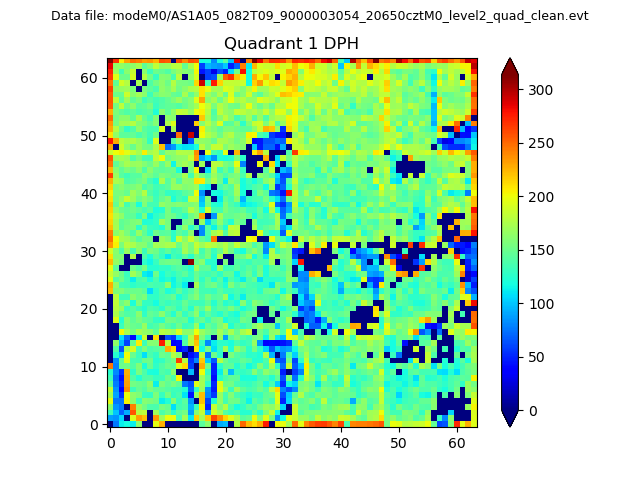 |
Quadrant B |
|---|---|---|---|
| Quadrant D | 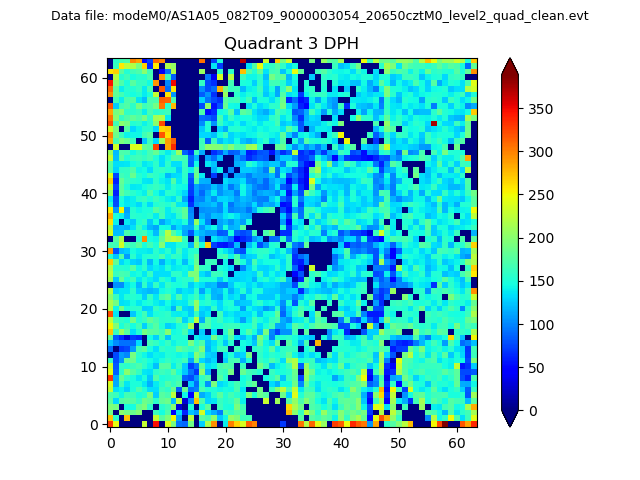 |
 |
Quadrant C |
| Plot type | Count rate plots | Images |
|---|---|---|
| Comparison with Poisson distribution Blue bars denote a histogram of data divided into 1 sec bins. Red curve is a Poisson curve with rate = median count rate of data. |
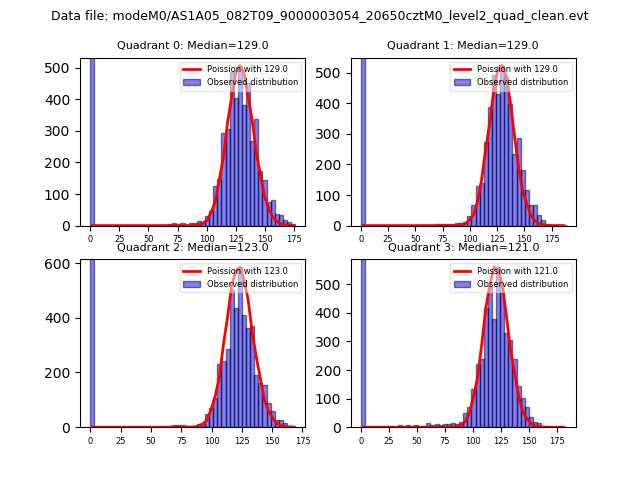 |
 |
| Quadrant-wise count rates Data is divided into 100 sec bins |
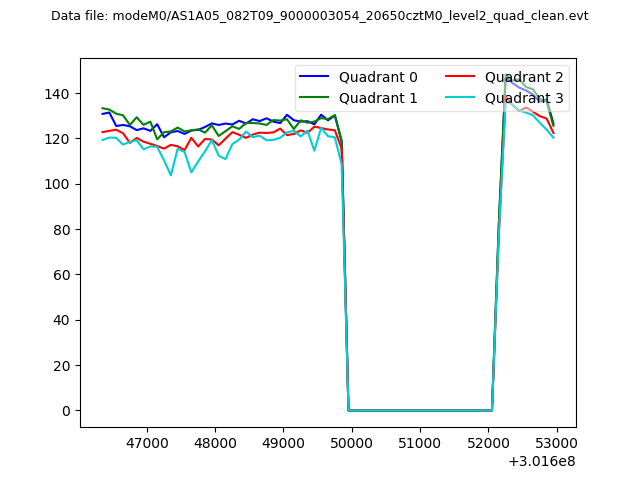 |
|
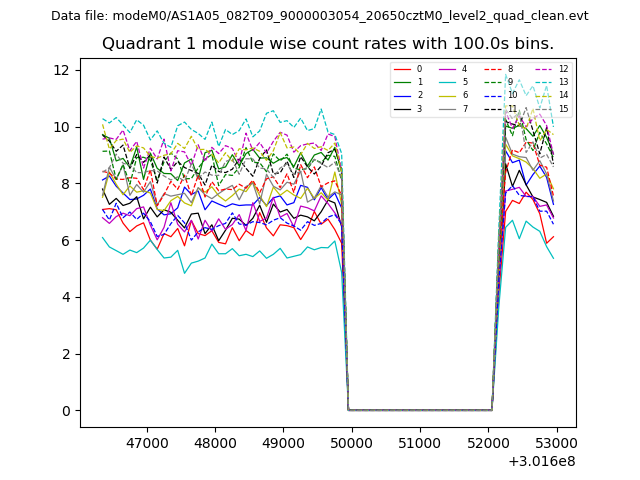
| Module-wise count rates for Quadrant A Data is divided into 100 sec bins |
 |
 |
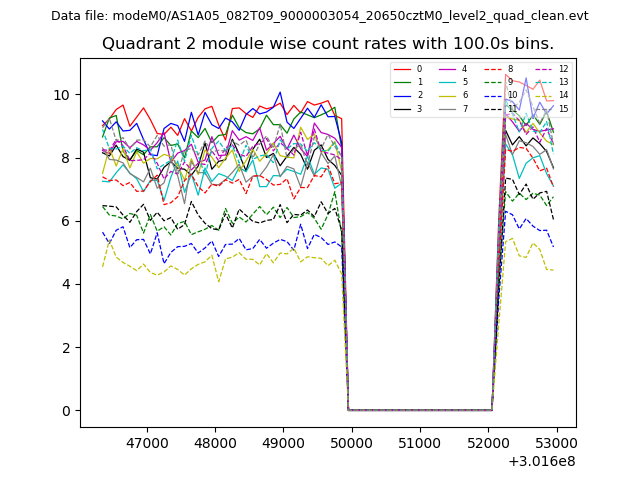
| Module-wise count rates for Quadrant B Data is divided into 100 sec bins |
 |
 |
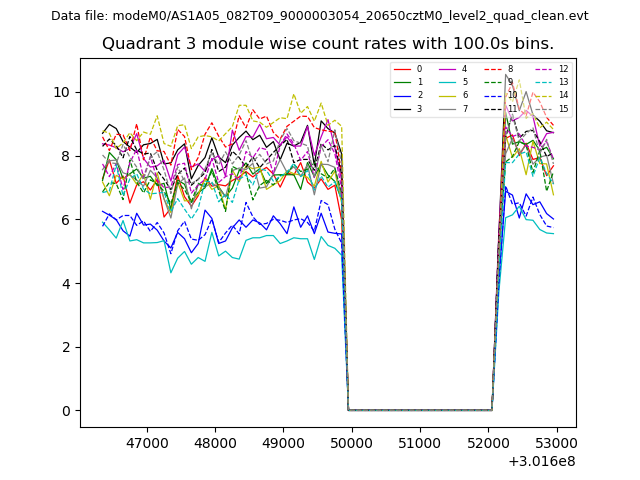
| Module-wise count rates for Quadrant C Data is divided into 100 sec bins |
 |
 |
| Module-wise count rates for Quadrant D Data is divided into 100 sec bins |
 |
 |
| Parameter | Plot |
|---|---|
| CZT HV Monitor | 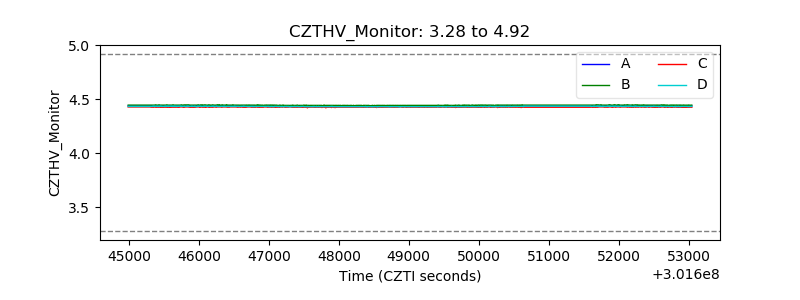 |
| D_VDD | 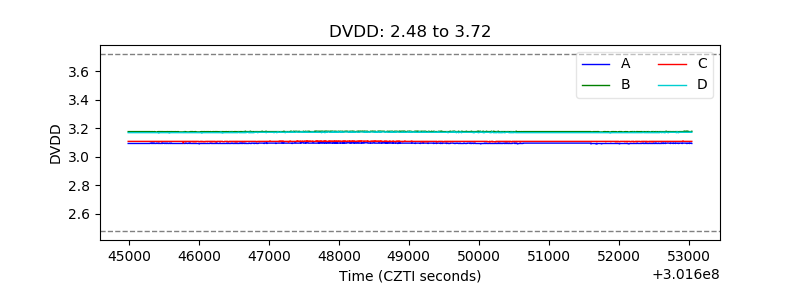 |
| Temperature 1 | 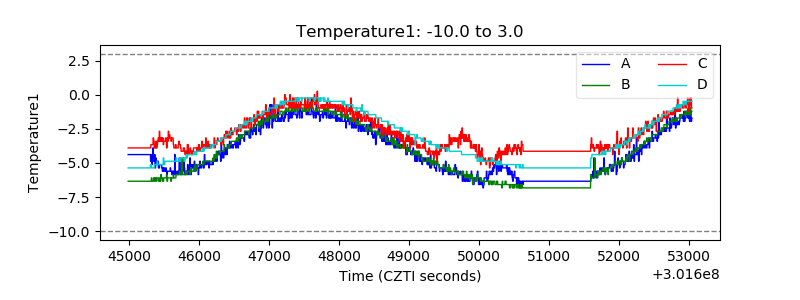 |
| Veto HV Monitor | 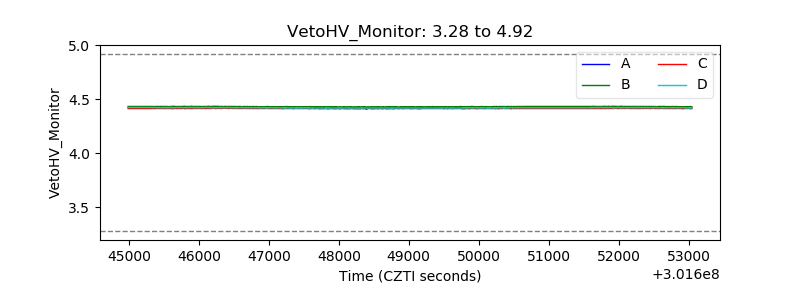 |
| Veto LLD | 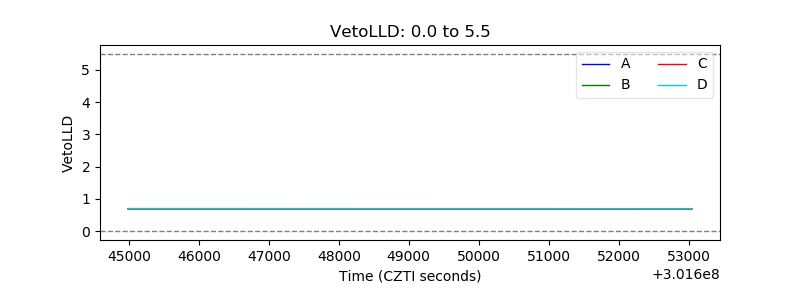 |
| Alpha Counter | 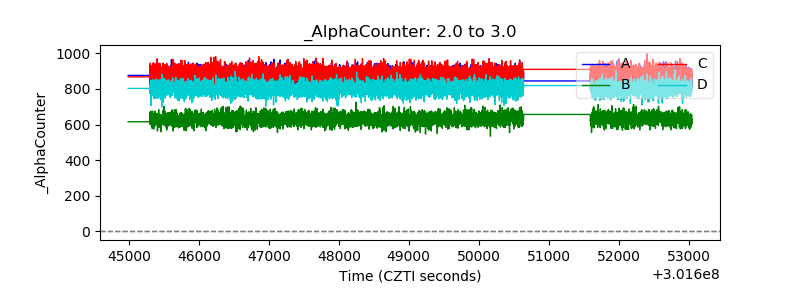 |
| _CPM_Rate | 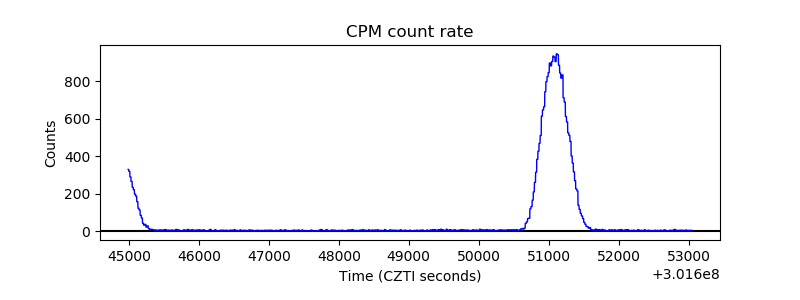 |
| CZT Counter | 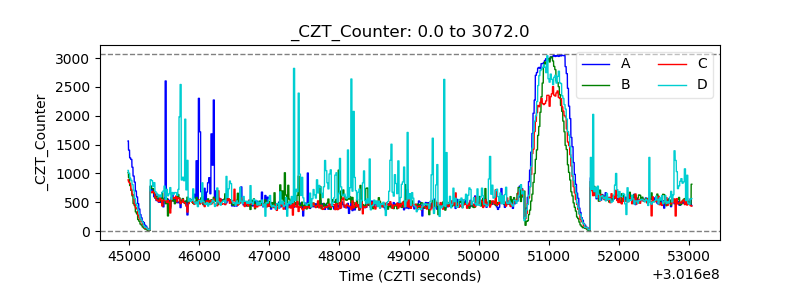 |
| +2.5 Volts monitor |  |
| +5 Volts monitor |  |
| _ROLL_ROT |  |
| _Roll_DEC | 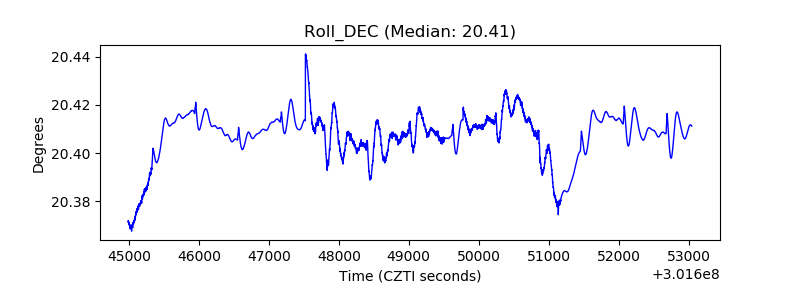 |
| _Roll_RA | 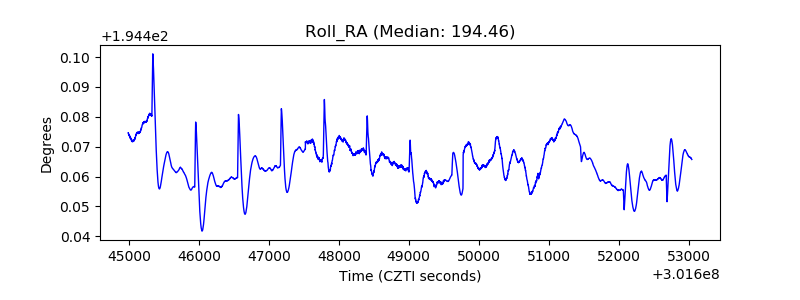 |
| Veto Counter |  |