| Param | Original file | Final file |
|---|---|---|
| Filename | modeM0/AS1A05_082T09_9000003054_20652cztM0_level2.evt | modeM0/AS1A05_082T09_9000003054_20652cztM0_level2_quad_clean.evt |
| Size (bytes) | 550,998,720 | 104,388,480 |
| Size | 525.5 MB | 99.6 MB |
| Events in quadrant A | 3,408,441 | 701,984 |
| Events in quadrant B | 3,926,514 | 693,749 |
| Events in quadrant C | 3,397,390 | 660,115 |
| Events in quadrant D | 5,496,197 | 634,065 |
| Mode M9 | |||
|---|---|---|---|
| Quadrant | BADHDUFLAG | Total packets | Discarded packets |
| A | 0 | 14 | 0 |
| B | 0 | 15 | 0 |
| C | 0 | 15 | 0 |
| D | 0 | 15 | 0 |
| Mode M0 | |||
|---|---|---|---|
| Quadrant | BADHDUFLAG | Total packets | Discarded packets |
| A | 0 | 14500 | 3 |
| B | 0 | 16128 | 2 |
| C | 0 | 14309 | 2 |
| D | 0 | 20876 | 5 |
| Mode SS | |||
|---|---|---|---|
| Quadrant | BADHDUFLAG | Total packets | Discarded packets |
| A | 0 | 136 | 0 |
| B | 0 | 136 | 0 |
| C | 0 | 136 | 0 |
| D | 0 | 136 | 0 |
| Quadrant | Total seconds | Saturated seconds | Saturation percentage |
|---|---|---|---|
| A | 6770 | 82 | 1.211226% |
| B | 6770 | 147 | 2.171344% |
| C | 6770 | 109 | 1.610044% |
| D | 6769 | 335 | 4.949032% |
Noise dominated data is calculated using 1-second bins in cleaned event files. If a bin has >2000 counts, and if more than 50% of those come from <1% of pixels, then it is considered to be noise-dominated and hence unusable.
| Quadrant | # 1 sec bins | Bins with >0 counts | Bins with >2000 counts | High rate bins dominated by noise | Noise dominated (total time) | Noise dominated (detector-on time) | Marked lightcurve |
|---|---|---|---|---|---|---|---|
| A | 7875 | 6770 | 1 | 1 | 0.01% | 0.01% | 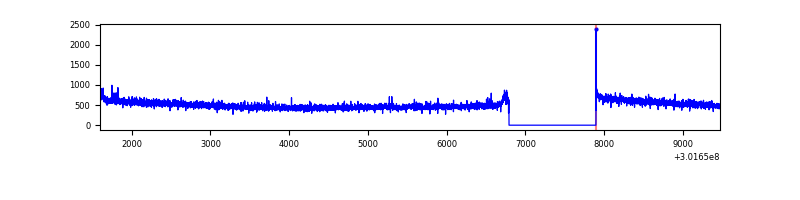 |
| B | 7875 | 6770 | 24 | 24 | 0.30% | 0.35% | 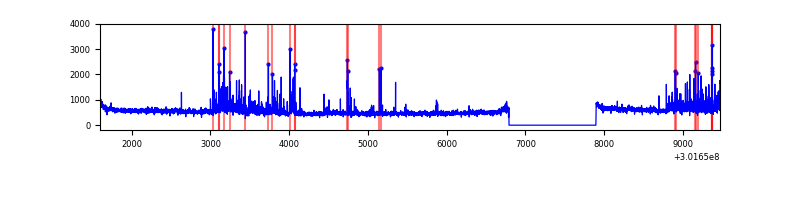 |
| C | 7875 | 6770 | 0 | 0 | 0.00% | 0.00% |  |
| D | 7875 | 6770 | 197 | 197 | 2.50% | 2.91% | 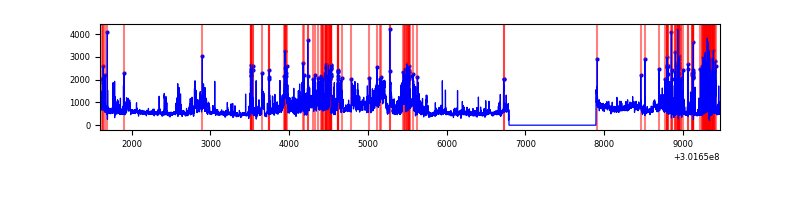 |
Top three noisy pixels from each quadrant. If the there are fewer than three noisy pixels in the level2.evt file, extra rows are filled as -1
| Pixel properties | Quadrant properties | ||||||
|---|---|---|---|---|---|---|---|
| Quadrant | DetID | PixID | Counts | Sigma | Mean | Median | Sigma |
| A | 13 | 252 | 10585 | 55.11 | 881 | 863 | 176.4 |
| A | 0 | 226 | 7910 | 39.95 | 881 | 863 | 176.4 |
| A | 13 | 210 | 7543 | 37.87 | 881 | 863 | 176.4 |
| B | 7 | 220 | 347548 | 2087.11 | 864 | 842 | 166.1 |
| B | 4 | 216 | 51551 | 305.26 | 864 | 842 | 166.1 |
| B | 0 | 190 | 32649 | 191.47 | 864 | 842 | 166.1 |
| C | 14 | 238 | 130078 | 674.83 | 825 | 830 | 191.5 |
| C | 7 | 247 | 25302 | 127.77 | 825 | 830 | 191.5 |
| C | 3 | 233 | 13189 | 64.53 | 825 | 830 | 191.5 |
| D | 1 | 52 | 1359411 | 6716.51 | 840 | 818 | 202.3 |
| D | 1 | 239 | 391309 | 1930.48 | 840 | 818 | 202.3 |
| D | 1 | 20 | 247969 | 1221.85 | 840 | 818 | 202.3 |
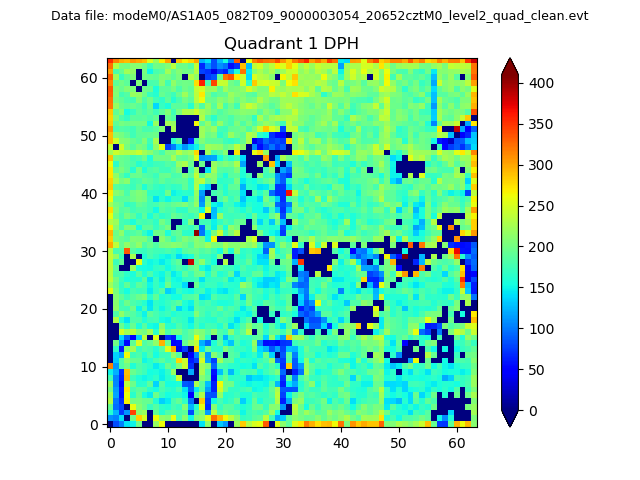
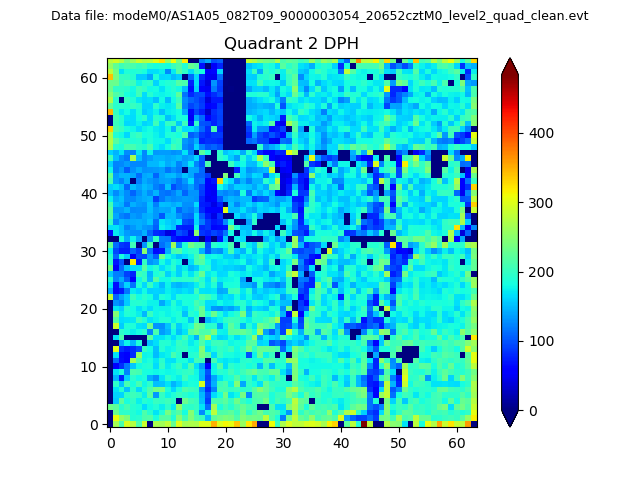
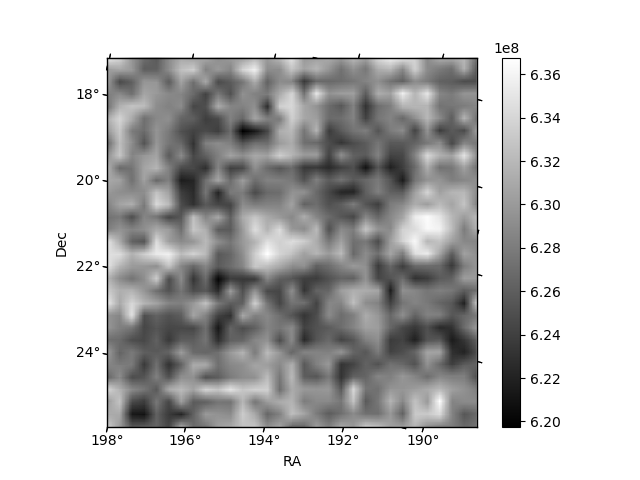
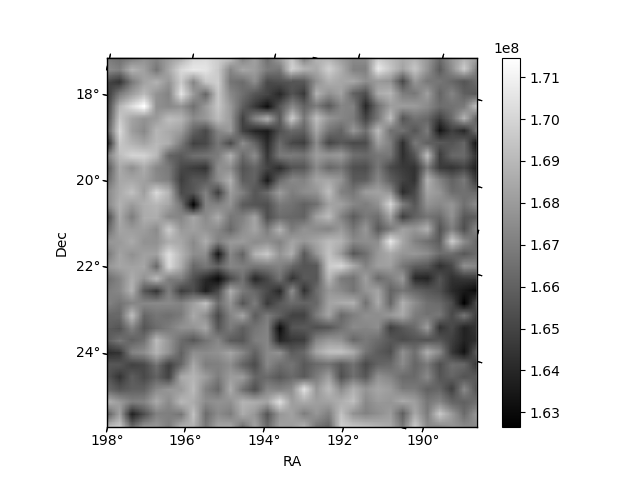
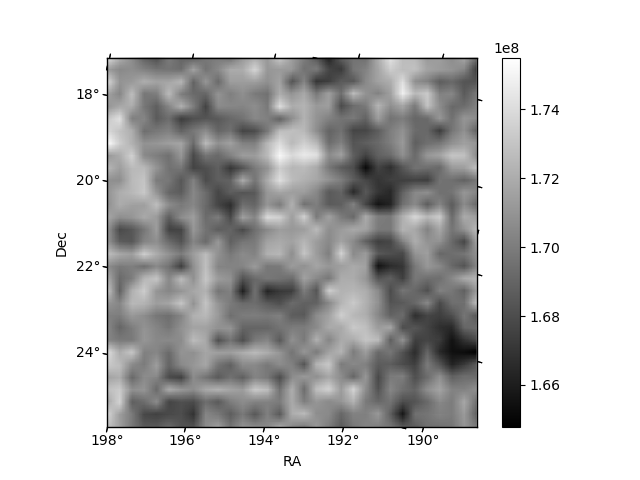
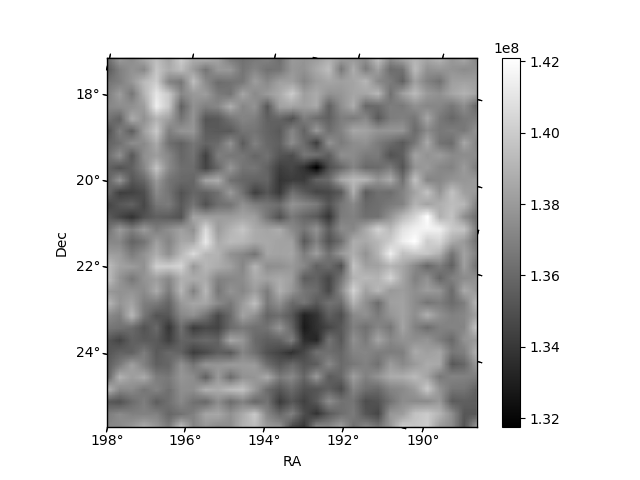
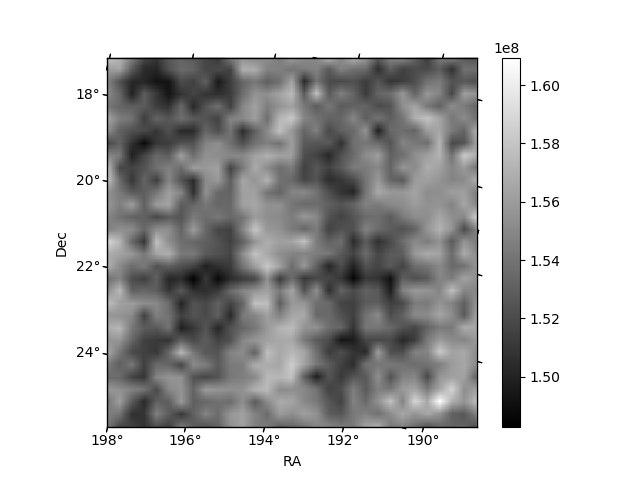
Histogram calculated using DETX and DETY for each event in the final _common_clean file
| Quadrant A | 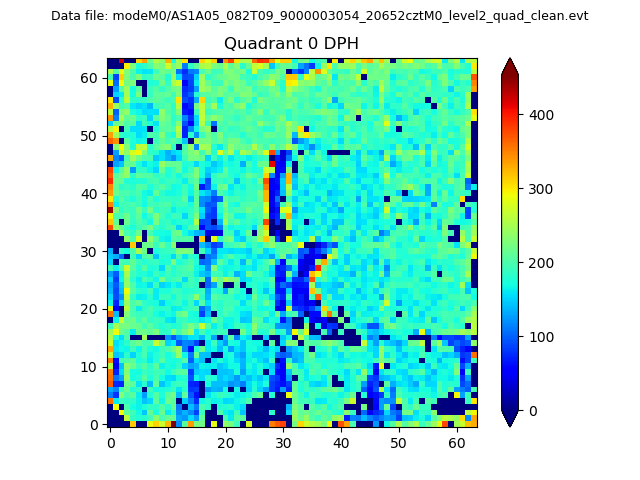 |
 |
Quadrant B |
|---|---|---|---|
| Quadrant D | 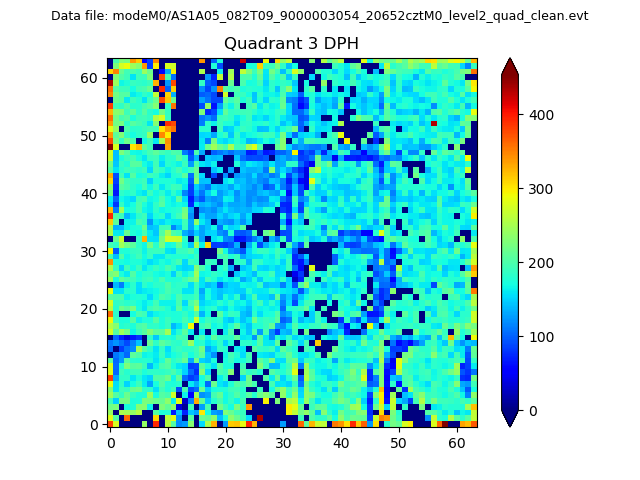 |
 |
Quadrant C |
| Plot type | Count rate plots | Images |
|---|---|---|
| Comparison with Poisson distribution Blue bars denote a histogram of data divided into 1 sec bins. Red curve is a Poisson curve with rate = median count rate of data. |
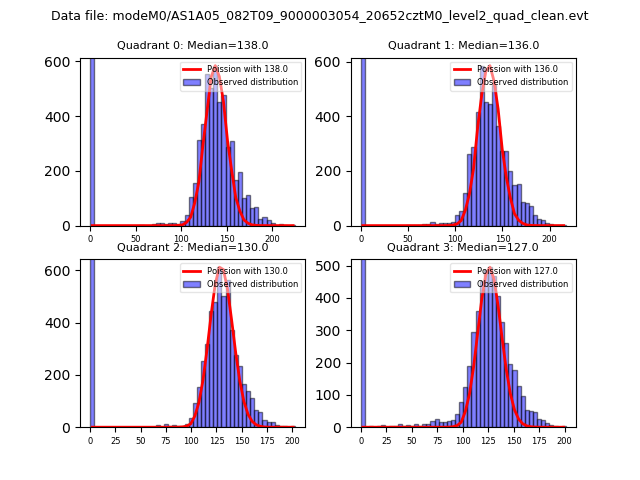 |
 |
| Quadrant-wise count rates Data is divided into 100 sec bins |
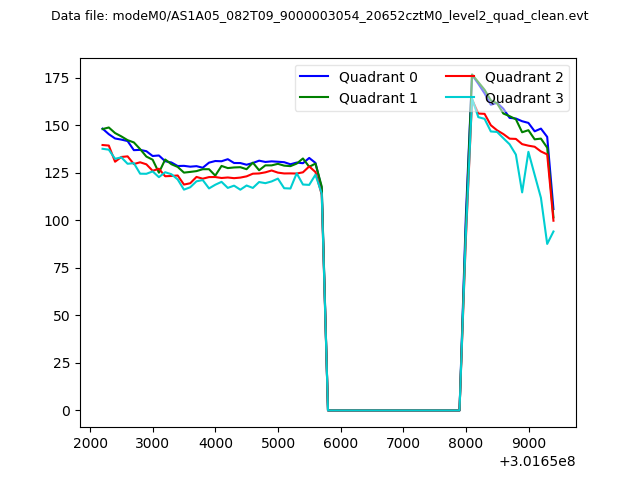 |
|
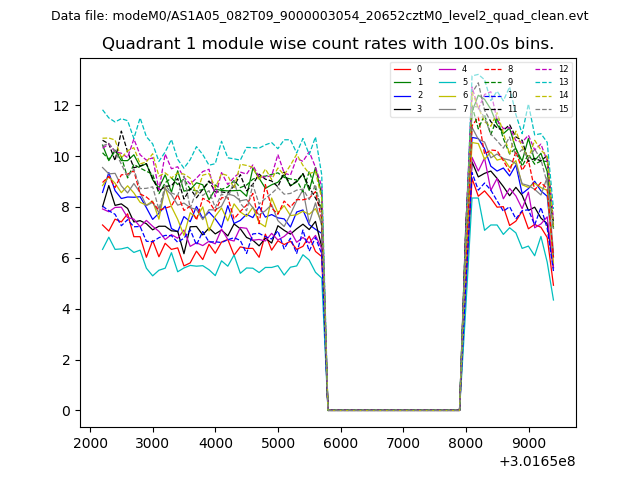
| Module-wise count rates for Quadrant A Data is divided into 100 sec bins |
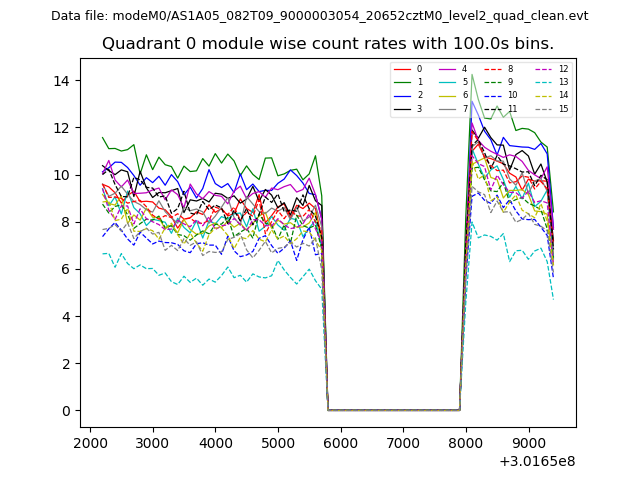 |
 |
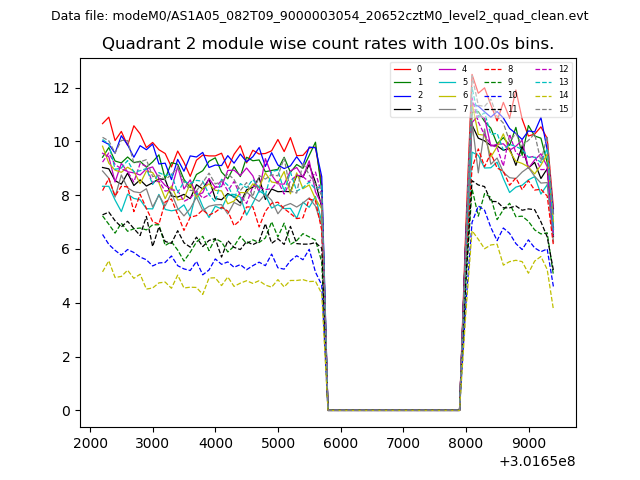
| Module-wise count rates for Quadrant B Data is divided into 100 sec bins |
 |
 |
| Module-wise count rates for Quadrant C Data is divided into 100 sec bins |
 |
 |
| Module-wise count rates for Quadrant D Data is divided into 100 sec bins |
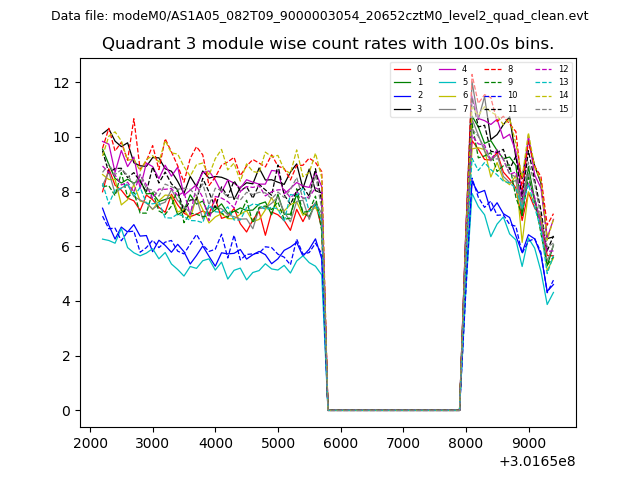 |
 |
| Parameter | Plot |
|---|---|
| CZT HV Monitor | 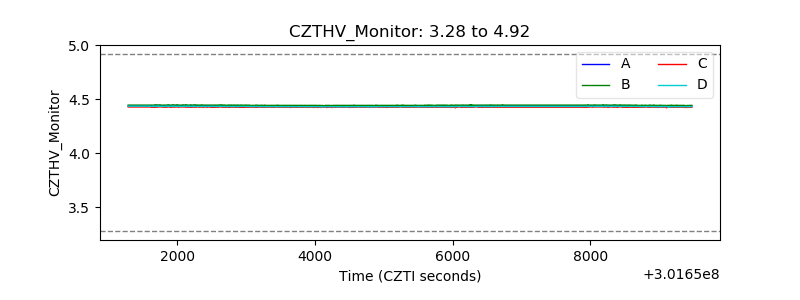 |
| D_VDD | 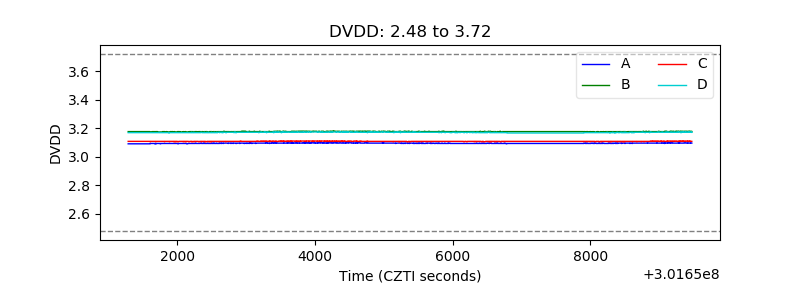 |
| Temperature 1 | 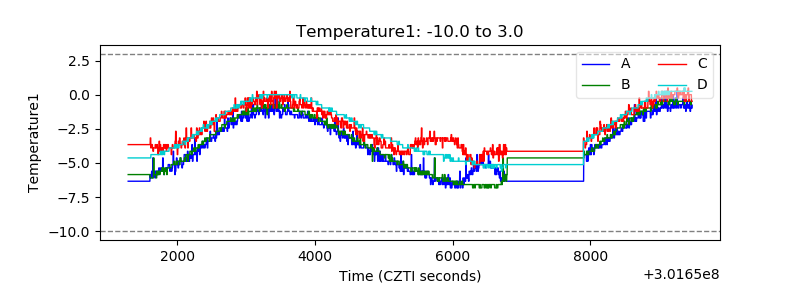 |
| Veto HV Monitor | 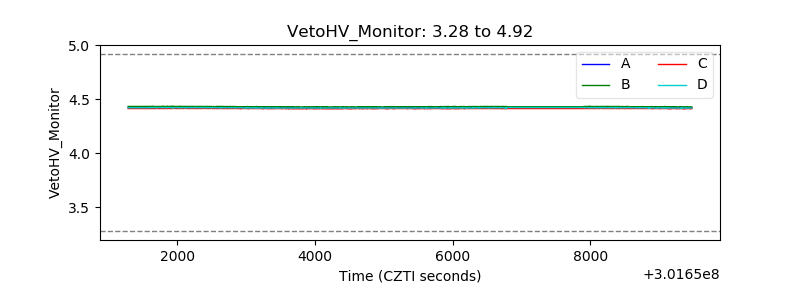 |
| Veto LLD | 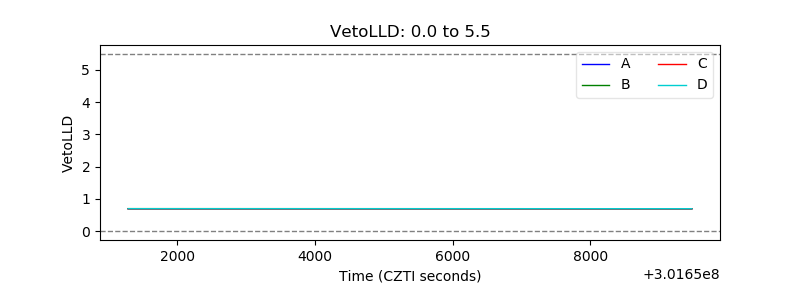 |
| Alpha Counter | 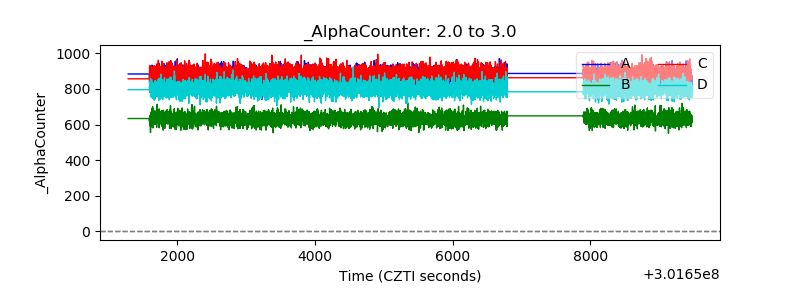 |
| _CPM_Rate | 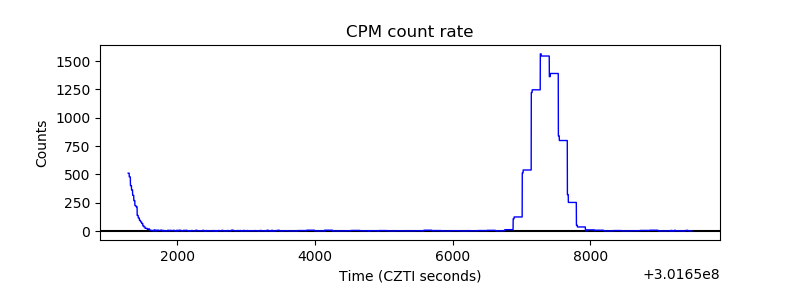 |
| CZT Counter | 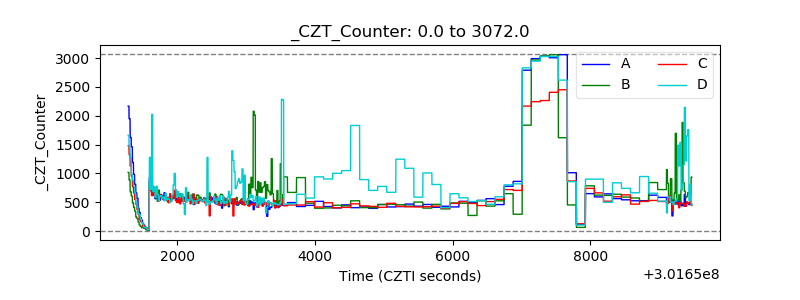 |
| +2.5 Volts monitor |  |
| +5 Volts monitor |  |
| _ROLL_ROT |  |
| _Roll_DEC | 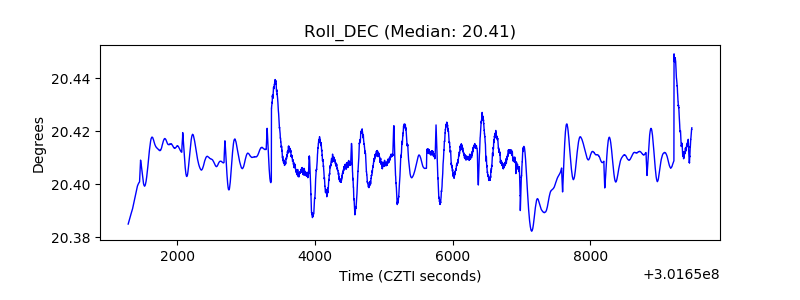 |
| _Roll_RA | 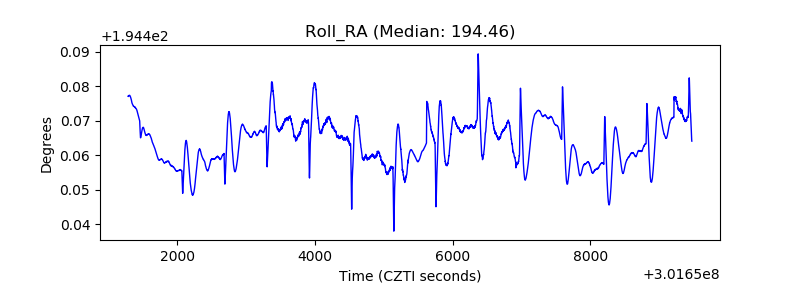 |
| Veto Counter | 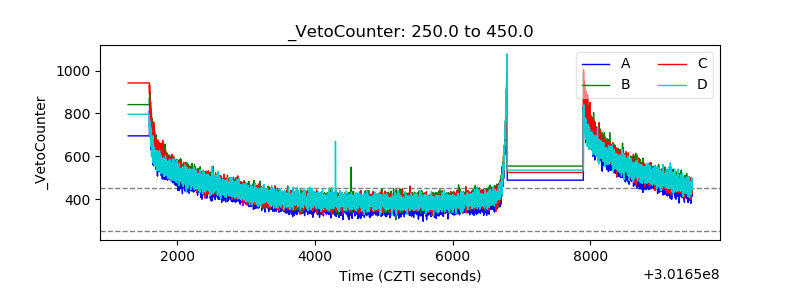 |