| Param | Original file | Final file |
|---|---|---|
| Filename | modeM0/AS1A05_082T09_9000003054_20653cztM0_level2.evt | modeM0/AS1A05_082T09_9000003054_20653cztM0_level2_quad_clean.evt |
| Size (bytes) | 460,408,320 | 95,696,640 |
| Size | 439.1 MB | 91.3 MB |
| Events in quadrant A | 2,855,954 | 655,657 |
| Events in quadrant B | 3,447,731 | 647,608 |
| Events in quadrant C | 2,943,812 | 614,154 |
| Events in quadrant D | 4,310,314 | 583,438 |
| Mode M9 | |||
|---|---|---|---|
| Quadrant | BADHDUFLAG | Total packets | Discarded packets |
| A | 0 | 12 | 0 |
| B | 0 | 12 | 0 |
| C | 0 | 12 | 0 |
| D | 0 | 12 | 0 |
| Mode M0 | |||
|---|---|---|---|
| Quadrant | BADHDUFLAG | Total packets | Discarded packets |
| A | 0 | 12111 | 1 |
| B | 0 | 14019 | 1 |
| C | 0 | 12263 | 2 |
| D | 0 | 16635 | 1 |
| Mode SS | |||
|---|---|---|---|
| Quadrant | BADHDUFLAG | Total packets | Discarded packets |
| A | 0 | 116 | 0 |
| B | 0 | 116 | 0 |
| C | 0 | 116 | 0 |
| D | 0 | 116 | 0 |
| Quadrant | Total seconds | Saturated seconds | Saturation percentage |
|---|---|---|---|
| A | 5678 | 57 | 1.003875% |
| B | 5679 | 106 | 1.866526% |
| C | 5678 | 97 | 1.708348% |
| D | 5678 | 428 | 7.537865% |
Noise dominated data is calculated using 1-second bins in cleaned event files. If a bin has >2000 counts, and if more than 50% of those come from <1% of pixels, then it is considered to be noise-dominated and hence unusable.
| Quadrant | # 1 sec bins | Bins with >0 counts | Bins with >2000 counts | High rate bins dominated by noise | Noise dominated (total time) | Noise dominated (detector-on time) | Marked lightcurve |
|---|---|---|---|---|---|---|---|
| A | 6873 | 5679 | 0 | 0 | 0.00% | 0.00% | 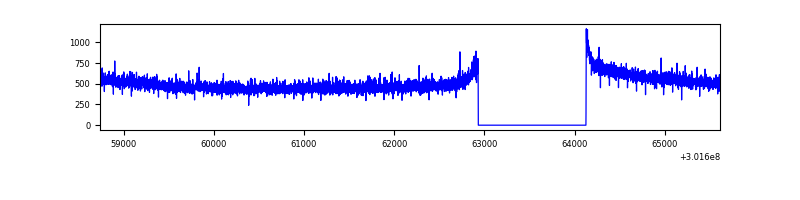 |
| B | 6874 | 5680 | 22 | 22 | 0.32% | 0.39% | 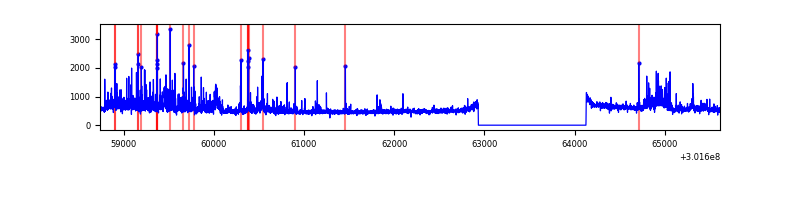 |
| C | 6873 | 5678 | 10 | 10 | 0.15% | 0.18% | 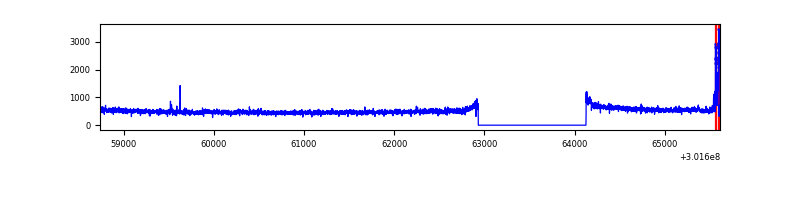 |
| D | 6873 | 5679 | 235 | 235 | 3.42% | 4.14% | 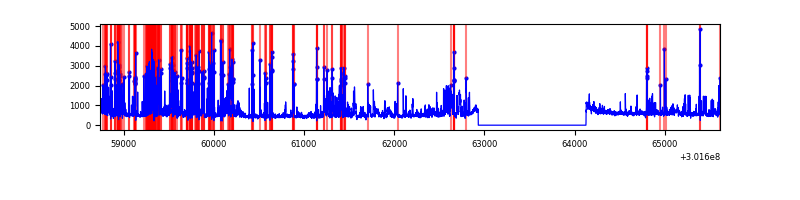 |
Top three noisy pixels from each quadrant. If the there are fewer than three noisy pixels in the level2.evt file, extra rows are filled as -1
| Pixel properties | Quadrant properties | ||||||
|---|---|---|---|---|---|---|---|
| Quadrant | DetID | PixID | Counts | Sigma | Mean | Median | Sigma |
| A | 0 | 226 | 6651 | 39.91 | 741 | 726 | 148.5 |
| A | 12 | 194 | 5755 | 33.87 | 741 | 726 | 148.5 |
| A | 3 | 137 | 5446 | 31.79 | 741 | 726 | 148.5 |
| B | 7 | 220 | 296785 | 2139.67 | 729 | 712 | 138.4 |
| B | 0 | 190 | 75701 | 541.93 | 729 | 712 | 138.4 |
| B | 4 | 216 | 71847 | 514.08 | 729 | 712 | 138.4 |
| C | 14 | 238 | 109290 | 673.63 | 695 | 700 | 161.2 |
| C | 9 | 54 | 42751 | 260.86 | 695 | 700 | 161.2 |
| C | 0 | 207 | 26743 | 161.55 | 695 | 700 | 161.2 |
| D | 1 | 52 | 1284648 | 7552.43 | 696 | 677 | 170.0 |
| D | 7 | 238 | 135167 | 791.08 | 696 | 677 | 170.0 |
| D | 13 | 153 | 57930 | 336.77 | 696 | 677 | 170.0 |
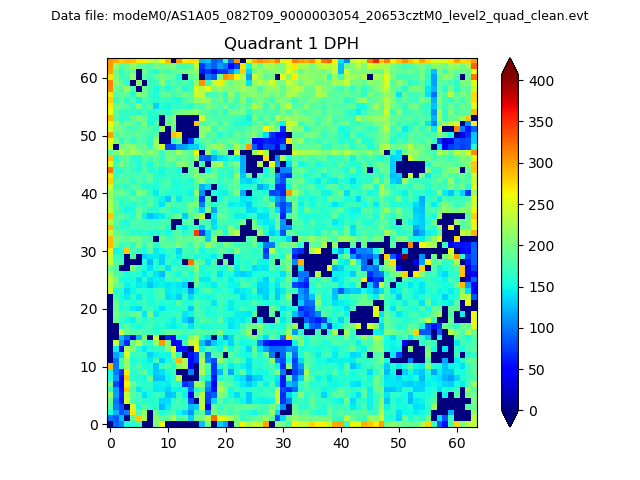
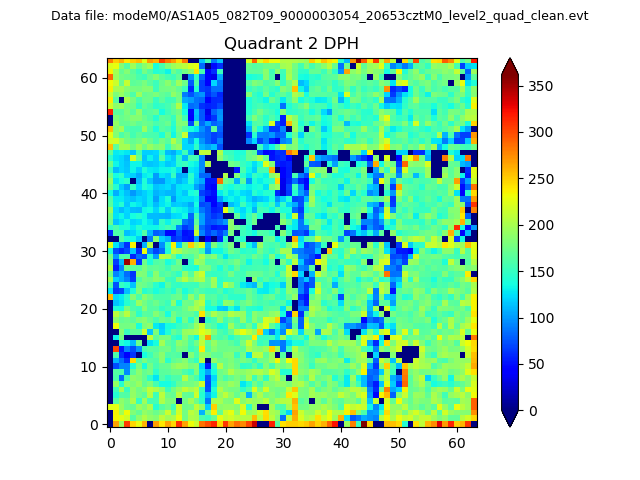
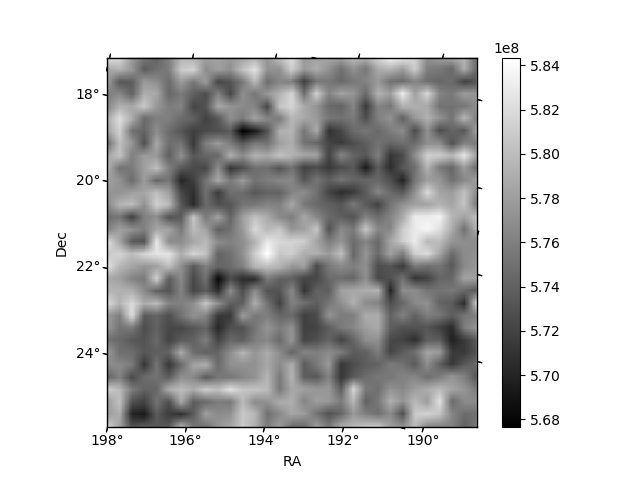
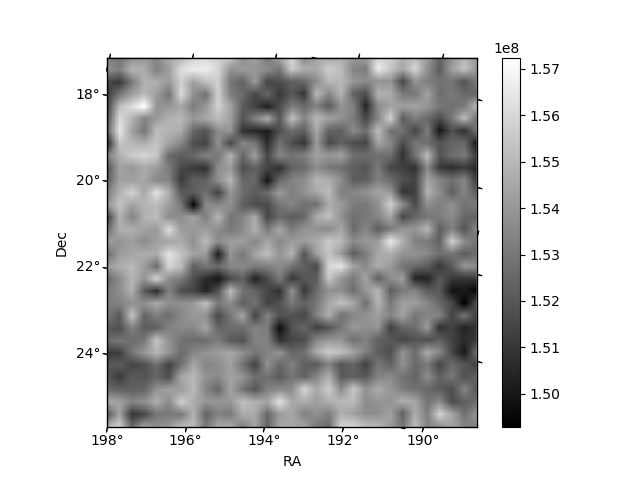
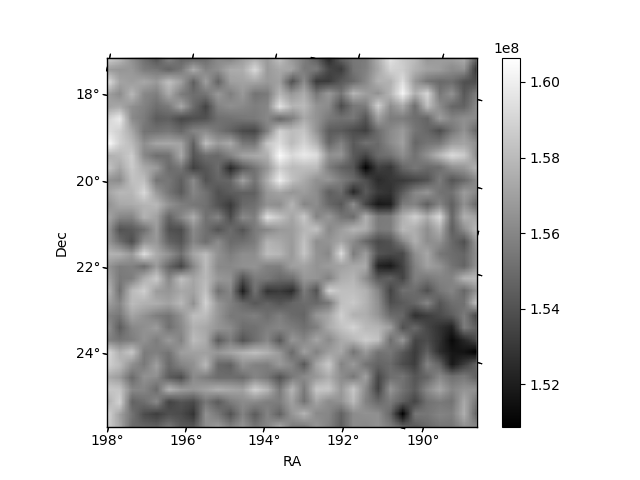
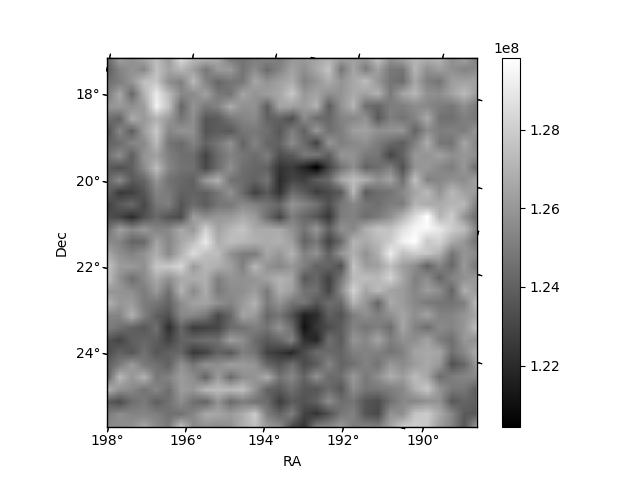
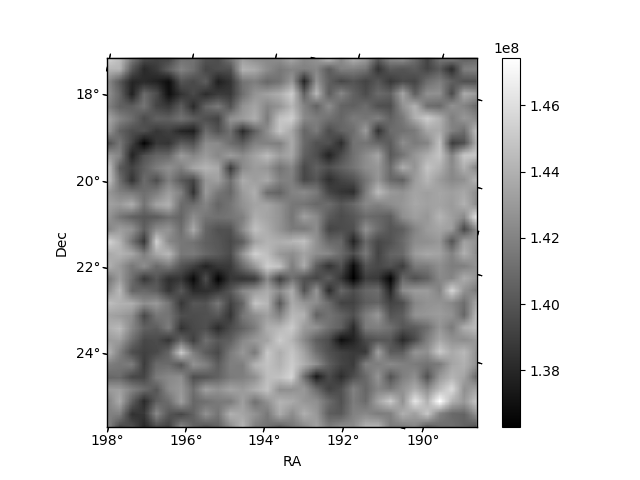
Histogram calculated using DETX and DETY for each event in the final _common_clean file
| Quadrant A |  |
 |
Quadrant B |
|---|---|---|---|
| Quadrant D | 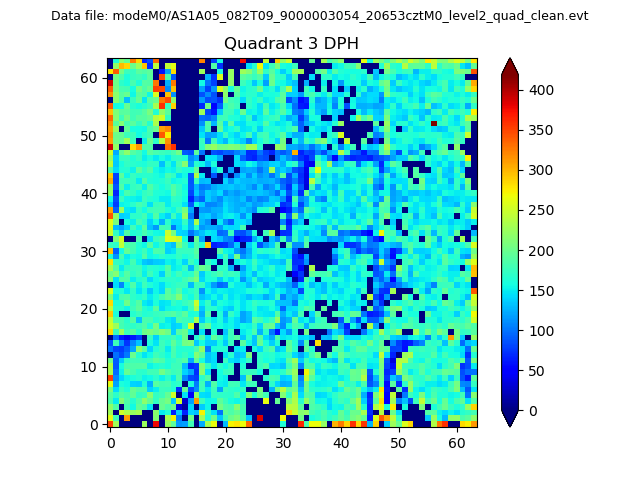 |
 |
Quadrant C |
| Plot type | Count rate plots | Images |
|---|---|---|
| Comparison with Poisson distribution Blue bars denote a histogram of data divided into 1 sec bins. Red curve is a Poisson curve with rate = median count rate of data. |
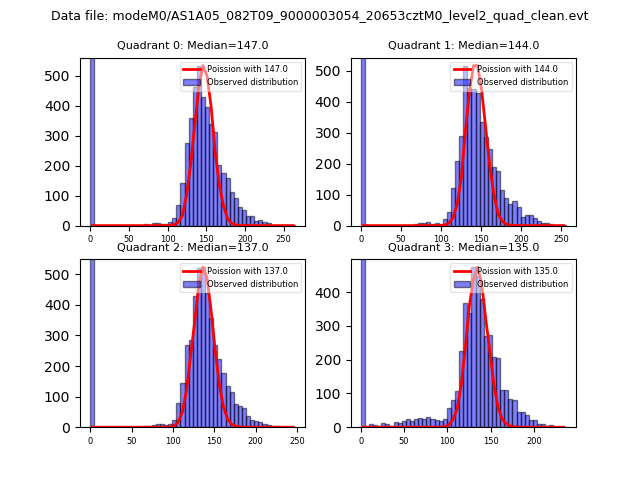 |
 |
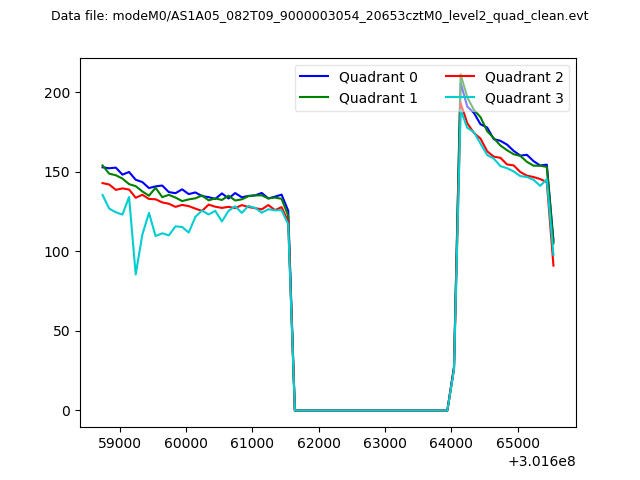
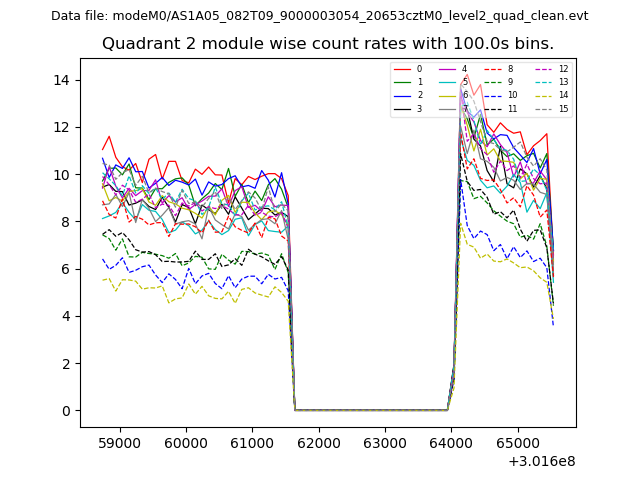
| Quadrant-wise count rates Data is divided into 100 sec bins |
 |
|
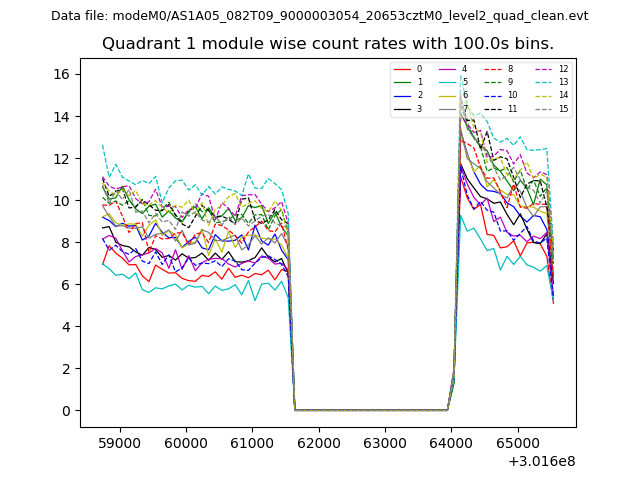
| Module-wise count rates for Quadrant A Data is divided into 100 sec bins |
 |
 |
| Module-wise count rates for Quadrant B Data is divided into 100 sec bins |
 |
 |
| Module-wise count rates for Quadrant C Data is divided into 100 sec bins |
 |
 |
| Module-wise count rates for Quadrant D Data is divided into 100 sec bins |
 |
 |
| Parameter | Plot |
|---|---|
| CZT HV Monitor | 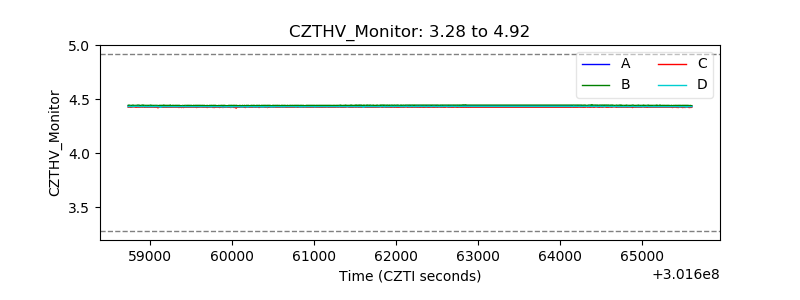 |
| D_VDD | 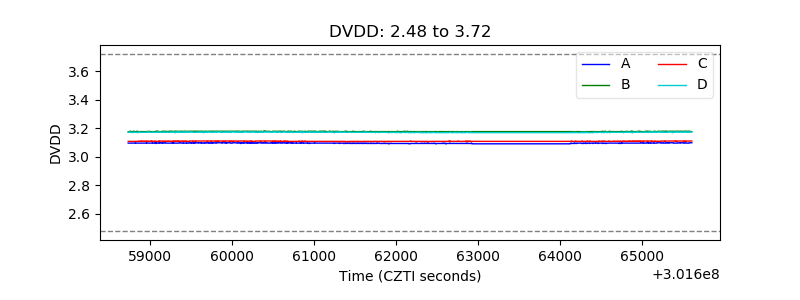 |
| Temperature 1 | 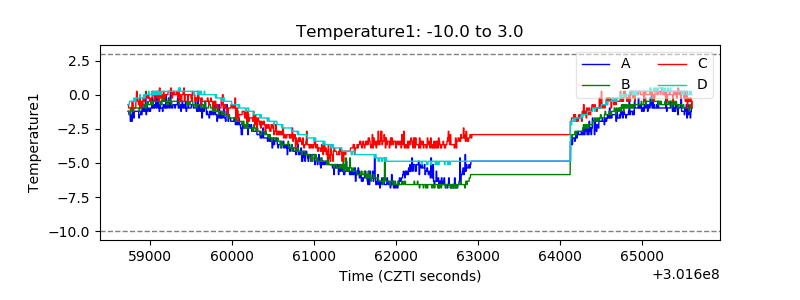 |
| Veto HV Monitor | 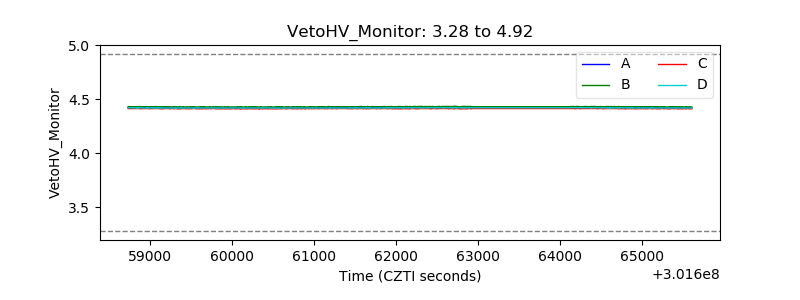 |
| Veto LLD |  |
| Alpha Counter | 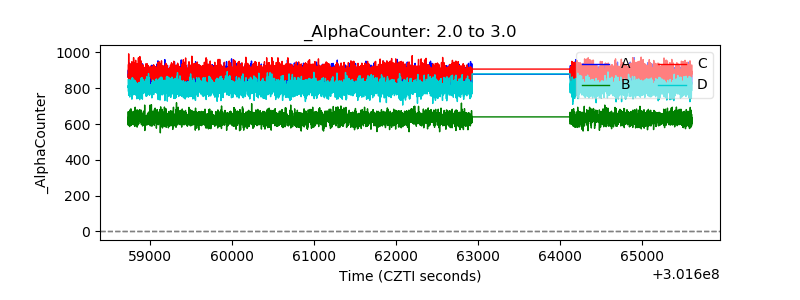 |
| _CPM_Rate | 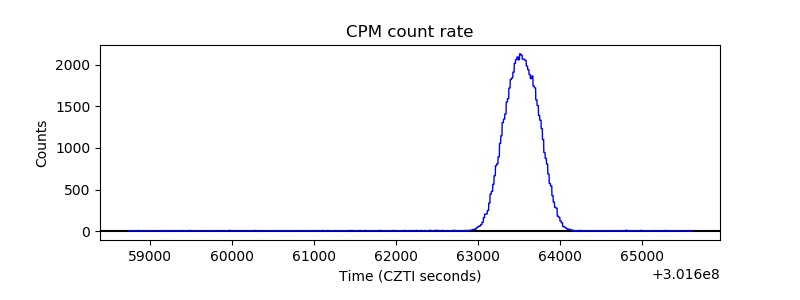 |
| CZT Counter | 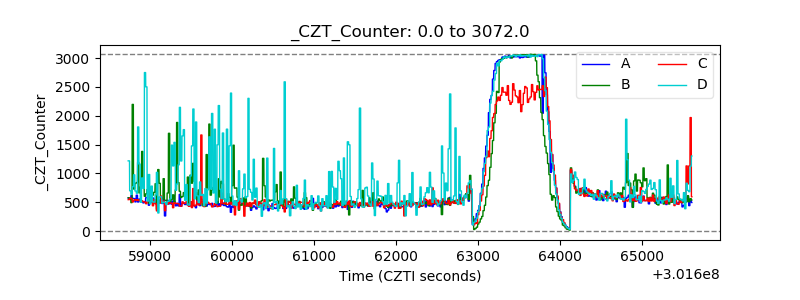 |
| +2.5 Volts monitor |  |
| +5 Volts monitor |  |
| _ROLL_ROT | 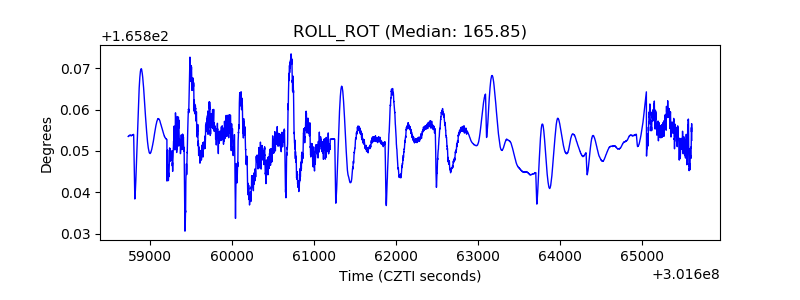 |
| _Roll_DEC | 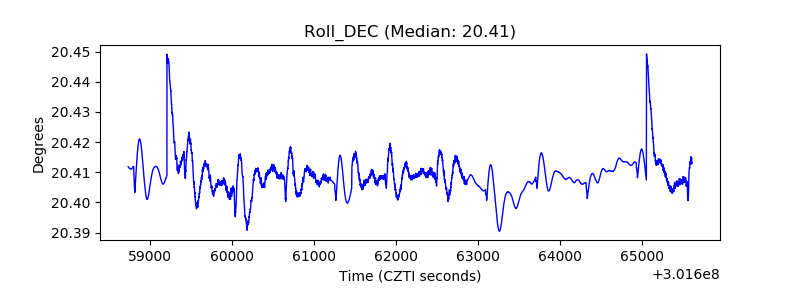 |
| _Roll_RA | 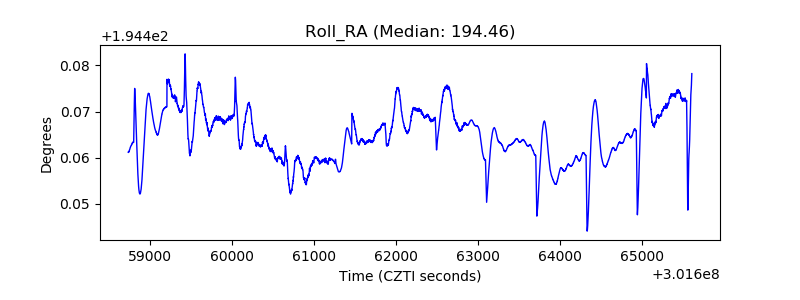 |
| Veto Counter | 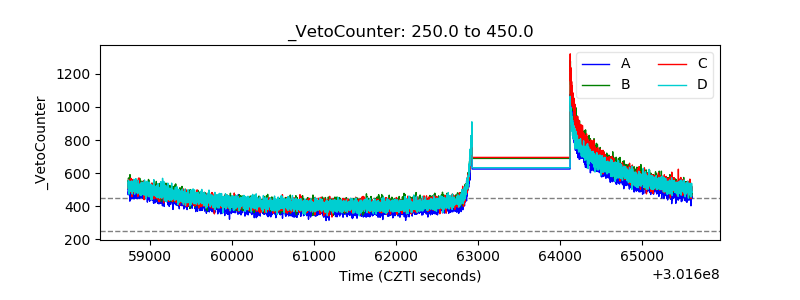 |