| Param | Original file | Final file |
|---|---|---|
| Filename | modeM0/AS1A05_082T09_9000003054_20654cztM0_level2.evt | modeM0/AS1A05_082T09_9000003054_20654cztM0_level2_quad_clean.evt |
| Size (bytes) | 493,683,840 | 106,891,200 |
| Size | 470.8 MB | 101.9 MB |
| Events in quadrant A | 3,231,377 | 729,085 |
| Events in quadrant B | 3,686,993 | 721,366 |
| Events in quadrant C | 3,470,302 | 680,834 |
| Events in quadrant D | 4,139,255 | 670,474 |
| Mode M9 | |||
|---|---|---|---|
| Quadrant | BADHDUFLAG | Total packets | Discarded packets |
| A | 0 | 13 | 0 |
| B | 0 | 13 | 0 |
| C | 0 | 13 | 0 |
| D | 0 | 13 | 0 |
| Mode M0 | |||
|---|---|---|---|
| Quadrant | BADHDUFLAG | Total packets | Discarded packets |
| A | 0 | 13532 | 1 |
| B | 0 | 15046 | 1 |
| C | 0 | 14187 | 2 |
| D | 0 | 16471 | 1 |
| Mode SS | |||
|---|---|---|---|
| Quadrant | BADHDUFLAG | Total packets | Discarded packets |
| A | 0 | 126 | 0 |
| B | 0 | 126 | 0 |
| C | 0 | 126 | 0 |
| D | 0 | 126 | 0 |
| Quadrant | Total seconds | Saturated seconds | Saturation percentage |
|---|---|---|---|
| A | 6243 | 65 | 1.041166% |
| B | 6244 | 103 | 1.649584% |
| C | 6243 | 123 | 1.970207% |
| D | 6243 | 157 | 2.514817% |
Noise dominated data is calculated using 1-second bins in cleaned event files. If a bin has >2000 counts, and if more than 50% of those come from <1% of pixels, then it is considered to be noise-dominated and hence unusable.
| Quadrant | # 1 sec bins | Bins with >0 counts | Bins with >2000 counts | High rate bins dominated by noise | Noise dominated (total time) | Noise dominated (detector-on time) | Marked lightcurve |
|---|---|---|---|---|---|---|---|
| A | 7538 | 6244 | 0 | 0 | 0.00% | 0.00% | 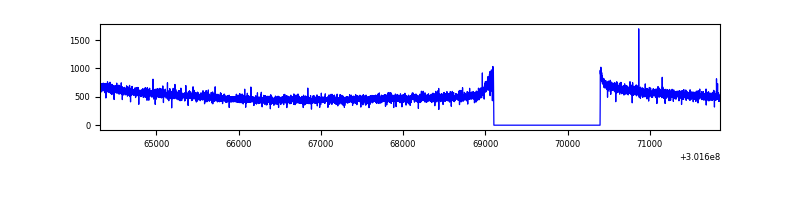 |
| B | 7539 | 6245 | 18 | 18 | 0.24% | 0.29% | 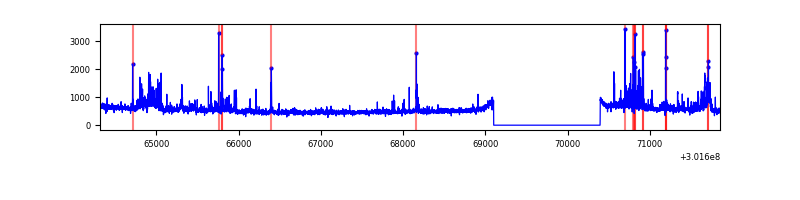 |
| C | 7538 | 6244 | 16 | 16 | 0.21% | 0.26% | 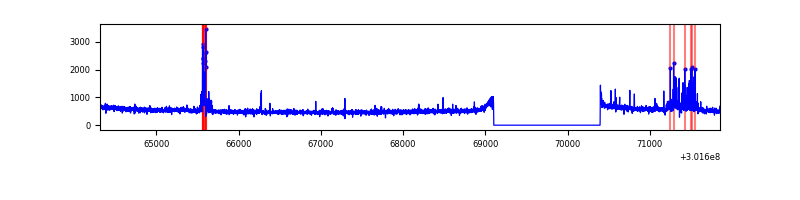 |
| D | 7538 | 6244 | 69 | 69 | 0.92% | 1.11% | 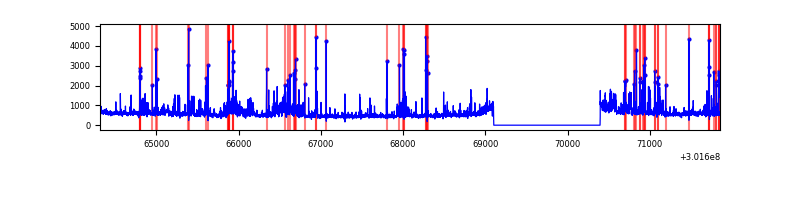 |
Top three noisy pixels from each quadrant. If the there are fewer than three noisy pixels in the level2.evt file, extra rows are filled as -1
| Pixel properties | Quadrant properties | ||||||
|---|---|---|---|---|---|---|---|
| Quadrant | DetID | PixID | Counts | Sigma | Mean | Median | Sigma |
| A | 0 | 226 | 7577 | 40.24 | 840 | 825 | 167.8 |
| A | 12 | 194 | 6208 | 32.08 | 840 | 825 | 167.8 |
| A | 3 | 137 | 5933 | 30.44 | 840 | 825 | 167.8 |
| B | 7 | 220 | 144790 | 928.42 | 826 | 809 | 155.1 |
| B | 0 | 228 | 90179 | 576.27 | 826 | 809 | 155.1 |
| B | 0 | 190 | 79018 | 504.3 | 826 | 809 | 155.1 |
| C | 0 | 207 | 136850 | 742.86 | 790 | 798 | 183.1 |
| C | 14 | 238 | 124657 | 676.29 | 790 | 798 | 183.1 |
| C | 9 | 54 | 47056 | 252.58 | 790 | 798 | 183.1 |
| D | 1 | 52 | 326096 | 1652.83 | 811 | 789 | 196.8 |
| D | 1 | 239 | 268084 | 1358.08 | 811 | 789 | 196.8 |
| D | 7 | 238 | 148479 | 750.39 | 811 | 789 | 196.8 |
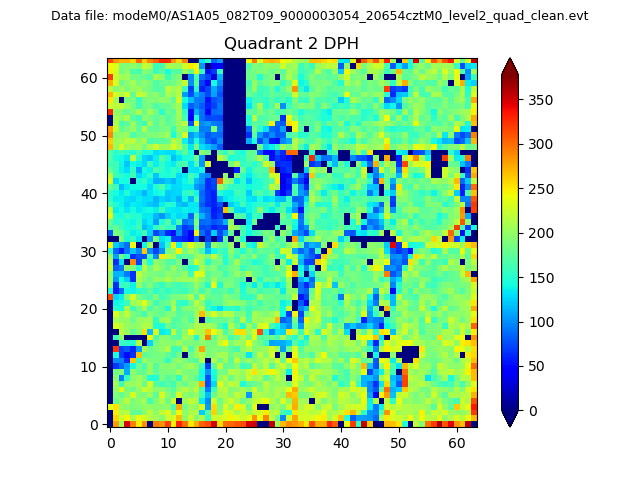
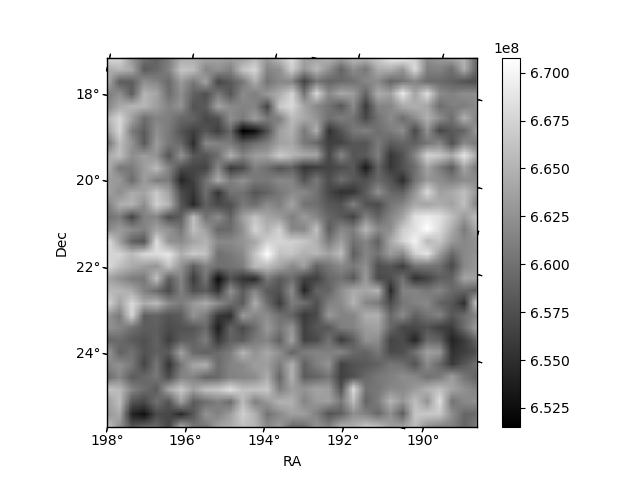
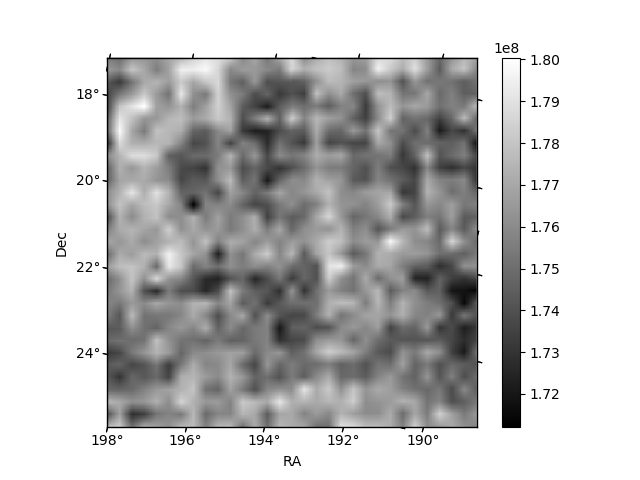
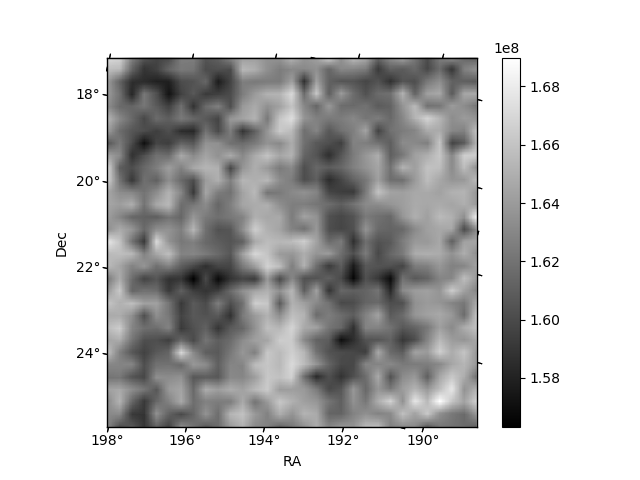
Histogram calculated using DETX and DETY for each event in the final _common_clean file
| Quadrant A | 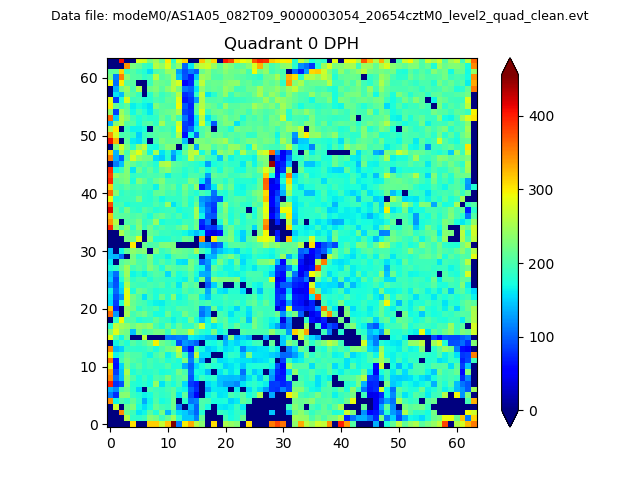 |
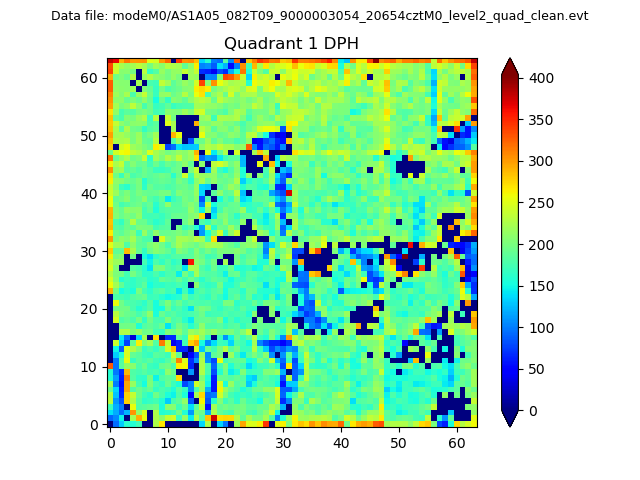 |
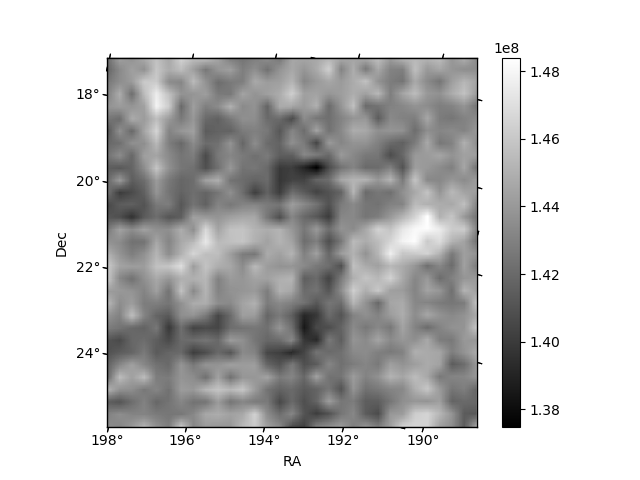
Quadrant B |
|---|---|---|---|
| Quadrant D | 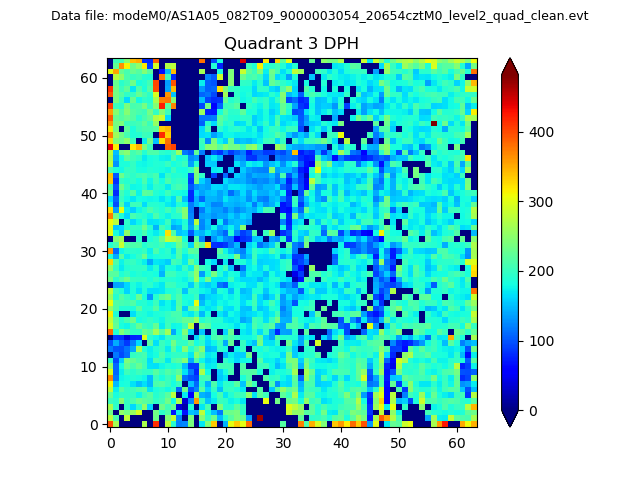 |
 |
Quadrant C |
| Plot type | Count rate plots | Images |
|---|---|---|
| Comparison with Poisson distribution Blue bars denote a histogram of data divided into 1 sec bins. Red curve is a Poisson curve with rate = median count rate of data. |
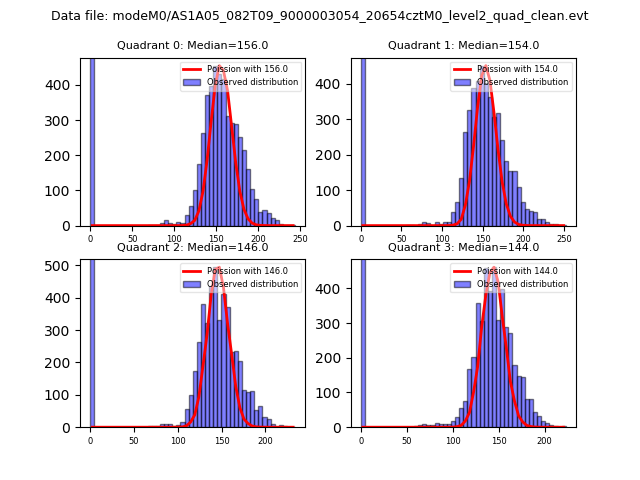 |
 |
| Quadrant-wise count rates Data is divided into 100 sec bins |
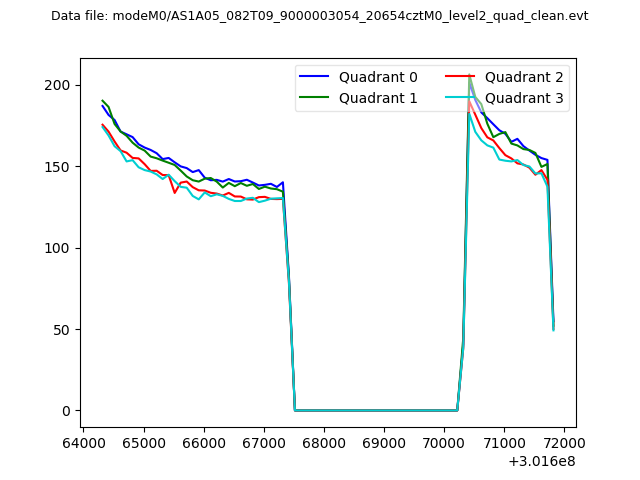 |
|
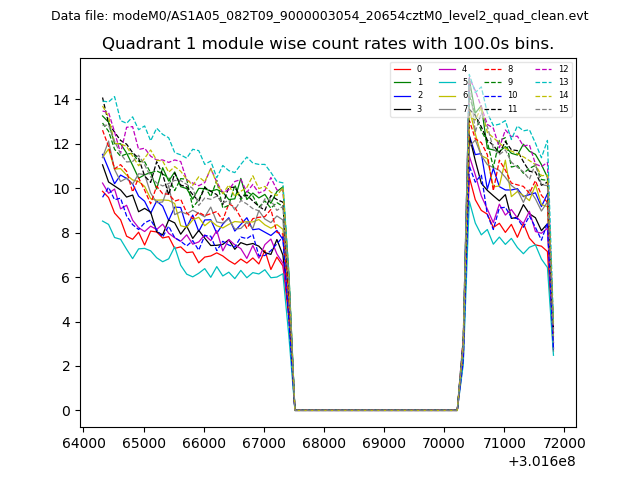
| Module-wise count rates for Quadrant A Data is divided into 100 sec bins |
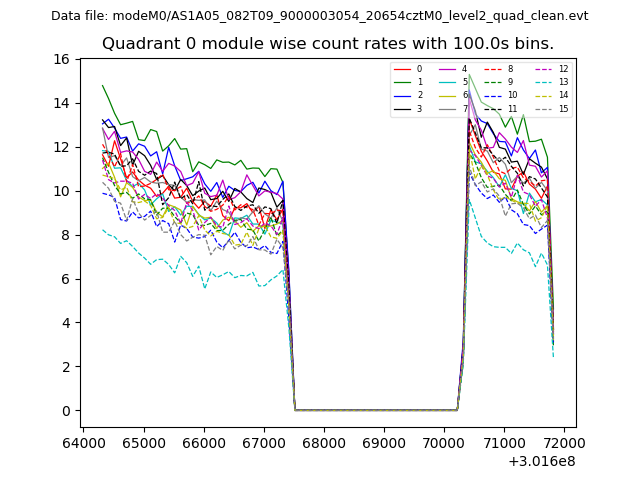 |
 |
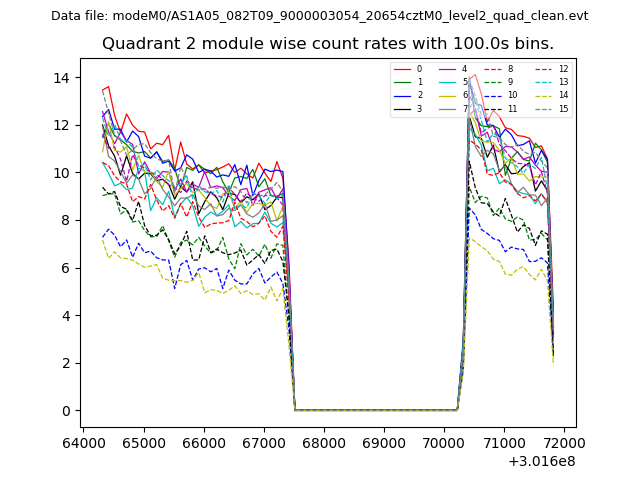
| Module-wise count rates for Quadrant B Data is divided into 100 sec bins |
 |
 |
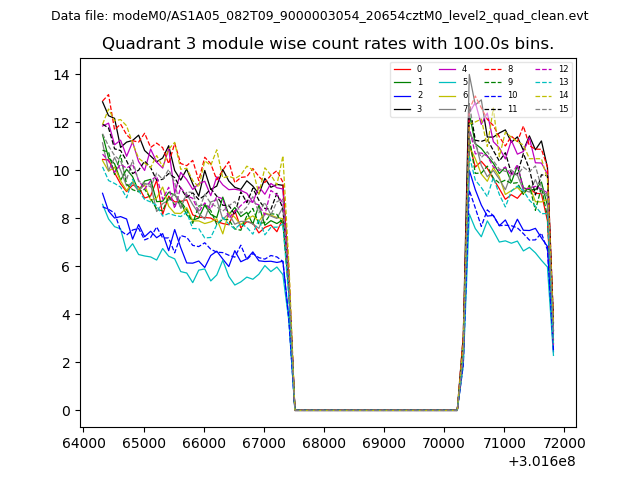
| Module-wise count rates for Quadrant C Data is divided into 100 sec bins |
 |
 |
| Module-wise count rates for Quadrant D Data is divided into 100 sec bins |
 |
 |
| Parameter | Plot |
|---|---|
| CZT HV Monitor | 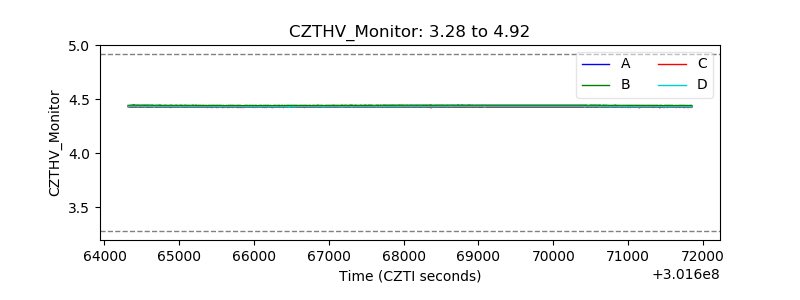 |
| D_VDD |  |
| Temperature 1 |  |
| Veto HV Monitor | 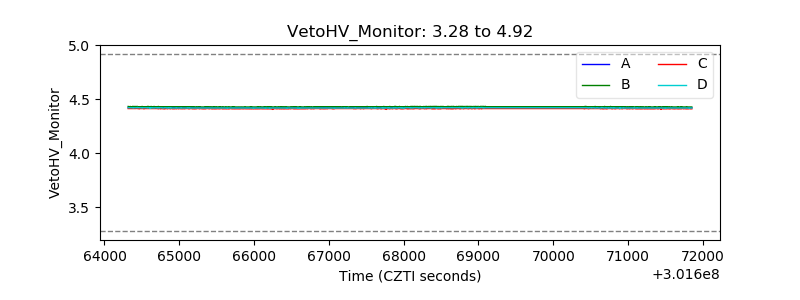 |
| Veto LLD | 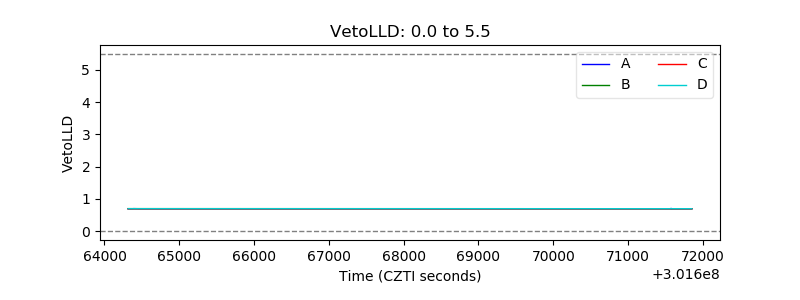 |
| Alpha Counter | 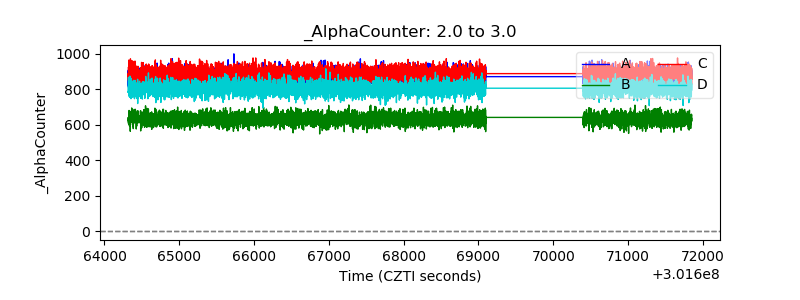 |
| _CPM_Rate | 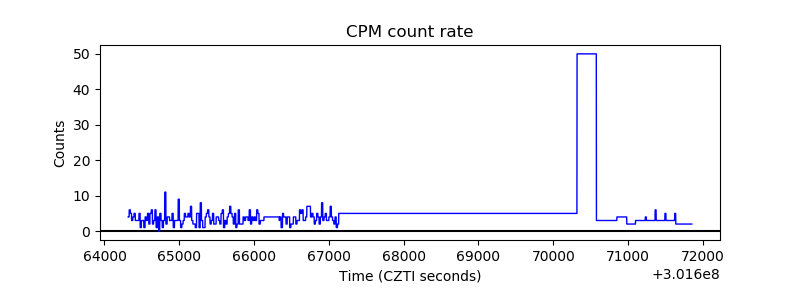 |
| CZT Counter | 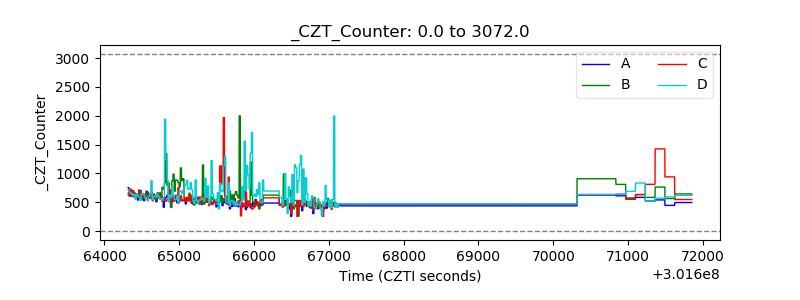 |
| +2.5 Volts monitor |  |
| +5 Volts monitor |  |
| _ROLL_ROT | 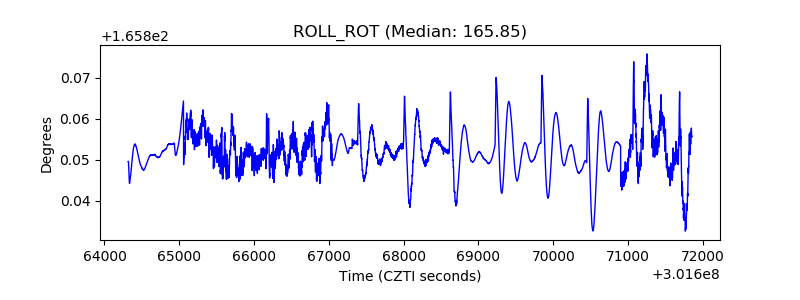 |
| _Roll_DEC | 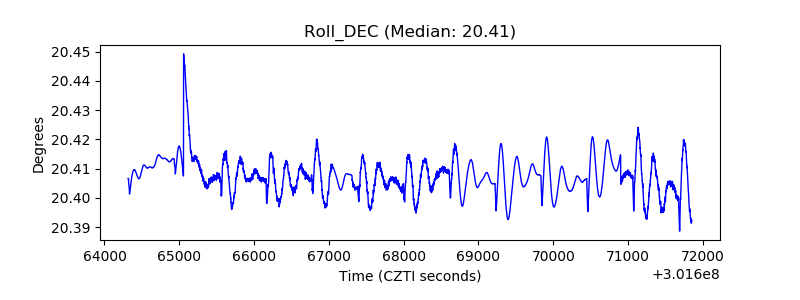 |
| _Roll_RA | 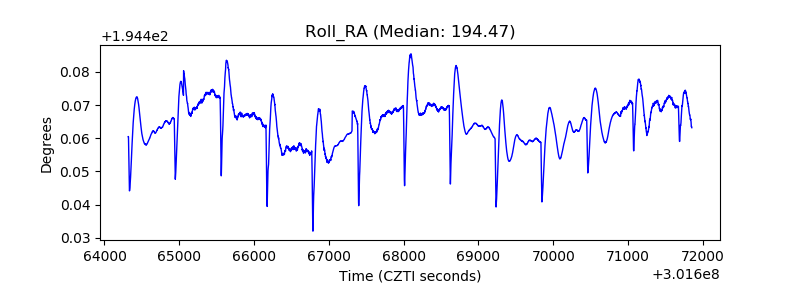 |
| Veto Counter | 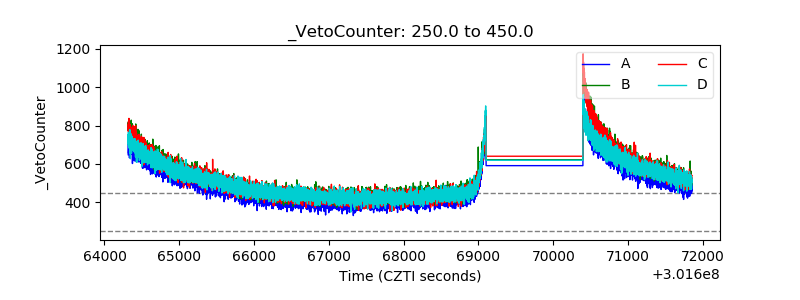 |