| Param | Original file | Final file |
|---|---|---|
| Filename | modeM0/AS1A05_082T09_9000003054_20655cztM0_level2.evt | modeM0/AS1A05_082T09_9000003054_20655cztM0_level2_quad_clean.evt |
| Size (bytes) | 498,458,880 | 109,537,920 |
| Size | 475.4 MB | 104.5 MB |
| Events in quadrant A | 3,243,640 | 744,525 |
| Events in quadrant B | 3,673,423 | 736,242 |
| Events in quadrant C | 3,513,311 | 697,192 |
| Events in quadrant D | 4,224,227 | 685,818 |
| Mode M9 | |||
|---|---|---|---|
| Quadrant | BADHDUFLAG | Total packets | Discarded packets |
| A | 0 | 13 | 0 |
| B | 0 | 13 | 0 |
| C | 0 | 13 | 0 |
| D | 0 | 13 | 0 |
| Mode M0 | |||
|---|---|---|---|
| Quadrant | BADHDUFLAG | Total packets | Discarded packets |
| A | 0 | 13691 | 1 |
| B | 0 | 15006 | 1 |
| C | 0 | 14430 | 1 |
| D | 0 | 16843 | 1 |
| Mode SS | |||
|---|---|---|---|
| Quadrant | BADHDUFLAG | Total packets | Discarded packets |
| A | 0 | 132 | 0 |
| B | 0 | 132 | 0 |
| C | 0 | 132 | 0 |
| D | 0 | 132 | 0 |
| Quadrant | Total seconds | Saturated seconds | Saturation percentage |
|---|---|---|---|
| A | 6504 | 65 | 0.999385% |
| B | 6505 | 96 | 1.475788% |
| C | 6505 | 112 | 1.721752% |
| D | 6505 | 165 | 2.536510% |
Noise dominated data is calculated using 1-second bins in cleaned event files. If a bin has >2000 counts, and if more than 50% of those come from <1% of pixels, then it is considered to be noise-dominated and hence unusable.
| Quadrant | # 1 sec bins | Bins with >0 counts | Bins with >2000 counts | High rate bins dominated by noise | Noise dominated (total time) | Noise dominated (detector-on time) | Marked lightcurve |
|---|---|---|---|---|---|---|---|
| A | 7799 | 6505 | 0 | 0 | 0.00% | 0.00% | 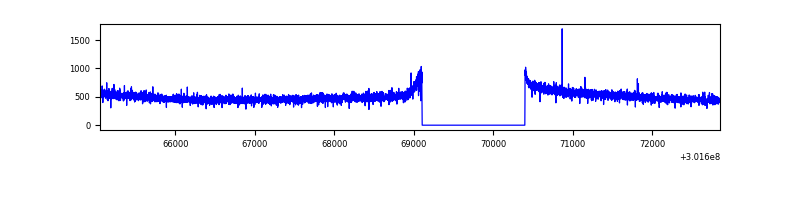 |
| B | 7800 | 6506 | 17 | 17 | 0.22% | 0.26% | 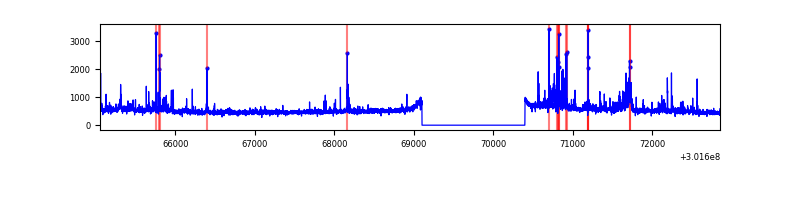 |
| C | 7800 | 6506 | 16 | 16 | 0.21% | 0.25% |  |
| D | 7800 | 6506 | 80 | 80 | 1.03% | 1.23% | 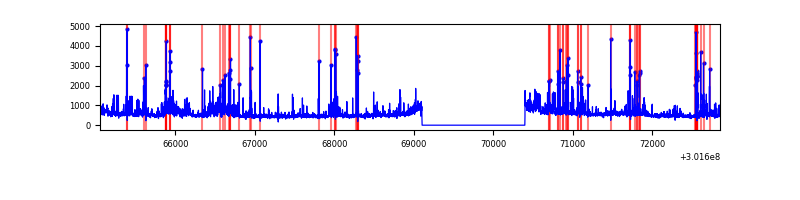 |
Top three noisy pixels from each quadrant. If the there are fewer than three noisy pixels in the level2.evt file, extra rows are filled as -1
| Pixel properties | Quadrant properties | ||||||
|---|---|---|---|---|---|---|---|
| Quadrant | DetID | PixID | Counts | Sigma | Mean | Median | Sigma |
| A | 0 | 226 | 7611 | 40.09 | 843 | 829 | 169.1 |
| A | 12 | 194 | 6356 | 32.68 | 843 | 829 | 169.1 |
| A | 3 | 137 | 5882 | 29.87 | 843 | 829 | 169.1 |
| B | 0 | 228 | 120651 | 766.91 | 833 | 815 | 156.3 |
| B | 0 | 190 | 94188 | 597.55 | 833 | 815 | 156.3 |
| B | 7 | 220 | 84551 | 535.88 | 833 | 815 | 156.3 |
| C | 0 | 207 | 138580 | 744.91 | 798 | 805 | 185.0 |
| C | 14 | 238 | 125718 | 675.37 | 798 | 805 | 185.0 |
| C | 9 | 54 | 47002 | 249.77 | 798 | 805 | 185.0 |
| D | 1 | 52 | 329723 | 1660.57 | 814 | 794 | 198.1 |
| D | 1 | 239 | 281588 | 1417.57 | 814 | 794 | 198.1 |
| D | 13 | 153 | 156651 | 786.83 | 814 | 794 | 198.1 |
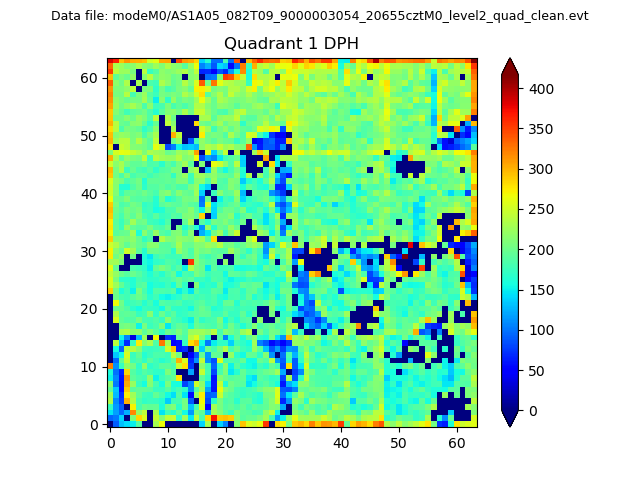
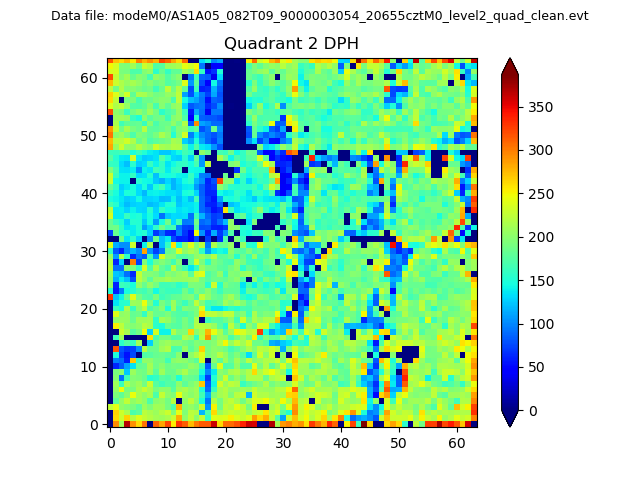
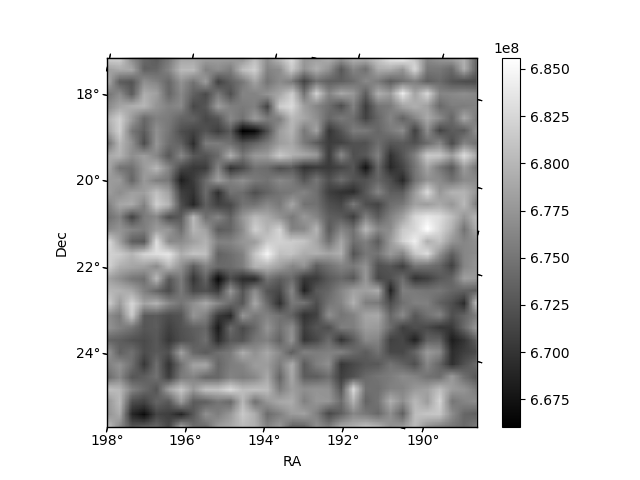
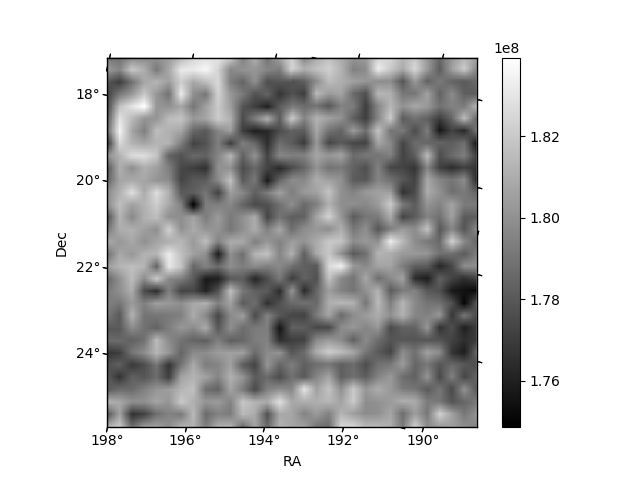
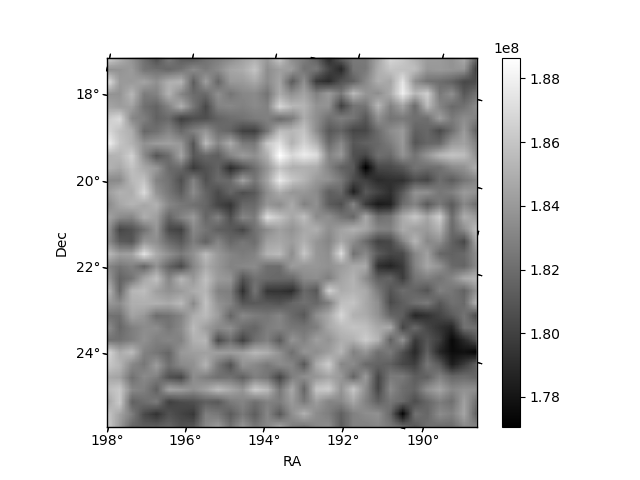
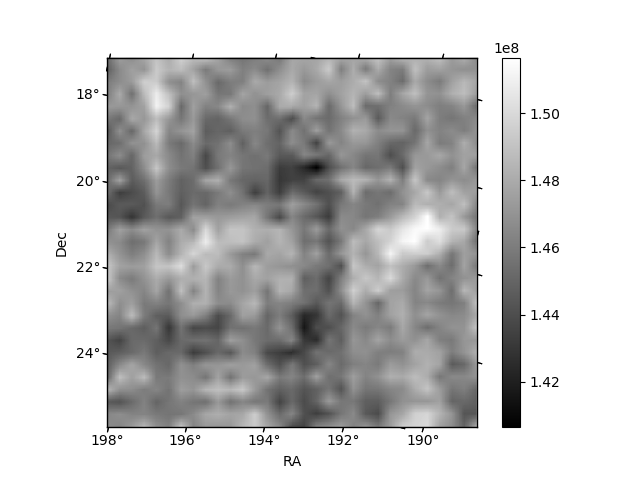
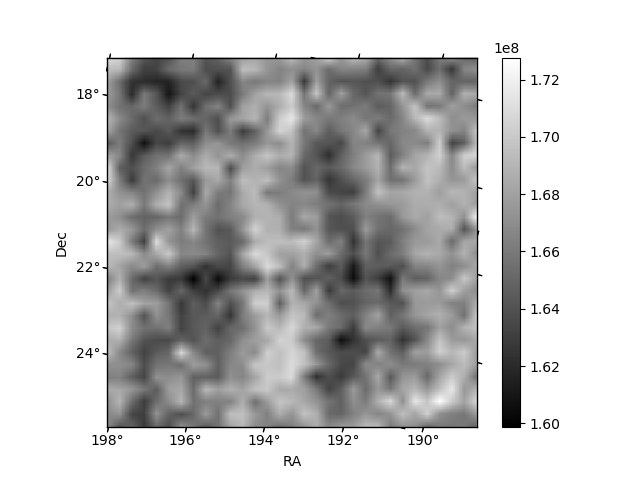
Histogram calculated using DETX and DETY for each event in the final _common_clean file
| Quadrant A | 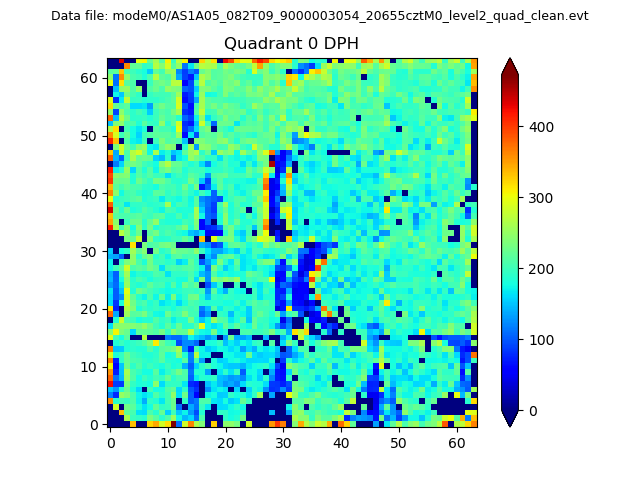 |
 |
Quadrant B |
|---|---|---|---|
| Quadrant D | 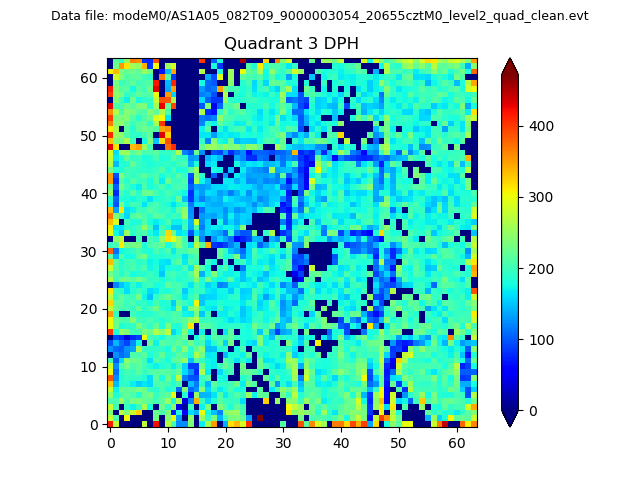 |
 |
Quadrant C |
| Plot type | Count rate plots | Images |
|---|---|---|
| Comparison with Poisson distribution Blue bars denote a histogram of data divided into 1 sec bins. Red curve is a Poisson curve with rate = median count rate of data. |
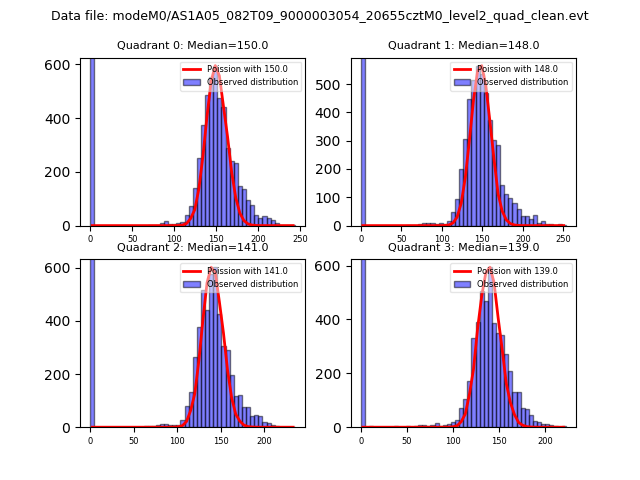 |
 |
| Quadrant-wise count rates Data is divided into 100 sec bins |
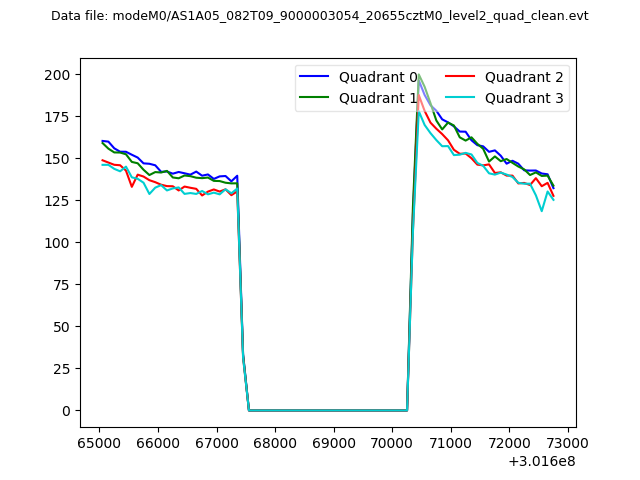 |
|
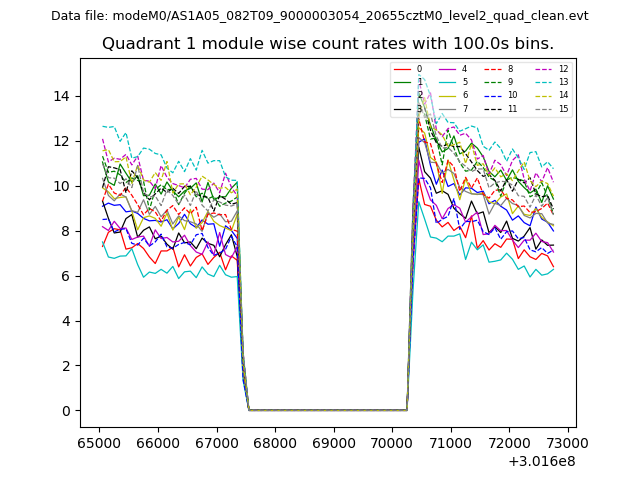
| Module-wise count rates for Quadrant A Data is divided into 100 sec bins |
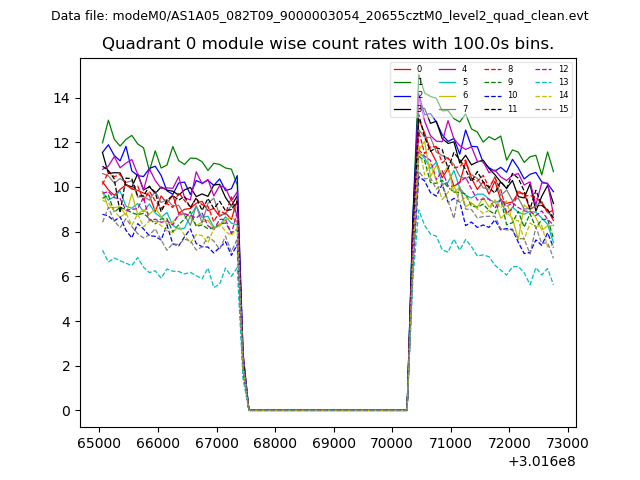 |
 |
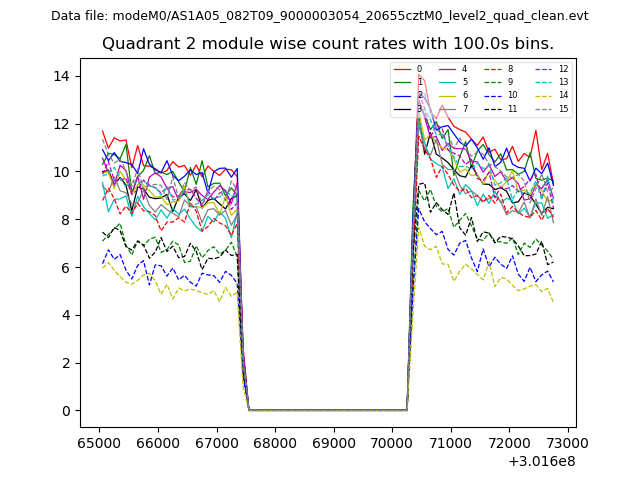
| Module-wise count rates for Quadrant B Data is divided into 100 sec bins |
 |
 |
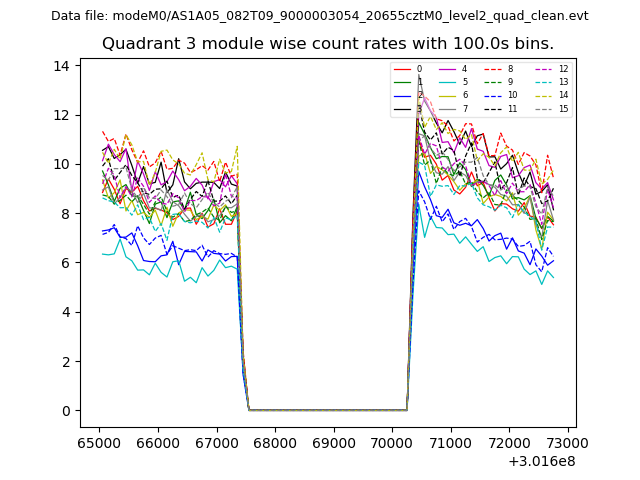
| Module-wise count rates for Quadrant C Data is divided into 100 sec bins |
 |
 |
| Module-wise count rates for Quadrant D Data is divided into 100 sec bins |
 |
 |
| Parameter | Plot |
|---|---|
| CZT HV Monitor | 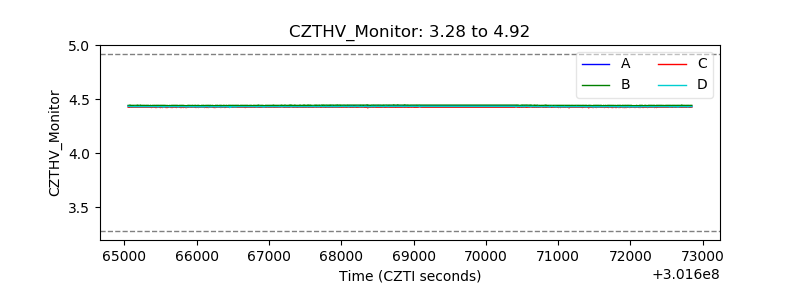 |
| D_VDD | 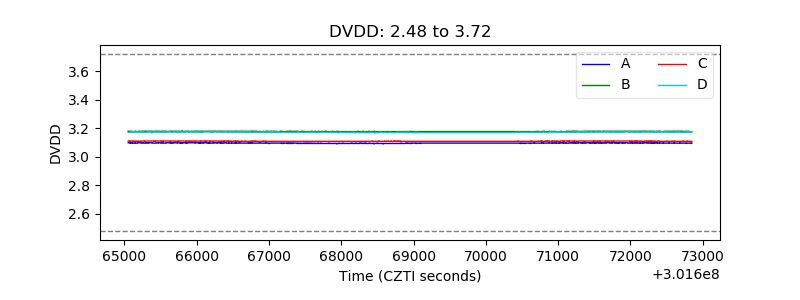 |
| Temperature 1 | 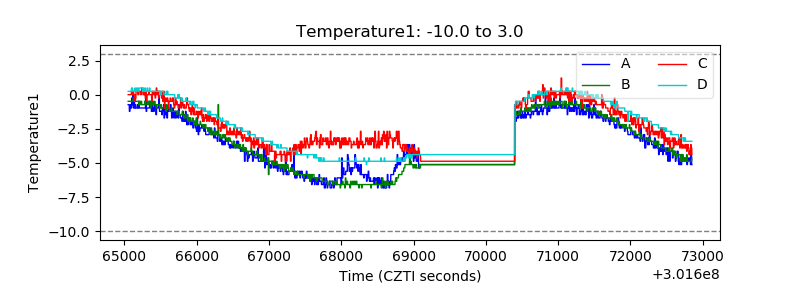 |
| Veto HV Monitor | 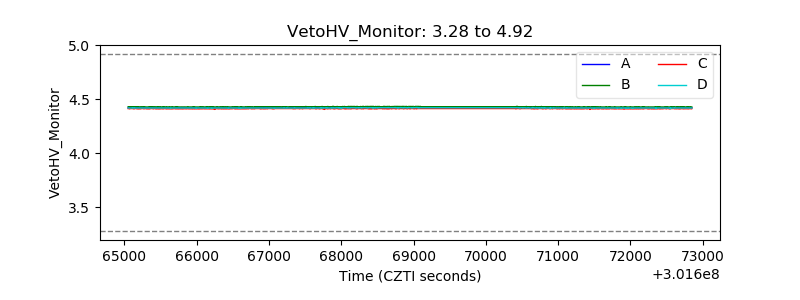 |
| Veto LLD | 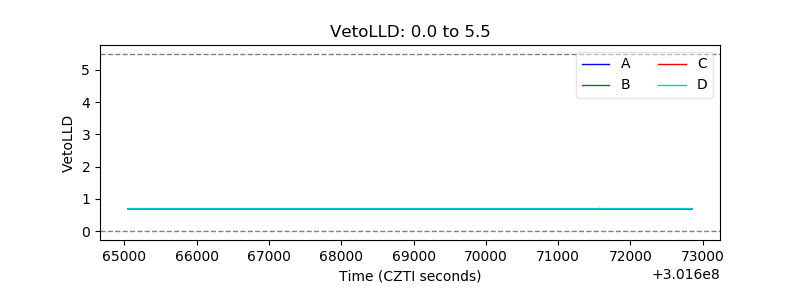 |
| Alpha Counter | 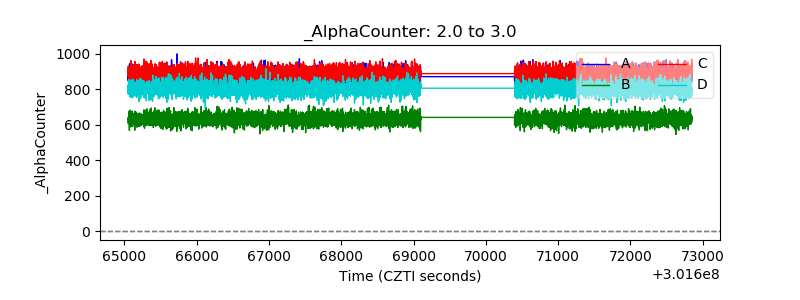 |
| _CPM_Rate | 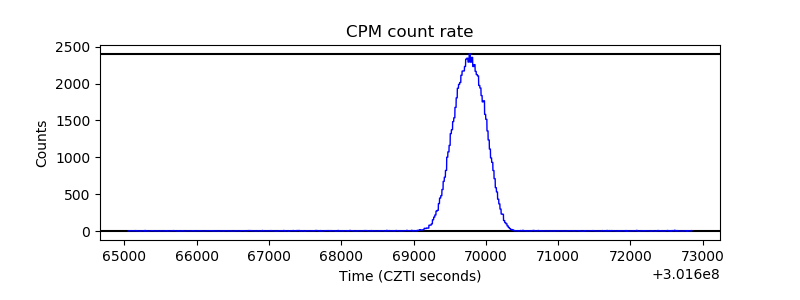 |
| CZT Counter | 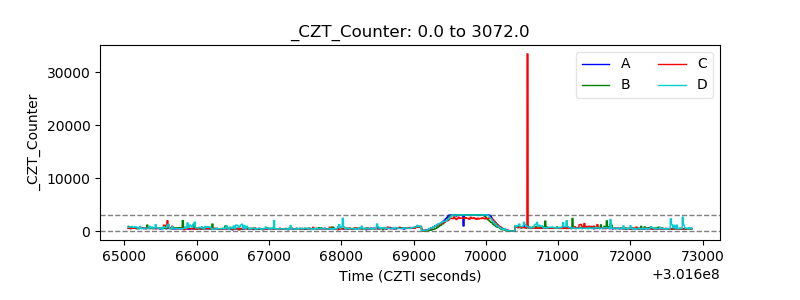 |
| +2.5 Volts monitor |  |
| +5 Volts monitor |  |
| _ROLL_ROT | 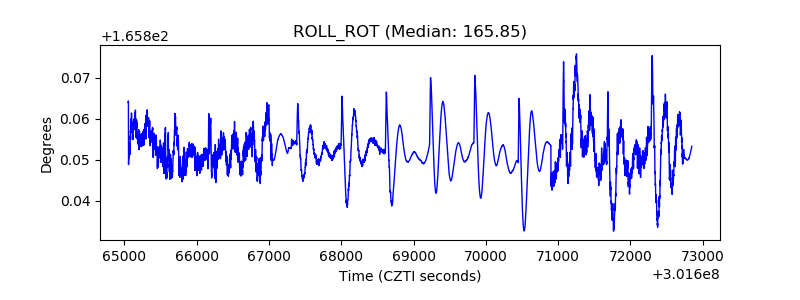 |
| _Roll_DEC |  |
| _Roll_RA | 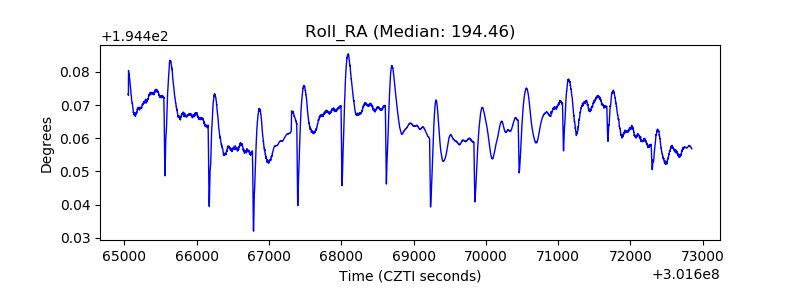 |
| Veto Counter | 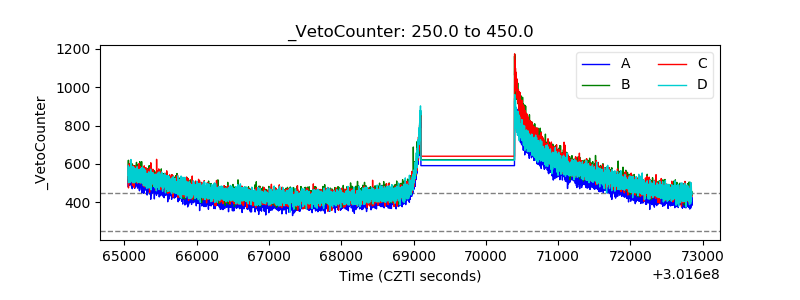 |