| Param | Original file | Final file |
|---|---|---|
| Filename | modeM0/AS1A05_103T05_9000003052cztM0_level2.fits | modeM0/AS1A05_103T05_9000003052cztM0_level2_quad_clean.evt |
| Size (bytes) | 189,169,920 | 164,396,160 |
| Size | 180.4 MB | 156.8 MB |
| Events in quadrant A | 1,170,746 | 966,254 |
| Events in quadrant B | 1,117,240 | 948,459 |
| Events in quadrant C | 1,133,818 | 908,666 |
| Events in quadrant D | 993,286 | 840,244 |
| Mode M0 | |||
|---|---|---|---|
| Quadrant | BADHDUFLAG | Total packets | Discarded packets |
| A | 0 | 40675 | 0 |
| B | 0 | 41282 | 0 |
| C | 0 | 39646 | 0 |
| D | 0 | 46156 | 0 |
| Mode M9 | |||
|---|---|---|---|
| Quadrant | BADHDUFLAG | Total packets | Discarded packets |
| A | 0 | 41 | 0 |
| B | 0 | 41 | 0 |
| C | 0 | 41 | 0 |
| D | 0 | 41 | 0 |
| Mode SS | |||
|---|---|---|---|
| Quadrant | BADHDUFLAG | Total packets | Discarded packets |
| A | 0 | 388 | 0 |
| B | 0 | 390 | 0 |
| C | 0 | 390 | 0 |
| D | 0 | 390 | 0 |
| Quadrant | Total seconds | Saturated seconds | Saturation percentage |
|---|---|---|---|
| A | 19078 | 203 | 1.064053% |
| B | 19075 | 254 | 1.331586% |
| C | 19070 | 250 | 1.310960% |
| D | 19082 | 264 | 1.383503% |
Noise dominated data is calculated using 1-second bins in cleaned event files. If a bin has >2000 counts, and if more than 50% of those come from <1% of pixels, then it is considered to be noise-dominated and hence unusable.
| Quadrant | # 1 sec bins | Bins with >0 counts | Bins with >2000 counts | High rate bins dominated by noise | Noise dominated (total time) | Noise dominated (detector-on time) | Marked lightcurve |
|---|---|---|---|---|---|---|---|
| A | 23189 | 19092 | 0 | 0 | 0.00% | 0.00% |  |
| B | 23189 | 19092 | 0 | 0 | 0.00% | 0.00% |  |
| C | 23189 | 19089 | 0 | 0 | 0.00% | 0.00% |  |
| D | 23189 | 19092 | 0 | 0 | 0.00% | 0.00% |  |
Top three noisy pixels from each quadrant. If the there are fewer than three noisy pixels in the level2.evt file, extra rows are filled as -1
| Pixel properties | Quadrant properties | ||||||
|---|---|---|---|---|---|---|---|
| Quadrant | DetID | PixID | Counts | Sigma | Mean | Median | Sigma |
| A | 0 | 29 | 1167 | 11.35 | 305 | 287 | 77.5 |
| A | 7 | 110 | 961 | 8.69 | 305 | 287 | 77.5 |
| A | 0 | 30 | 913 | 8.07 | 305 | 287 | 77.5 |
| B | 2 | 9 | 922 | 10.88 | 295 | 283 | 58.7 |
| B | 2 | 8 | 777 | 8.41 | 295 | 283 | 58.7 |
| B | 14 | 254 | 732 | 7.65 | 295 | 283 | 58.7 |
| C | 12 | 241 | 792 | 6.64 | 298 | 281 | 77.0 |
| C | 12 | 250 | 791 | 6.62 | 298 | 281 | 77.0 |
| C | 12 | 249 | 773 | 6.39 | 298 | 281 | 77.0 |
| D | 3 | 14 | 779 | 6.68 | 283 | 257 | 78.0 |
| D | 6 | 38 | 755 | 6.38 | 283 | 257 | 78.0 |
| D | 10 | 189 | 711 | 5.81 | 283 | 257 | 78.0 |
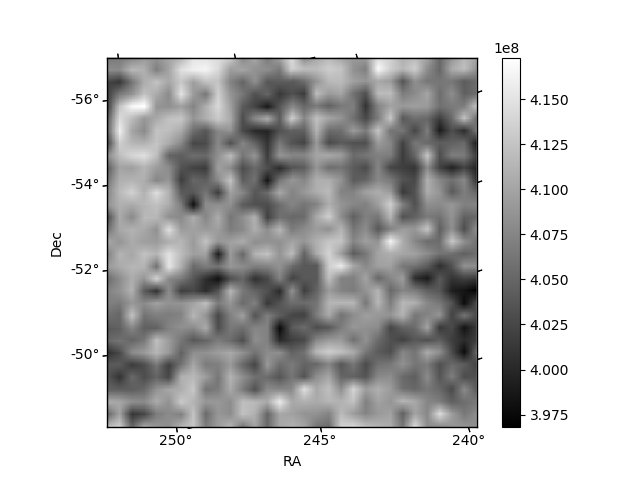
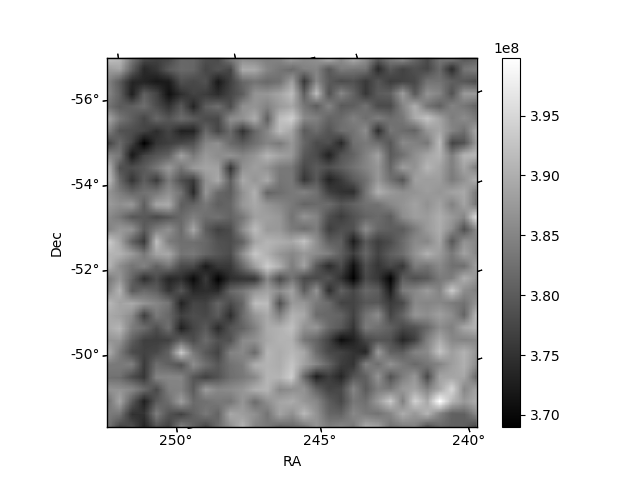
Histogram calculated using DETX and DETY for each event in the final _common_clean file
| Quadrant A | 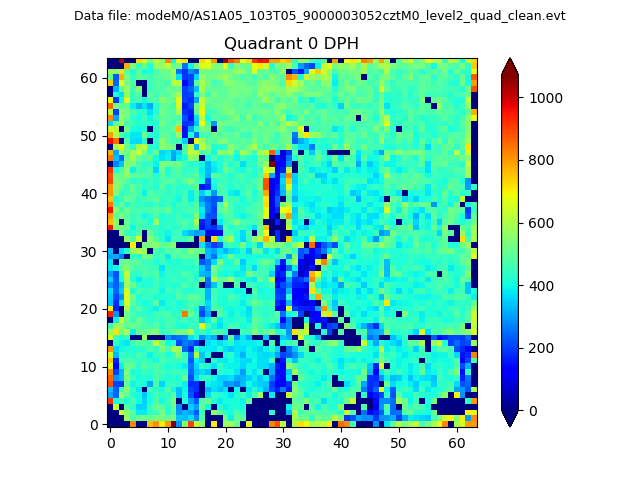 |
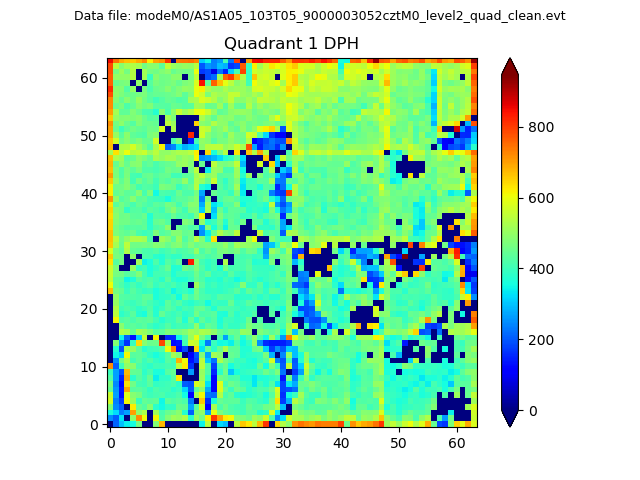 |
Quadrant B |
|---|---|---|---|
| Quadrant D |  |
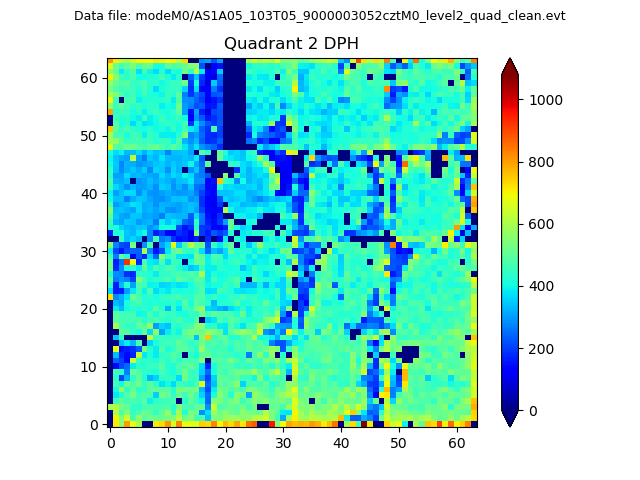 |
Quadrant C |
| Plot type | Count rate plots | Images |
|---|---|---|
| Comparison with Poisson distribution Blue bars denote a histogram of data divided into 1 sec bins. Red curve is a Poisson curve with rate = median count rate of data. |
 |
 |
| Quadrant-wise count rates Data is divided into 100 sec bins |
 |
|
| Module-wise count rates for Quadrant A Data is divided into 100 sec bins |
 |
 |
| Module-wise count rates for Quadrant B Data is divided into 100 sec bins |
 |
 |
| Module-wise count rates for Quadrant C Data is divided into 100 sec bins |
 |
 |
| Module-wise count rates for Quadrant D Data is divided into 100 sec bins |
 |
 |
| Parameter | Plot |
|---|---|
| CZT HV Monitor |  |
| D_VDD |  |
| Temperature 1 |  |
| Veto HV Monitor |  |
| Veto LLD |  |
| Alpha Counter |  |
| _CPM_Rate |  |
| CZT Counter |  |
| +2.5 Volts monitor |  |
| +5 Volts monitor |  |
| _ROLL_ROT |  |
| _Roll_DEC |  |
| _Roll_RA |  |
| Veto Counter | 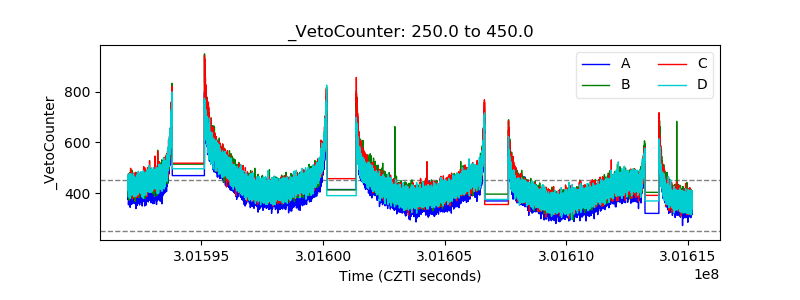 |