| Param | Original file | Final file |
|---|---|---|
| Filename | modeM0/AS1A05_103T05_9000003052_20641cztM0_level2.evt | modeM0/AS1A05_103T05_9000003052_20641cztM0_level2_quad_clean.evt |
| Size (bytes) | 251,651,520 | 44,038,080 |
| Size | 240.0 MB | 42.0 MB |
| Events in quadrant A | 1,805,812 | 283,669 |
| Events in quadrant B | 1,870,962 | 283,296 |
| Events in quadrant C | 1,673,169 | 271,942 |
| Events in quadrant D | 2,050,218 | 264,561 |
| Mode M0 | |||
|---|---|---|---|
| Quadrant | BADHDUFLAG | Total packets | Discarded packets |
| A | 0 | 7506 | 2 |
| B | 0 | 7636 | 1 |
| C | 0 | 6923 | 1 |
| D | 0 | 8247 | 1 |
| Mode M9 | |||
|---|---|---|---|
| Quadrant | BADHDUFLAG | Total packets | Discarded packets |
| A | 0 | 13 | 0 |
| B | 0 | 13 | 0 |
| C | 0 | 13 | 0 |
| D | 0 | 13 | 0 |
| Mode SS | |||
|---|---|---|---|
| Quadrant | BADHDUFLAG | Total packets | Discarded packets |
| A | 0 | 68 | 0 |
| B | 0 | 68 | 0 |
| C | 0 | 68 | 0 |
| D | 0 | 68 | 0 |
| Quadrant | Total seconds | Saturated seconds | Saturation percentage |
|---|---|---|---|
| A | 3227 | 80 | 2.479083% |
| B | 3227 | 96 | 2.974899% |
| C | 3227 | 77 | 2.386117% |
| D | 3227 | 84 | 2.603037% |
Noise dominated data is calculated using 1-second bins in cleaned event files. If a bin has >2000 counts, and if more than 50% of those come from <1% of pixels, then it is considered to be noise-dominated and hence unusable.
| Quadrant | # 1 sec bins | Bins with >0 counts | Bins with >2000 counts | High rate bins dominated by noise | Noise dominated (total time) | Noise dominated (detector-on time) | Marked lightcurve |
|---|---|---|---|---|---|---|---|
| A | 4552 | 3228 | 3 | 3 | 0.07% | 0.09% | 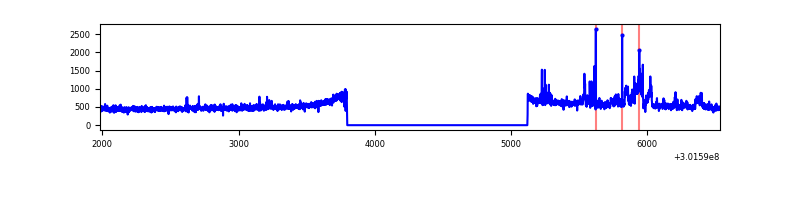 |
| B | 4552 | 3228 | 19 | 19 | 0.42% | 0.59% | 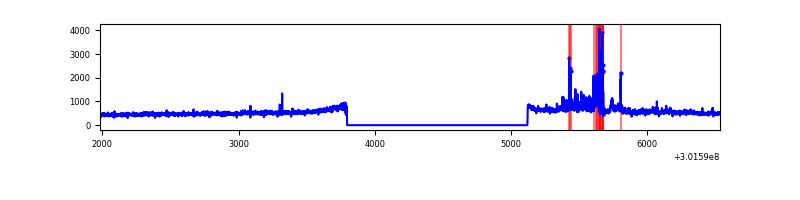 |
| C | 4552 | 3228 | 0 | 0 | 0.00% | 0.00% | 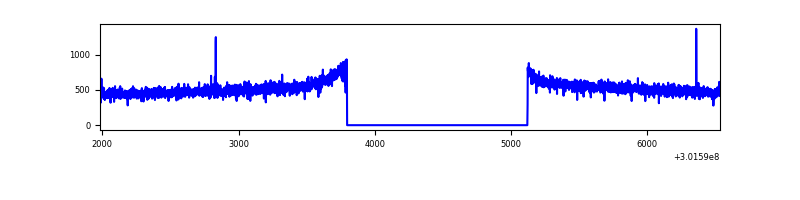 |
| D | 4552 | 3228 | 31 | 31 | 0.68% | 0.96% | 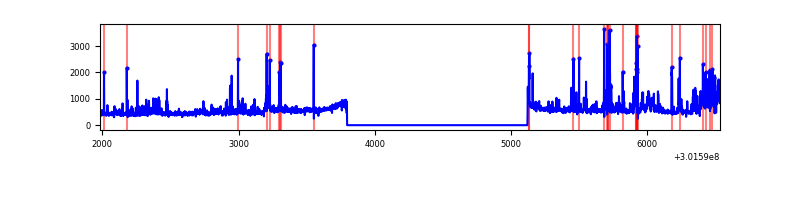 |
Top three noisy pixels from each quadrant. If the there are fewer than three noisy pixels in the level2.evt file, extra rows are filled as -1
| Pixel properties | Quadrant properties | ||||||
|---|---|---|---|---|---|---|---|
| Quadrant | DetID | PixID | Counts | Sigma | Mean | Median | Sigma |
| A | 12 | 16 | 81028 | 917.94 | 432 | 423 | 87.8 |
| A | 5 | 16 | 43951 | 495.7 | 432 | 423 | 87.8 |
| A | 12 | 194 | 16460 | 182.63 | 432 | 423 | 87.8 |
| B | 7 | 220 | 114615 | 1410.28 | 427 | 416 | 81.0 |
| B | 0 | 219 | 25780 | 313.23 | 427 | 416 | 81.0 |
| B | 0 | 197 | 18837 | 227.49 | 427 | 416 | 81.0 |
| C | 14 | 238 | 64487 | 675.64 | 409 | 410 | 94.8 |
| C | 3 | 233 | 5023 | 48.64 | 409 | 410 | 94.8 |
| C | 7 | 247 | 4621 | 44.4 | 409 | 410 | 94.8 |
| D | 1 | 52 | 299642 | 2951.48 | 415 | 403 | 101.4 |
| D | 7 | 238 | 70261 | 689.03 | 415 | 403 | 101.4 |
| D | 13 | 153 | 43325 | 423.35 | 415 | 403 | 101.4 |
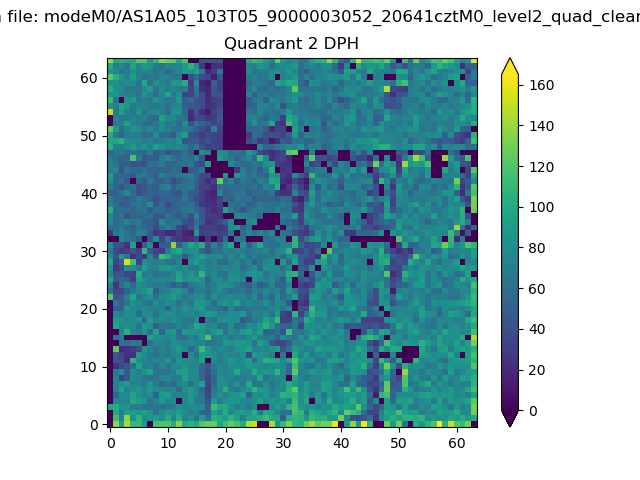
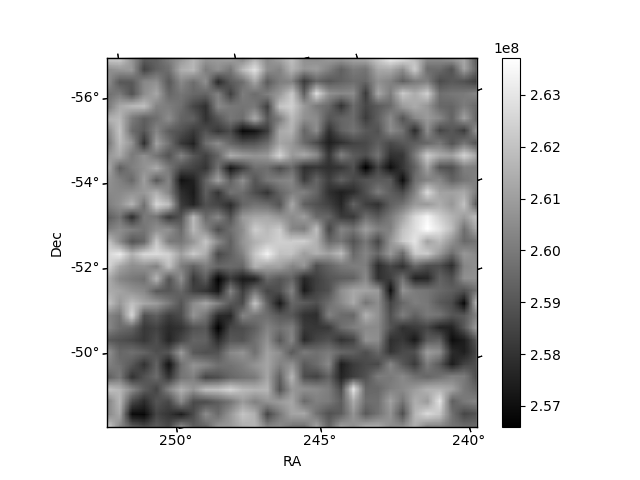
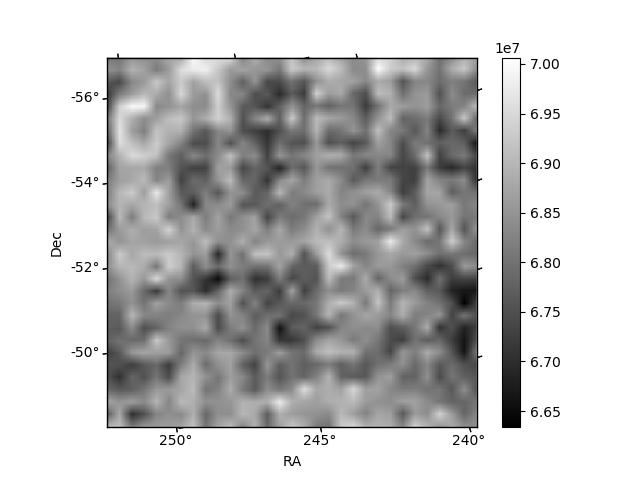
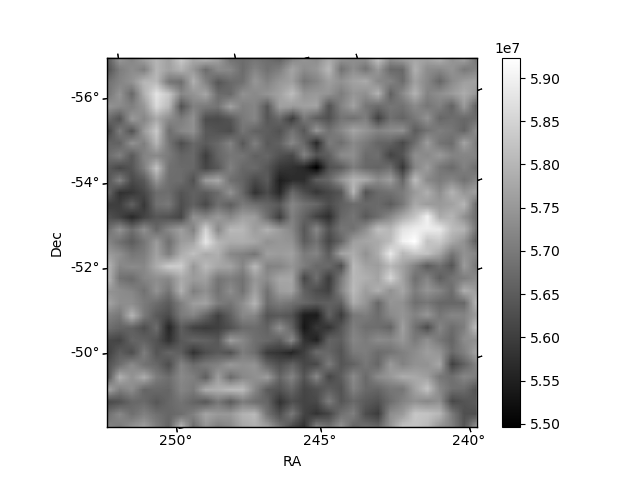
Histogram calculated using DETX and DETY for each event in the final _common_clean file
| Quadrant A | 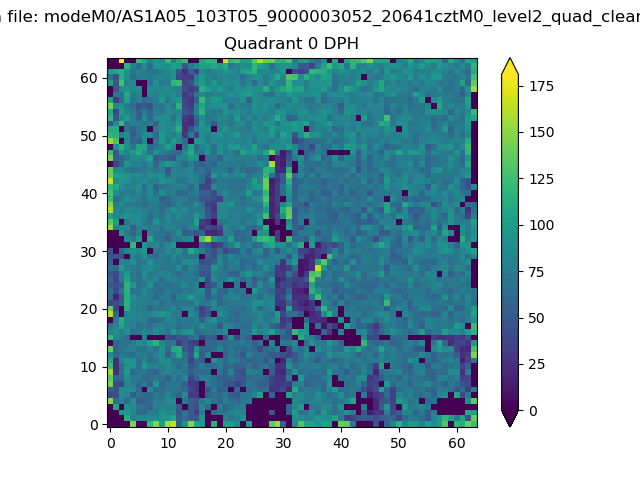 |
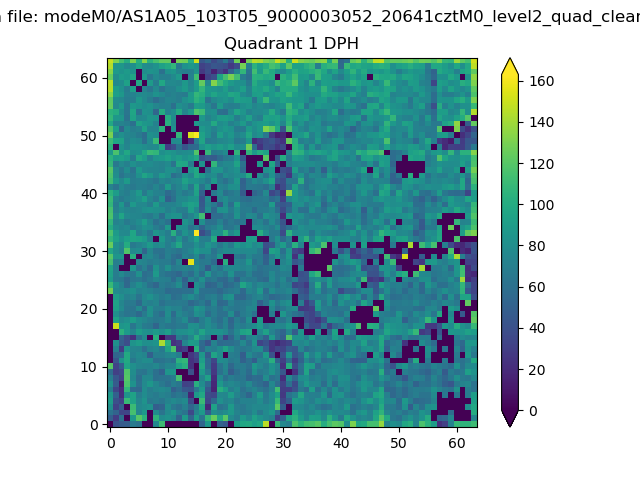 |
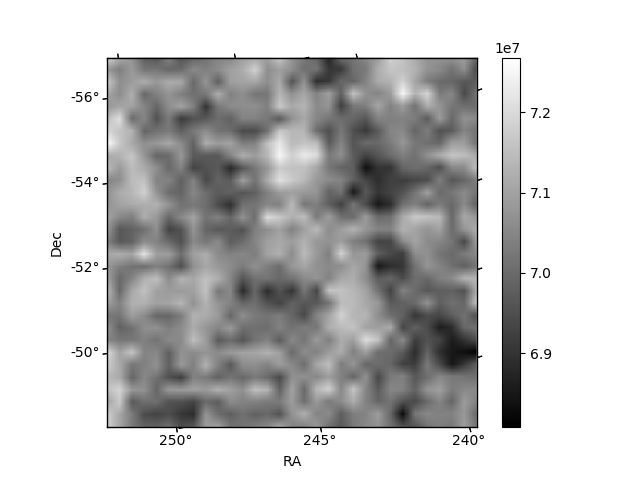
Quadrant B |
|---|---|---|---|
| Quadrant D | 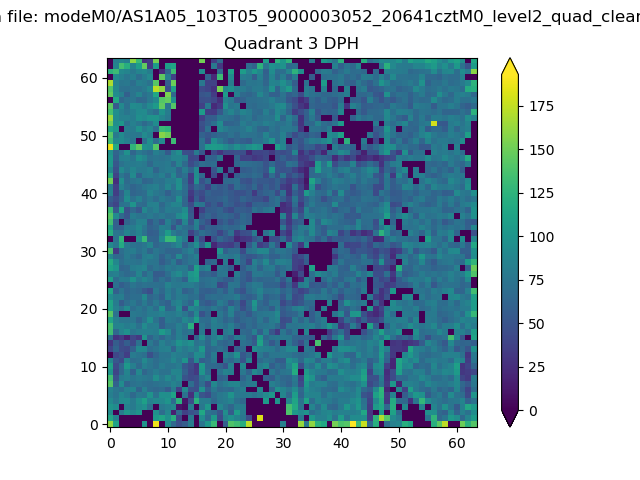 |
 |
Quadrant C |
| Plot type | Count rate plots | Images |
|---|---|---|
| Comparison with Poisson distribution Blue bars denote a histogram of data divided into 1 sec bins. Red curve is a Poisson curve with rate = median count rate of data. |
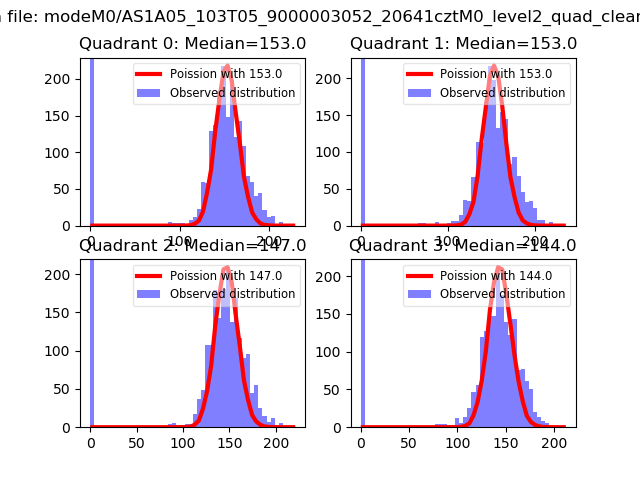 |
 |
| Quadrant-wise count rates Data is divided into 100 sec bins |
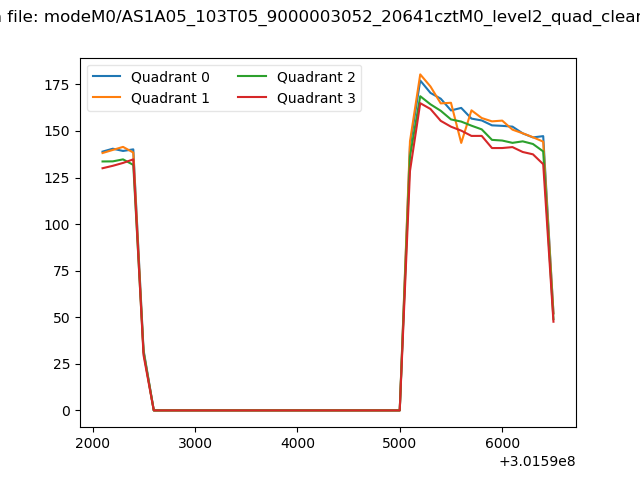 |
|
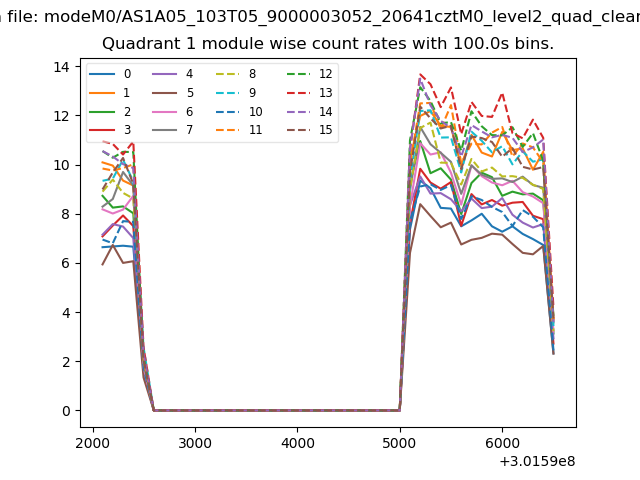
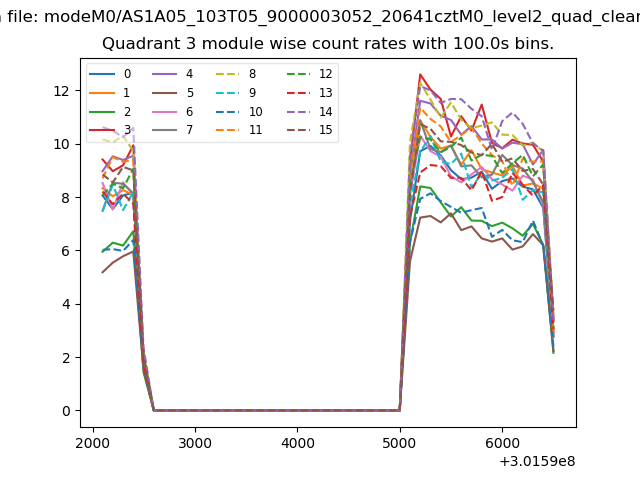
| Module-wise count rates for Quadrant A Data is divided into 100 sec bins |
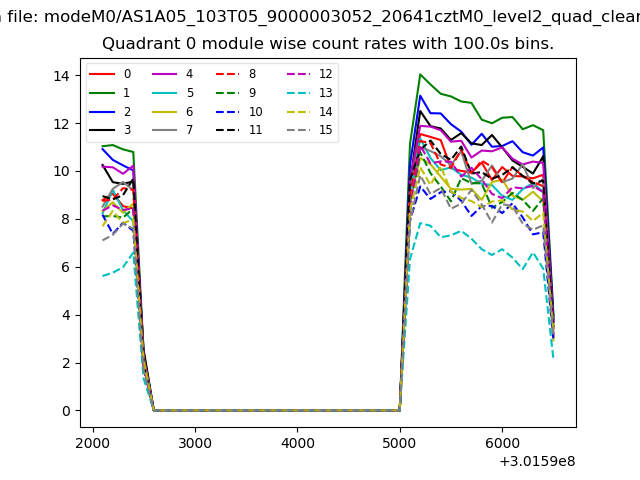 |
 |
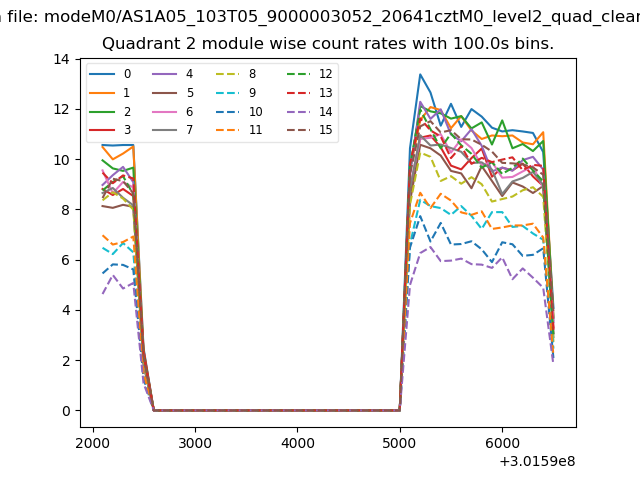
| Module-wise count rates for Quadrant B Data is divided into 100 sec bins |
 |
 |
| Module-wise count rates for Quadrant C Data is divided into 100 sec bins |
 |
 |
| Module-wise count rates for Quadrant D Data is divided into 100 sec bins |
 |
 |
| Parameter | Plot |
|---|---|
| CZT HV Monitor | 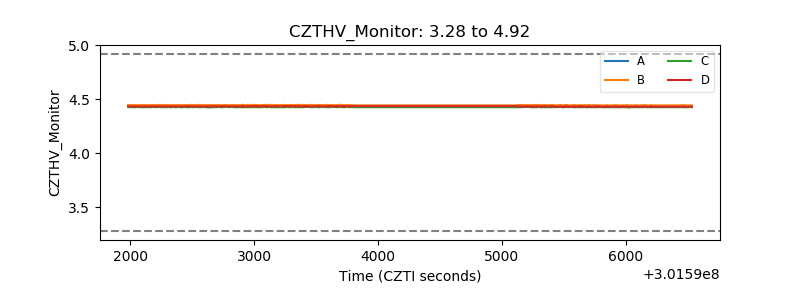 |
| D_VDD | 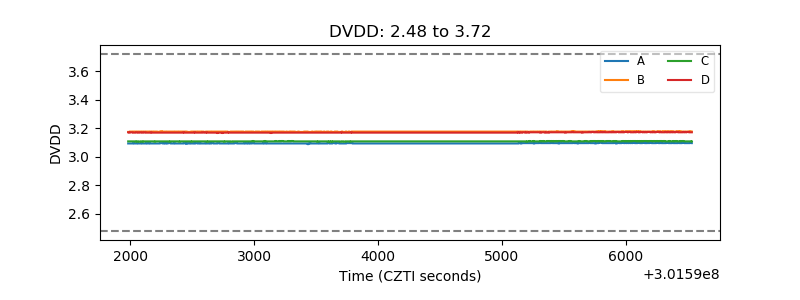 |
| Temperature 1 | 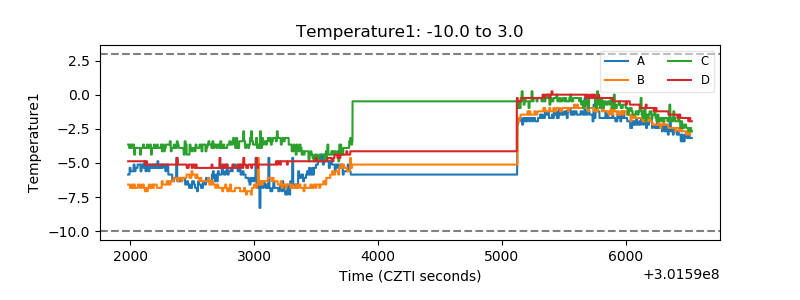 |
| Veto HV Monitor |  |
| Veto LLD | 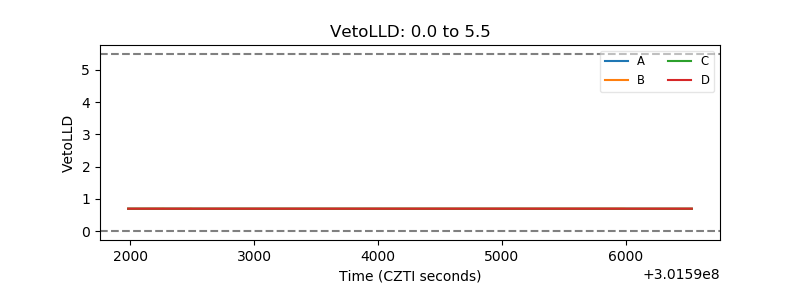 |
| Alpha Counter | 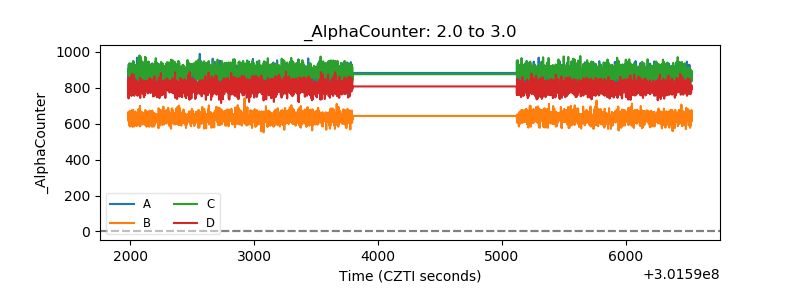 |
| _CPM_Rate | 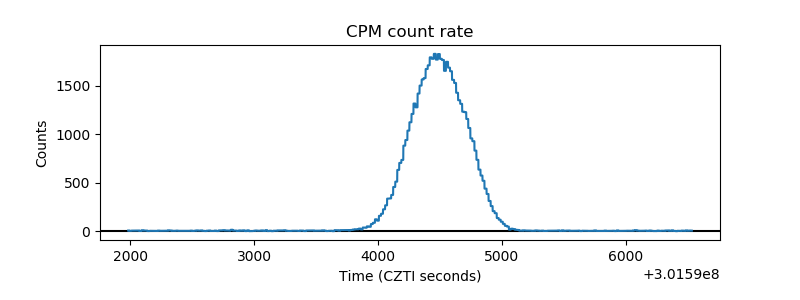 |
| CZT Counter | 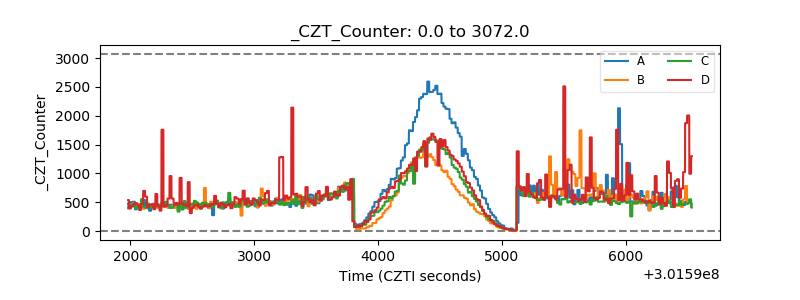 |
| +2.5 Volts monitor |  |
| +5 Volts monitor |  |
| _ROLL_ROT | 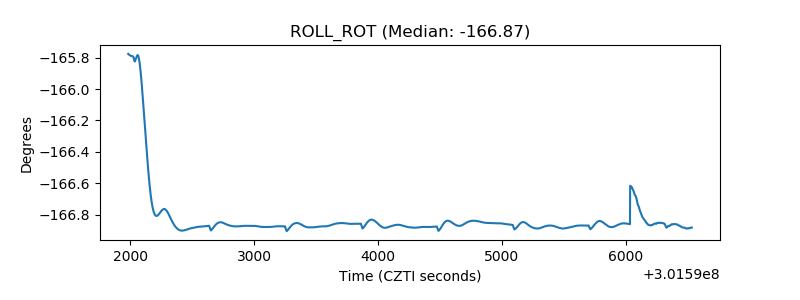 |
| _Roll_DEC | 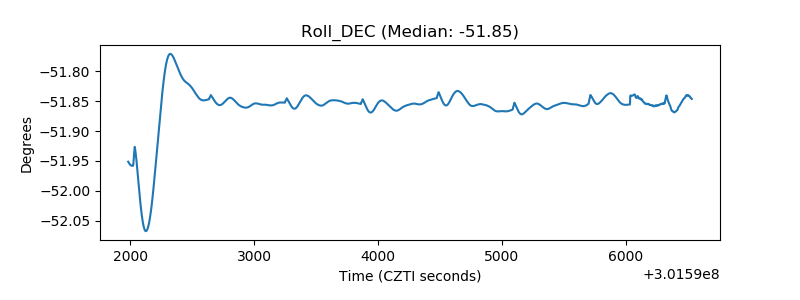 |
| _Roll_RA | 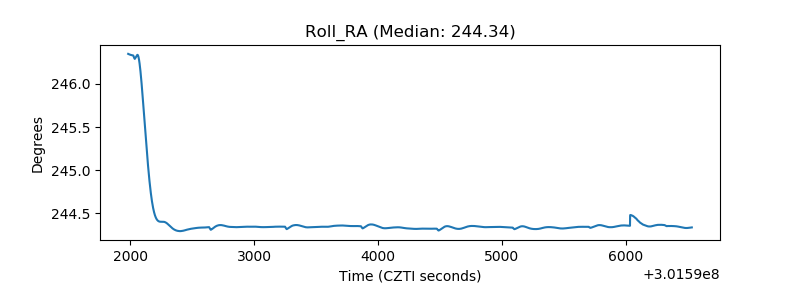 |
| Veto Counter | 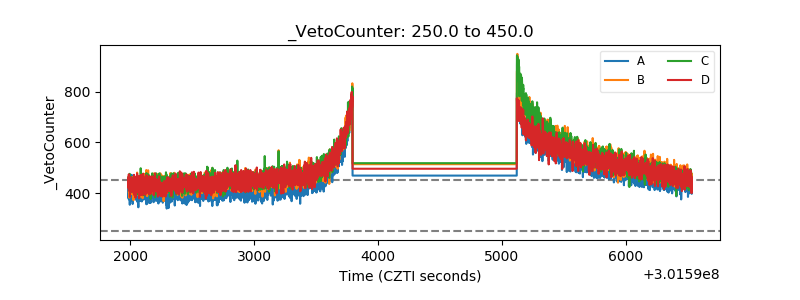 |