| Param | Original file | Final file |
|---|---|---|
| Filename | modeM0/AS1A05_103T05_9000003052_20642cztM0_level2.evt | modeM0/AS1A05_103T05_9000003052_20642cztM0_level2_quad_clean.evt |
| Size (bytes) | 478,831,680 | 100,405,440 |
| Size | 456.6 MB | 95.8 MB |
| Events in quadrant A | 3,332,459 | 670,924 |
| Events in quadrant B | 3,412,666 | 668,546 |
| Events in quadrant C | 3,066,252 | 641,002 |
| Events in quadrant D | 4,263,518 | 621,647 |
| Mode M0 | |||
|---|---|---|---|
| Quadrant | BADHDUFLAG | Total packets | Discarded packets |
| A | 0 | 14032 | 1 |
| B | 0 | 14177 | 1 |
| C | 0 | 13100 | 1 |
| D | 0 | 16799 | 1 |
| Mode M9 | |||
|---|---|---|---|
| Quadrant | BADHDUFLAG | Total packets | Discarded packets |
| A | 0 | 12 | 0 |
| B | 0 | 12 | 0 |
| C | 0 | 12 | 0 |
| D | 0 | 12 | 0 |
| Mode SS | |||
|---|---|---|---|
| Quadrant | BADHDUFLAG | Total packets | Discarded packets |
| A | 0 | 128 | 0 |
| B | 0 | 128 | 0 |
| C | 0 | 128 | 0 |
| D | 0 | 128 | 0 |
| Quadrant | Total seconds | Saturated seconds | Saturation percentage |
|---|---|---|---|
| A | 6284 | 77 | 1.225334% |
| B | 6285 | 93 | 1.479714% |
| C | 6285 | 82 | 1.304694% |
| D | 6285 | 116 | 1.845664% |
Noise dominated data is calculated using 1-second bins in cleaned event files. If a bin has >2000 counts, and if more than 50% of those come from <1% of pixels, then it is considered to be noise-dominated and hence unusable.
| Quadrant | # 1 sec bins | Bins with >0 counts | Bins with >2000 counts | High rate bins dominated by noise | Noise dominated (total time) | Noise dominated (detector-on time) | Marked lightcurve |
|---|---|---|---|---|---|---|---|
| A | 7499 | 6285 | 6 | 6 | 0.08% | 0.10% | 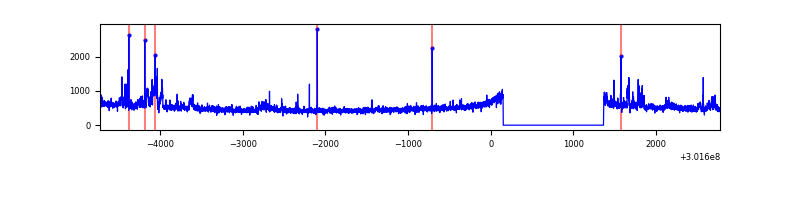 |
| B | 7500 | 6286 | 19 | 19 | 0.25% | 0.30% | 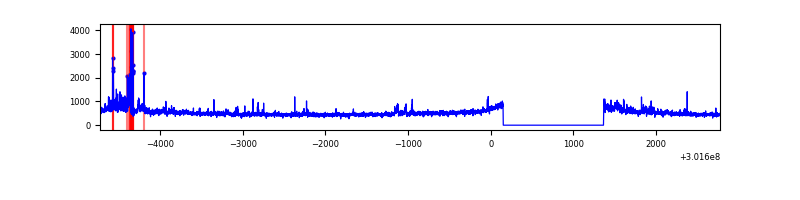 |
| C | 7500 | 6286 | 0 | 0 | 0.00% | 0.00% | 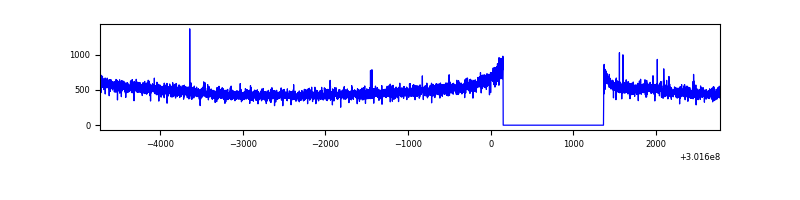 |
| D | 7500 | 6286 | 62 | 62 | 0.83% | 0.99% | 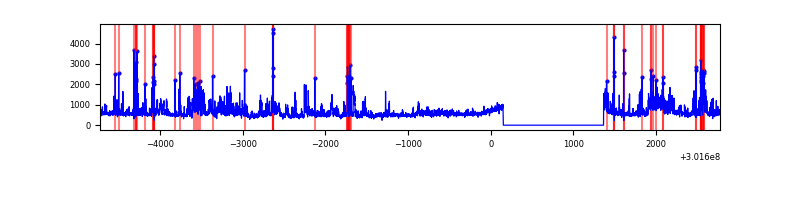 |
Top three noisy pixels from each quadrant. If the there are fewer than three noisy pixels in the level2.evt file, extra rows are filled as -1
| Pixel properties | Quadrant properties | ||||||
|---|---|---|---|---|---|---|---|
| Quadrant | DetID | PixID | Counts | Sigma | Mean | Median | Sigma |
| A | 12 | 16 | 171993 | 1082.13 | 796 | 782 | 158.2 |
| A | 5 | 16 | 45194 | 280.7 | 796 | 782 | 158.2 |
| A | 12 | 194 | 35174 | 217.37 | 796 | 782 | 158.2 |
| B | 7 | 220 | 120265 | 806.38 | 787 | 769 | 148.2 |
| B | 0 | 219 | 53896 | 358.51 | 787 | 769 | 148.2 |
| B | 0 | 189 | 49169 | 326.61 | 787 | 769 | 148.2 |
| C | 14 | 238 | 118782 | 683.75 | 746 | 749 | 172.6 |
| C | 7 | 247 | 26390 | 148.54 | 746 | 749 | 172.6 |
| C | 13 | 61 | 5382 | 26.84 | 746 | 749 | 172.6 |
| D | 1 | 52 | 877322 | 4788.64 | 757 | 735 | 183.1 |
| D | 2 | 165 | 197454 | 1074.64 | 757 | 735 | 183.1 |
| D | 7 | 238 | 187411 | 1019.78 | 757 | 735 | 183.1 |
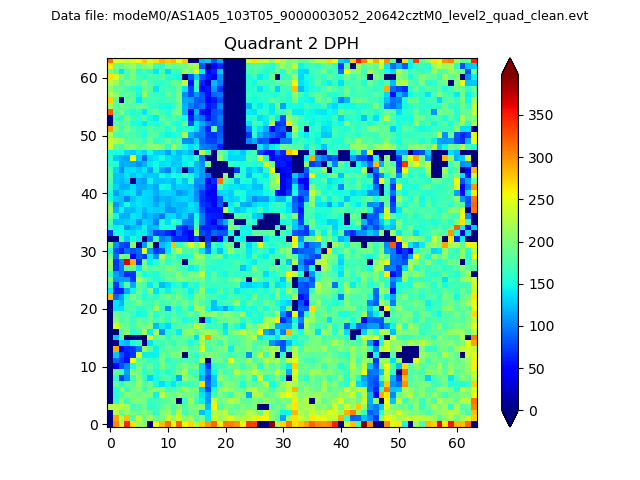
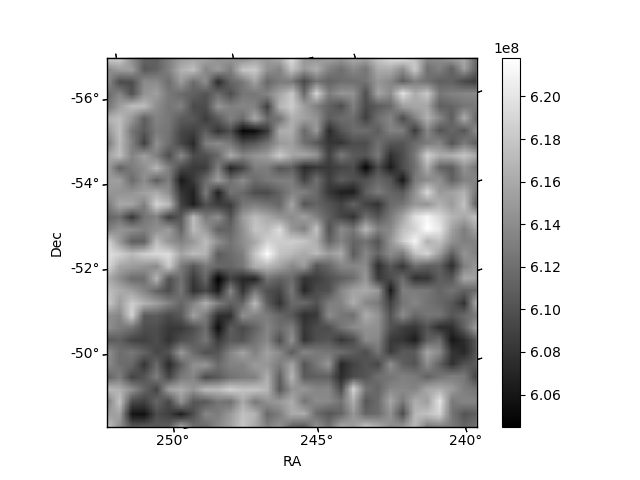
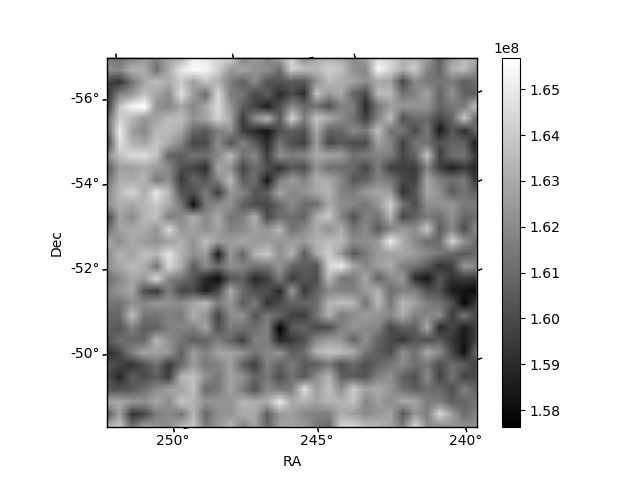
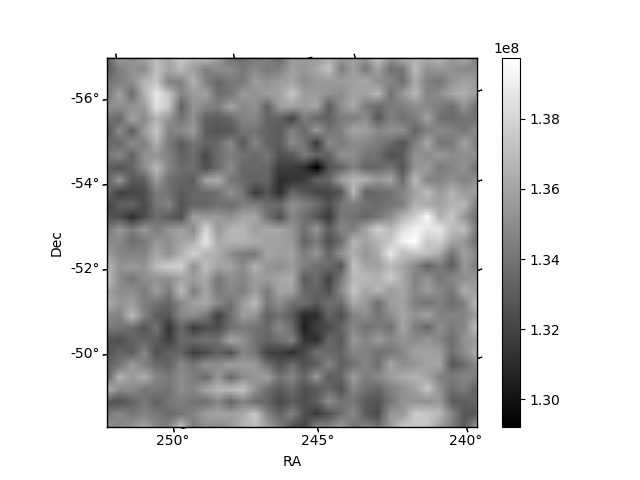
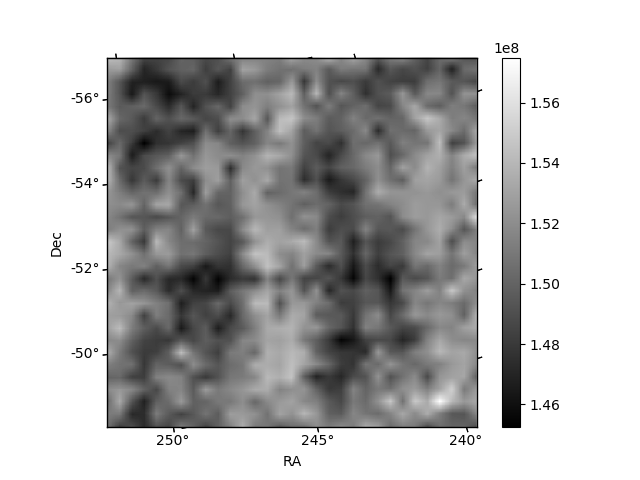
Histogram calculated using DETX and DETY for each event in the final _common_clean file
| Quadrant A | 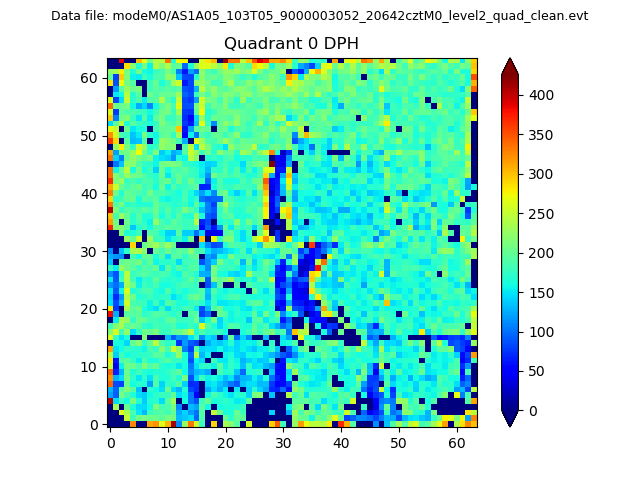 |
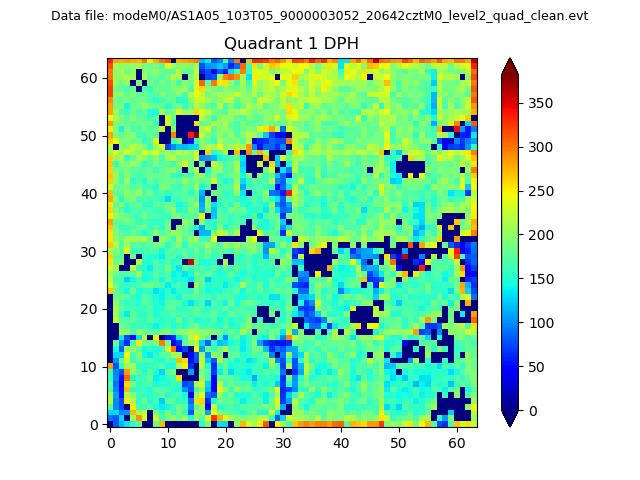 |
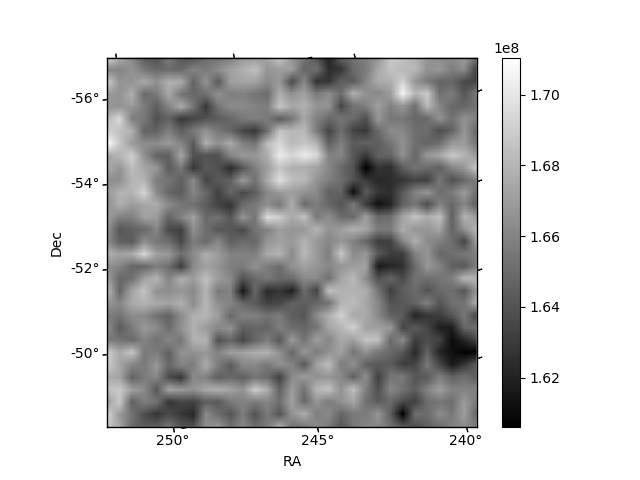
Quadrant B |
|---|---|---|---|
| Quadrant D | 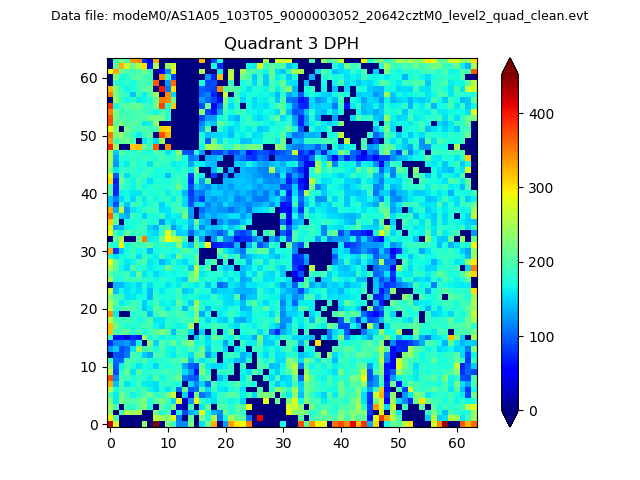 |
 |
Quadrant C |
| Plot type | Count rate plots | Images |
|---|---|---|
| Comparison with Poisson distribution Blue bars denote a histogram of data divided into 1 sec bins. Red curve is a Poisson curve with rate = median count rate of data. |
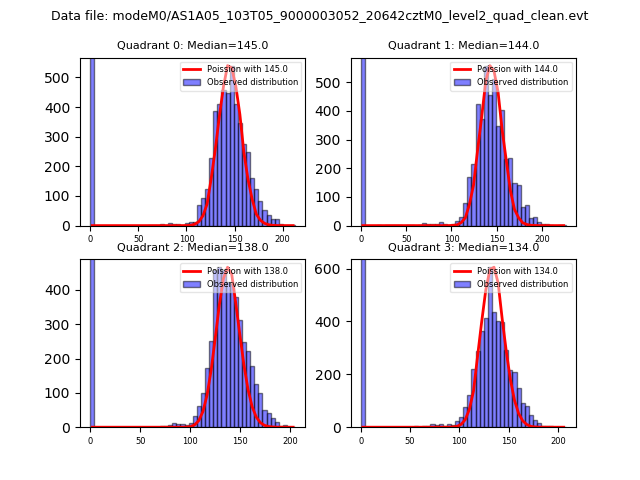 |
 |
| Quadrant-wise count rates Data is divided into 100 sec bins |
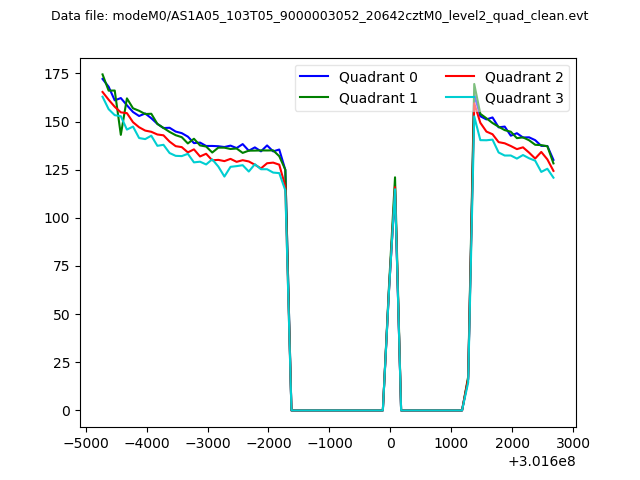 |
|
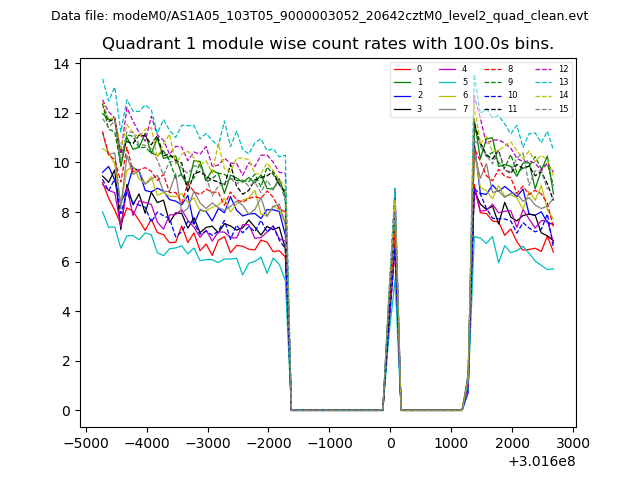
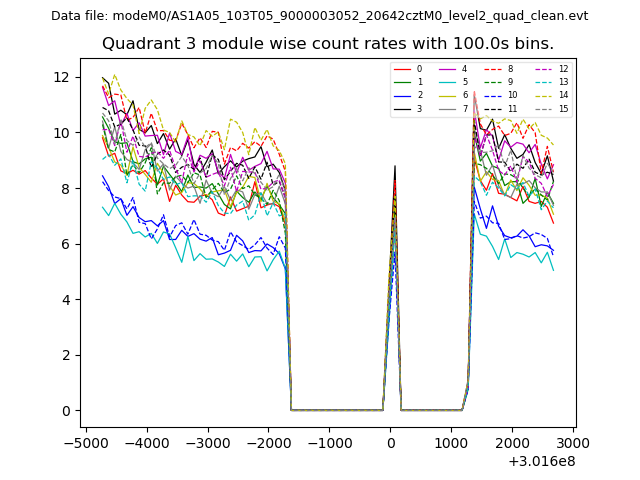
| Module-wise count rates for Quadrant A Data is divided into 100 sec bins |
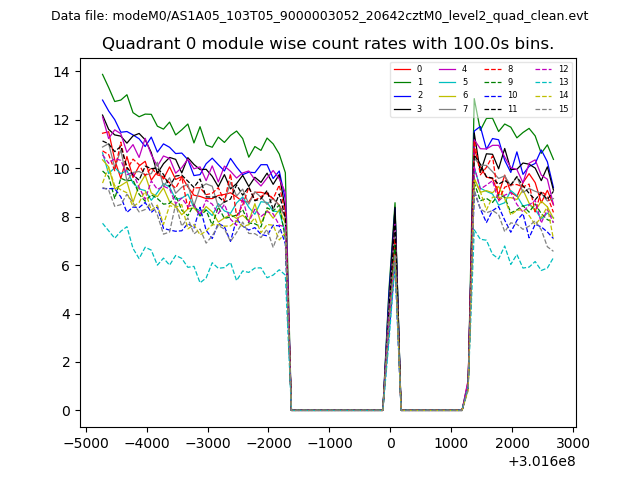 |
 |
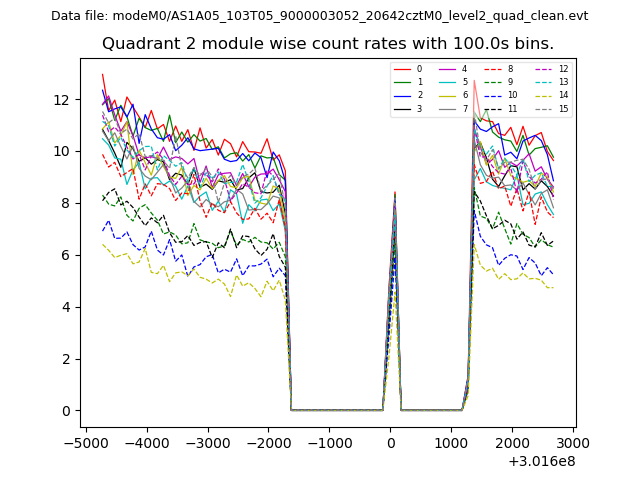
| Module-wise count rates for Quadrant B Data is divided into 100 sec bins |
 |
 |
| Module-wise count rates for Quadrant C Data is divided into 100 sec bins |
 |
 |
| Module-wise count rates for Quadrant D Data is divided into 100 sec bins |
 |
 |
| Parameter | Plot |
|---|---|
| CZT HV Monitor | 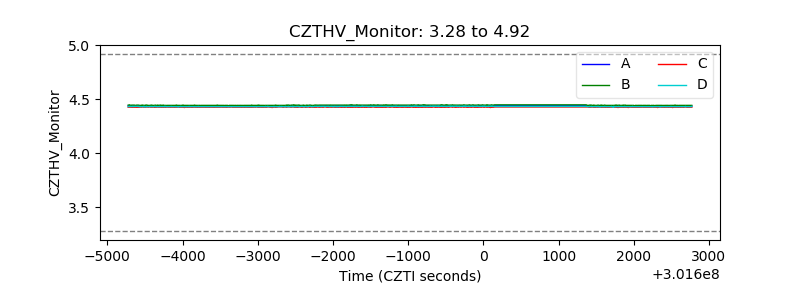 |
| D_VDD | 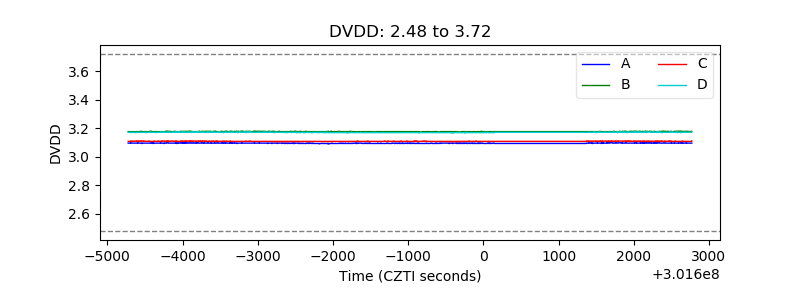 |
| Temperature 1 | 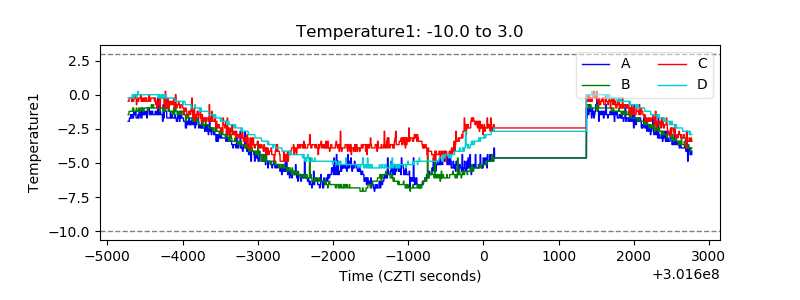 |
| Veto HV Monitor | 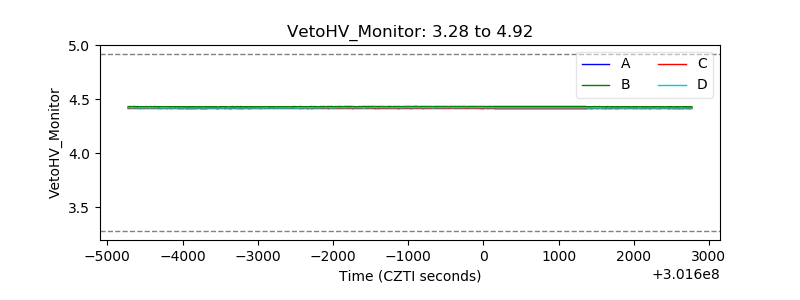 |
| Veto LLD | 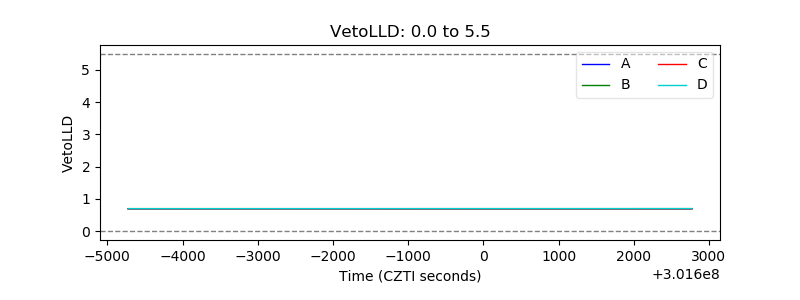 |
| Alpha Counter | 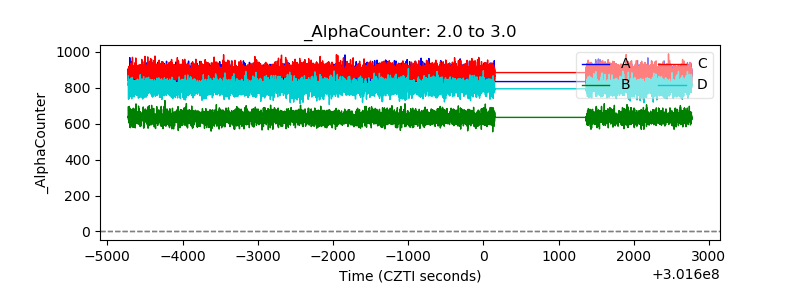 |
| _CPM_Rate | 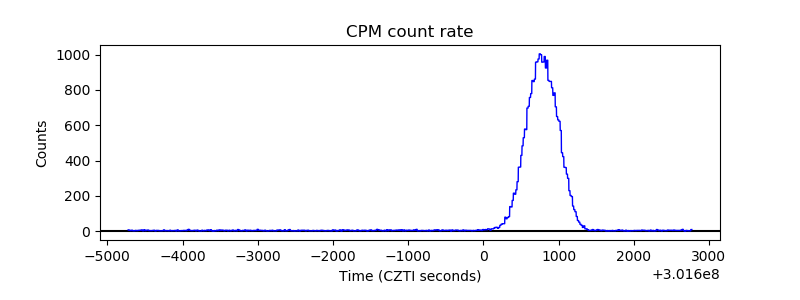 |
| CZT Counter | 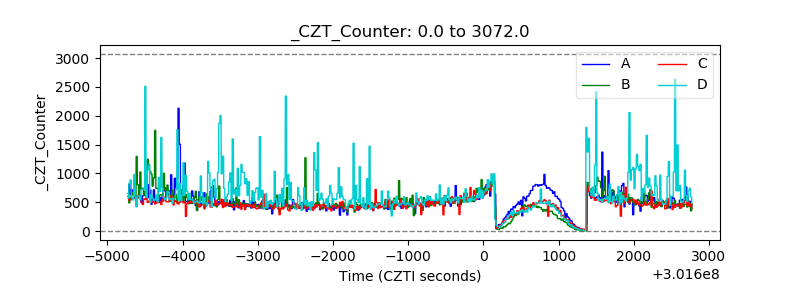 |
| +2.5 Volts monitor |  |
| +5 Volts monitor |  |
| _ROLL_ROT | 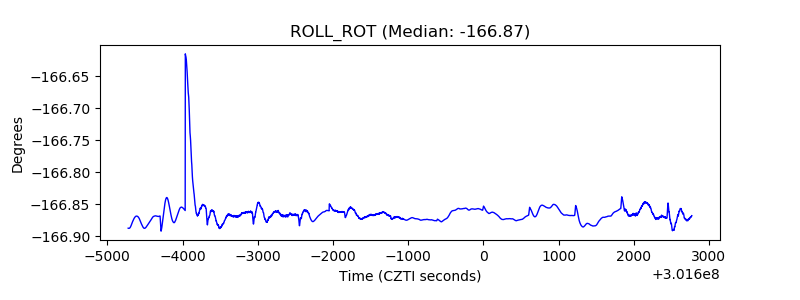 |
| _Roll_DEC | 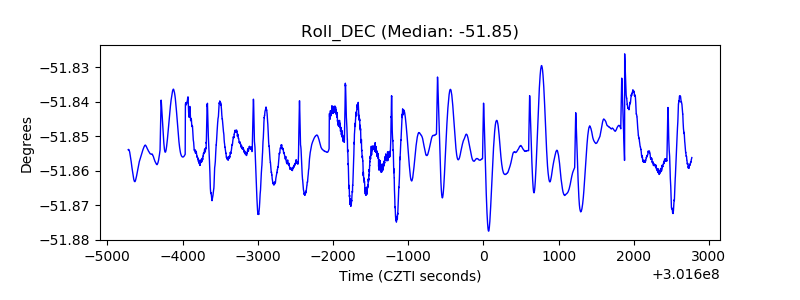 |
| _Roll_RA | 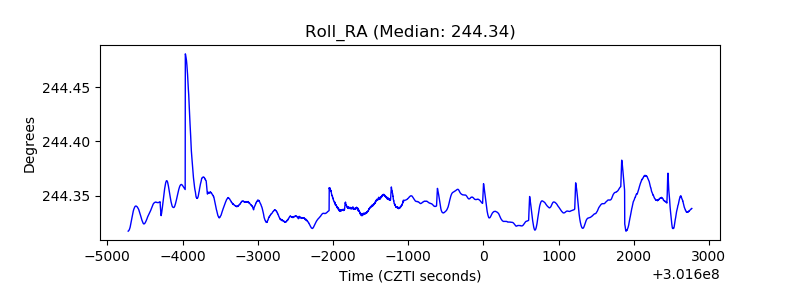 |
| Veto Counter | 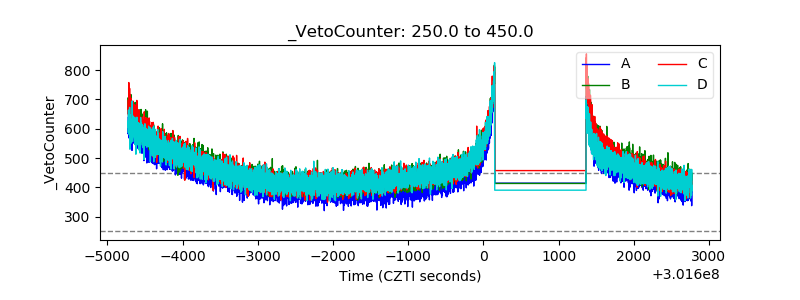 |