| Param | Original file | Final file |
|---|---|---|
| Filename | modeM0/AS1A05_103T05_9000003052_20643cztM0_level2.evt | modeM0/AS1A05_103T05_9000003052_20643cztM0_level2_quad_clean.evt |
| Size (bytes) | 760,331,520 | 154,180,800 |
| Size | 725.1 MB | 147.0 MB |
| Events in quadrant A | 5,192,026 | 1,012,023 |
| Events in quadrant B | 5,329,328 | 1,007,438 |
| Events in quadrant C | 5,053,961 | 968,151 |
| Events in quadrant D | 6,730,188 | 944,547 |
| Mode M0 | |||
|---|---|---|---|
| Quadrant | BADHDUFLAG | Total packets | Discarded packets |
| A | 0 | 22508 | 2 |
| B | 0 | 22674 | 2 |
| C | 0 | 22054 | 2 |
| D | 0 | 27030 | 2 |
| Mode M9 | |||
|---|---|---|---|
| Quadrant | BADHDUFLAG | Total packets | Discarded packets |
| A | 0 | 22 | 0 |
| B | 0 | 22 | 0 |
| C | 0 | 22 | 0 |
| D | 0 | 22 | 0 |
| Mode SS | |||
|---|---|---|---|
| Quadrant | BADHDUFLAG | Total packets | Discarded packets |
| A | 0 | 218 | 0 |
| B | 0 | 218 | 0 |
| C | 0 | 218 | 0 |
| D | 0 | 218 | 0 |
| Quadrant | Total seconds | Saturated seconds | Saturation percentage |
|---|---|---|---|
| A | 10646 | 98 | 0.920534% |
| B | 10646 | 118 | 1.108398% |
| C | 10647 | 125 | 1.174040% |
| D | 10647 | 151 | 1.418240% |
Noise dominated data is calculated using 1-second bins in cleaned event files. If a bin has >2000 counts, and if more than 50% of those come from <1% of pixels, then it is considered to be noise-dominated and hence unusable.
| Quadrant | # 1 sec bins | Bins with >0 counts | Bins with >2000 counts | High rate bins dominated by noise | Noise dominated (total time) | Noise dominated (detector-on time) | Marked lightcurve |
|---|---|---|---|---|---|---|---|
| A | 12841 | 10648 | 4 | 4 | 0.03% | 0.04% | 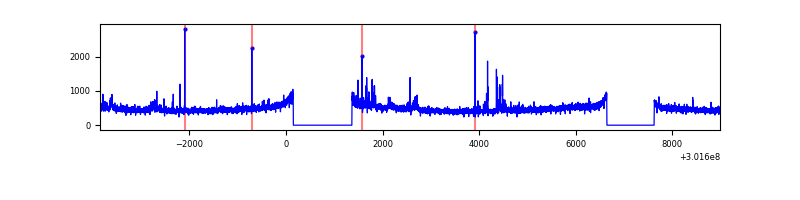 |
| B | 12841 | 10648 | 9 | 9 | 0.07% | 0.08% | 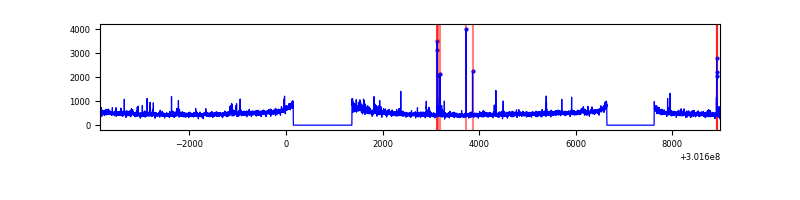 |
| C | 12842 | 10649 | 0 | 0 | 0.00% | 0.00% |  |
| D | 12842 | 10649 | 76 | 76 | 0.59% | 0.71% | 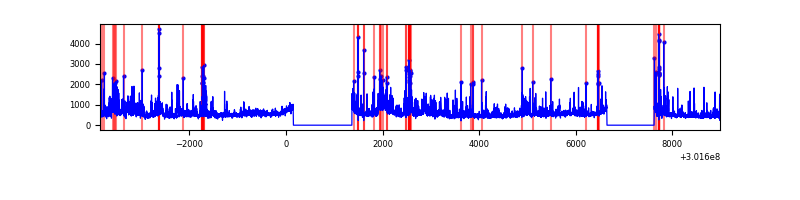 |
Top three noisy pixels from each quadrant. If the there are fewer than three noisy pixels in the level2.evt file, extra rows are filled as -1
| Pixel properties | Quadrant properties | ||||||
|---|---|---|---|---|---|---|---|
| Quadrant | DetID | PixID | Counts | Sigma | Mean | Median | Sigma |
| A | 12 | 16 | 104241 | 399.94 | 1296 | 1270 | 257.5 |
| A | 5 | 16 | 62676 | 238.5 | 1296 | 1270 | 257.5 |
| A | 12 | 194 | 27582 | 102.19 | 1296 | 1270 | 257.5 |
| B | 0 | 219 | 70718 | 287.46 | 1292 | 1260 | 241.6 |
| B | 0 | 189 | 44137 | 177.45 | 1292 | 1260 | 241.6 |
| B | 7 | 220 | 43828 | 176.17 | 1292 | 1260 | 241.6 |
| C | 14 | 238 | 194261 | 678.73 | 1228 | 1236 | 284.4 |
| C | 7 | 247 | 50399 | 172.87 | 1228 | 1236 | 284.4 |
| C | 3 | 233 | 12081 | 38.13 | 1228 | 1236 | 284.4 |
| D | 1 | 52 | 1372083 | 4568.43 | 1240 | 1203 | 300.1 |
| D | 7 | 238 | 245334 | 813.56 | 1240 | 1203 | 300.1 |
| D | 2 | 165 | 244818 | 811.84 | 1240 | 1203 | 300.1 |
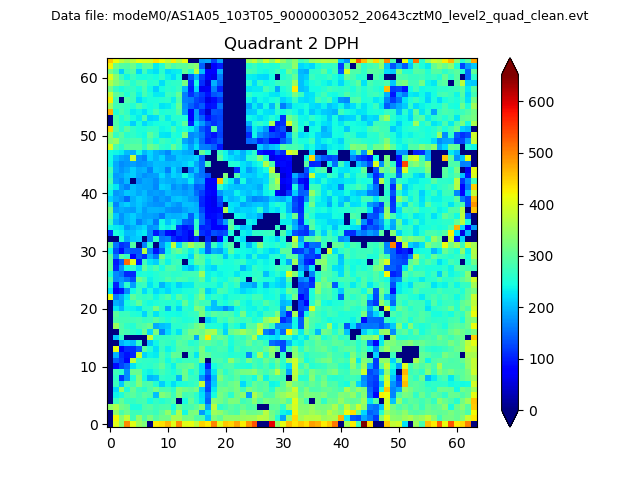
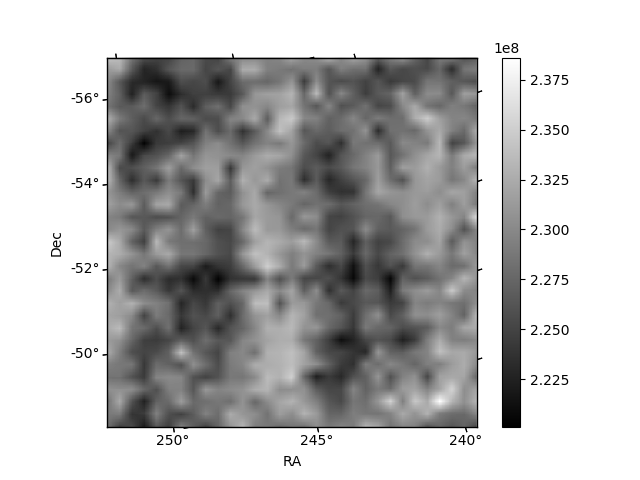
Histogram calculated using DETX and DETY for each event in the final _common_clean file
| Quadrant A | 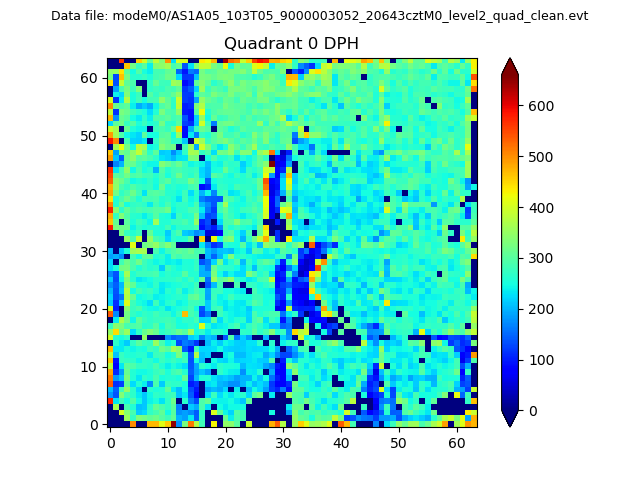 |
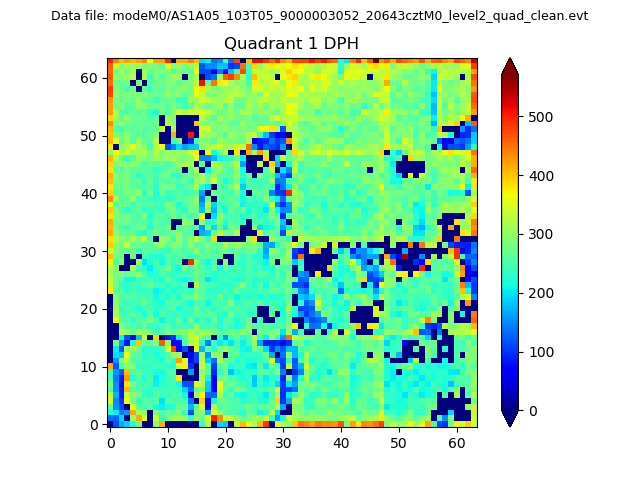 |
Quadrant B |
|---|---|---|---|
| Quadrant D | 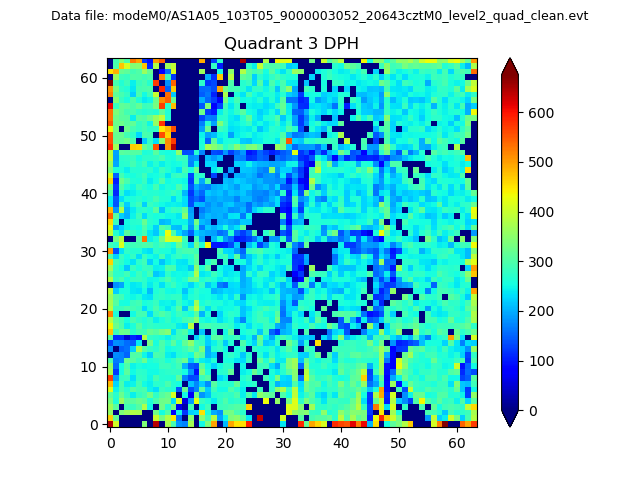 |
 |
Quadrant C |
| Plot type | Count rate plots | Images |
|---|---|---|
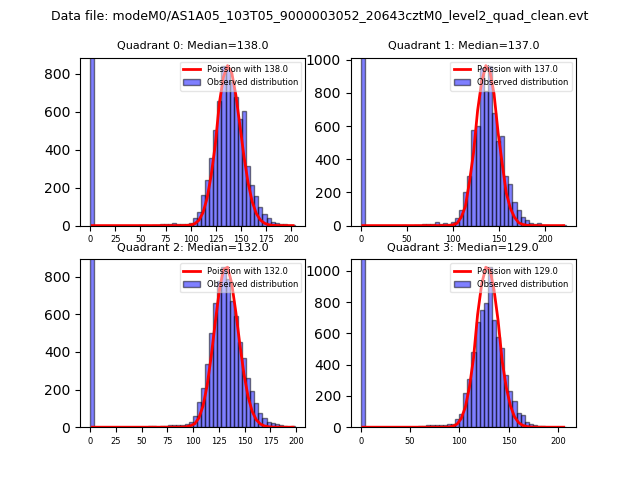
| Comparison with Poisson distribution Blue bars denote a histogram of data divided into 1 sec bins. Red curve is a Poisson curve with rate = median count rate of data. |
 |
 |
| Quadrant-wise count rates Data is divided into 100 sec bins |
 |
|
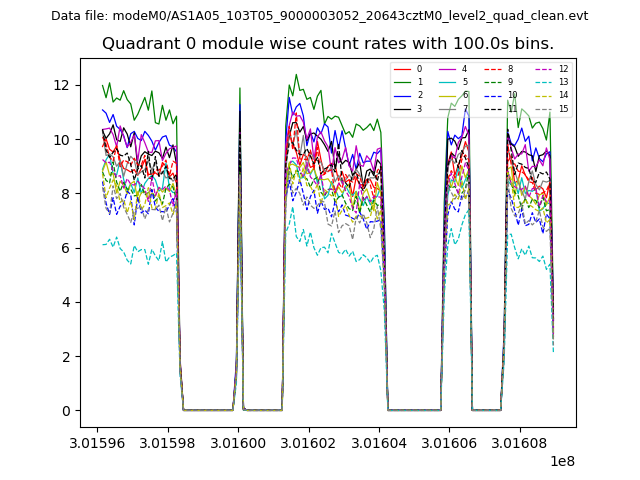
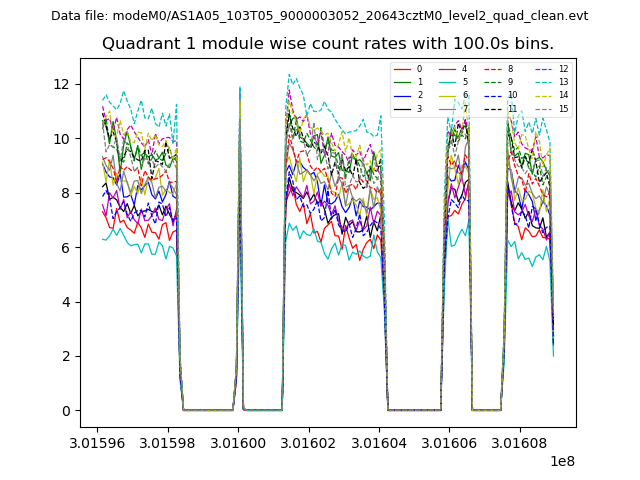
| Module-wise count rates for Quadrant A Data is divided into 100 sec bins |
 |
 |
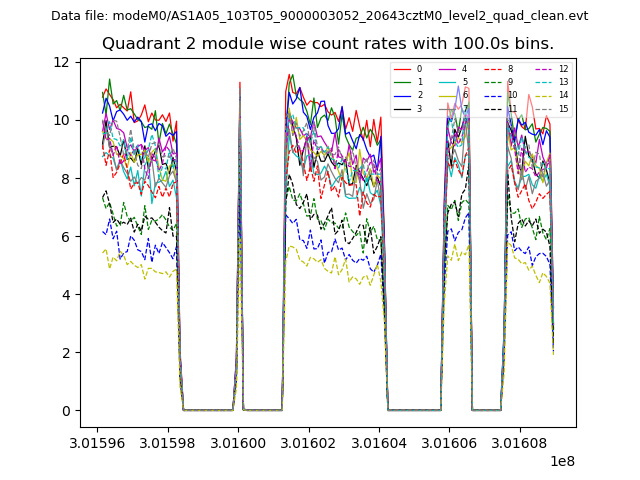
| Module-wise count rates for Quadrant B Data is divided into 100 sec bins |
 |
 |
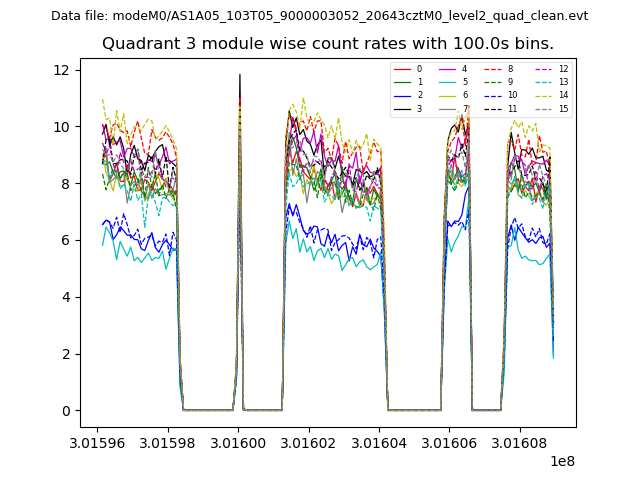
| Module-wise count rates for Quadrant C Data is divided into 100 sec bins |
 |
 |
| Module-wise count rates for Quadrant D Data is divided into 100 sec bins |
 |
 |
| Parameter | Plot |
|---|---|
| CZT HV Monitor | 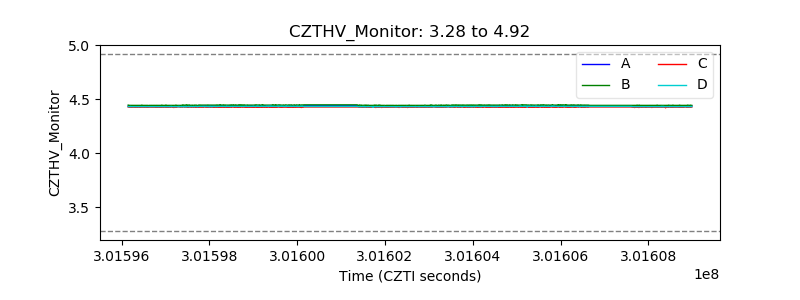 |
| D_VDD | 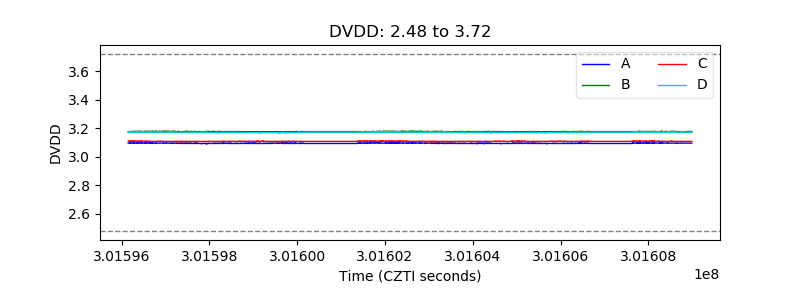 |
| Temperature 1 | 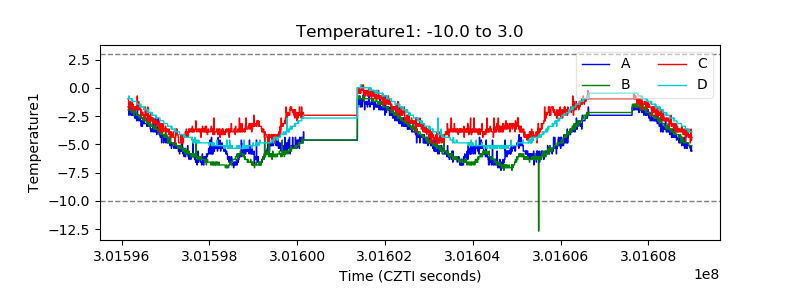 |
| Veto HV Monitor |  |
| Veto LLD | 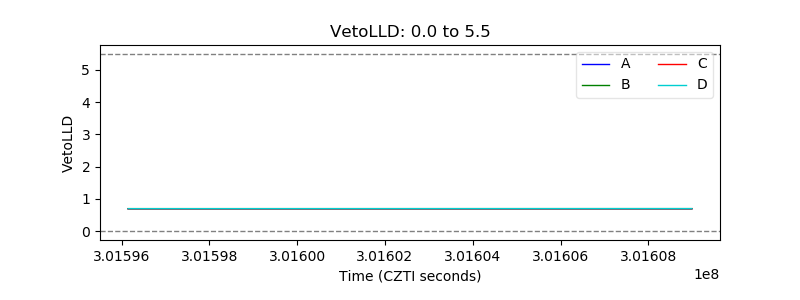 |
| Alpha Counter | 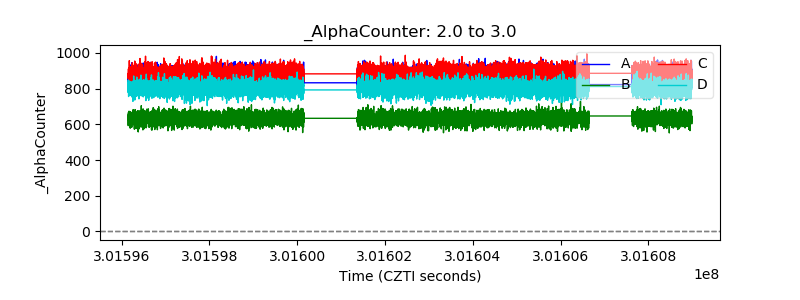 |
| _CPM_Rate | 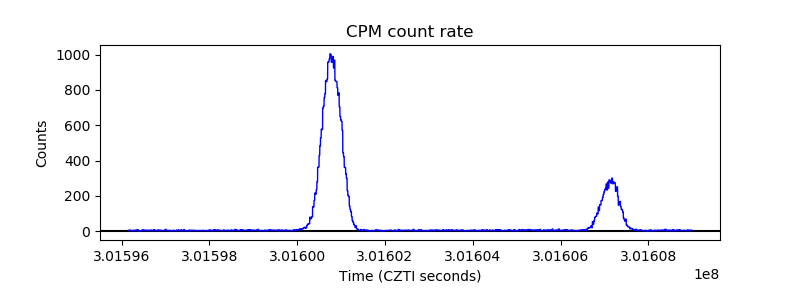 |
| CZT Counter | 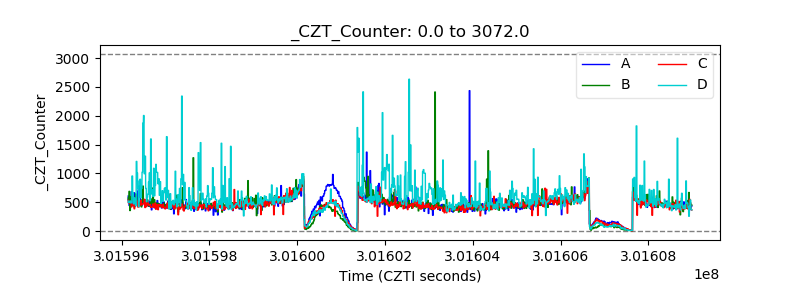 |
| +2.5 Volts monitor |  |
| +5 Volts monitor |  |
| _ROLL_ROT | 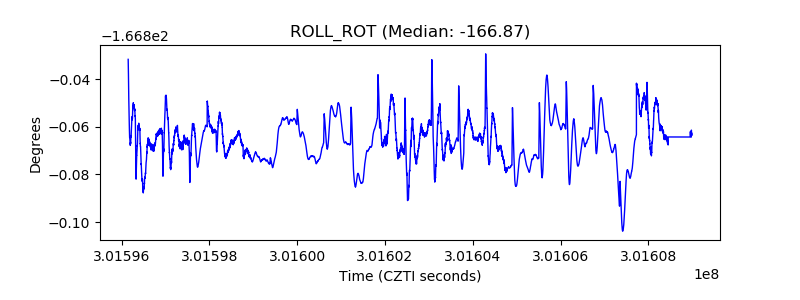 |
| _Roll_DEC |  |
| _Roll_RA | 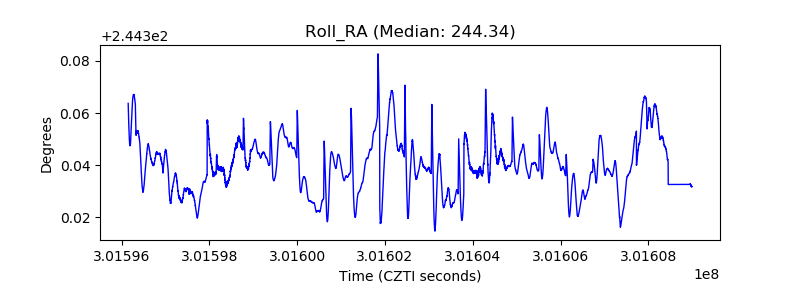 |
| Veto Counter | 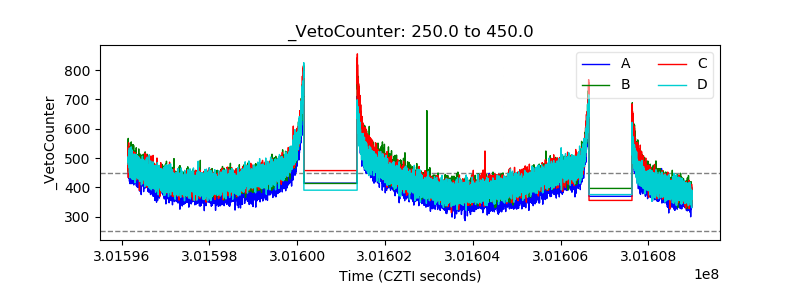 |