| Param | Original file | Final file |
|---|---|---|
| Filename | modeM0/AS1A05_022T09_9000003058cztM0_level2.fits | modeM0/AS1A05_022T09_9000003058cztM0_level2_quad_clean.evt |
| Size (bytes) | 236,560,320 | 311,538,240 |
| Size | 225.6 MB | 297.1 MB |
| Events in quadrant A | 1,431,182 | 2,005,454 |
| Events in quadrant B | 1,365,594 | 1,974,306 |
| Events in quadrant C | 1,400,728 | 1,938,041 |
| Events in quadrant D | 1,214,276 | 1,765,399 |
| Mode M0 | |||
|---|---|---|---|
| Quadrant | BADHDUFLAG | Total packets | Discarded packets |
| A | 0 | 52170 | 0 |
| B | 0 | 55630 | 0 |
| C | 0 | 51724 | 0 |
| D | 0 | 58141 | 0 |
| Mode M9 | |||
|---|---|---|---|
| Quadrant | BADHDUFLAG | Total packets | Discarded packets |
| A | 0 | 20 | 0 |
| B | 0 | 20 | 0 |
| C | 0 | 20 | 0 |
| D | 0 | 20 | 0 |
| Mode SS | |||
|---|---|---|---|
| Quadrant | BADHDUFLAG | Total packets | Discarded packets |
| A | 0 | 520 | 0 |
| B | 0 | 520 | 0 |
| C | 0 | 520 | 0 |
| D | 0 | 520 | 0 |
| Quadrant | Total seconds | Saturated seconds | Saturation percentage |
|---|---|---|---|
| A | 25475 | 120 | 0.471050% |
| B | 25475 | 423 | 1.660451% |
| C | 25475 | 210 | 0.824338% |
| D | 25475 | 746 | 2.928361% |
Noise dominated data is calculated using 1-second bins in cleaned event files. If a bin has >2000 counts, and if more than 50% of those come from <1% of pixels, then it is considered to be noise-dominated and hence unusable.
| Quadrant | # 1 sec bins | Bins with >0 counts | Bins with >2000 counts | High rate bins dominated by noise | Noise dominated (total time) | Noise dominated (detector-on time) | Marked lightcurve |
|---|---|---|---|---|---|---|---|
| A | 27460 | 25475 | 0 | 0 | 0.00% | 0.00% |  |
| B | 27460 | 25474 | 0 | 0 | 0.00% | 0.00% |  |
| C | 27460 | 25475 | 0 | 0 | 0.00% | 0.00% | 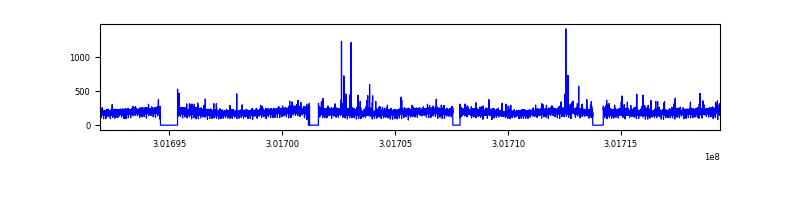 |
| D | 27460 | 25347 | 0 | 0 | 0.00% | 0.00% |  |
Top three noisy pixels from each quadrant. If the there are fewer than three noisy pixels in the level2.evt file, extra rows are filled as -1
| Pixel properties | Quadrant properties | ||||||
|---|---|---|---|---|---|---|---|
| Quadrant | DetID | PixID | Counts | Sigma | Mean | Median | Sigma |
| A | 0 | 29 | 1389 | 11.03 | 372 | 350 | 94.2 |
| A | 7 | 110 | 1132 | 8.31 | 372 | 350 | 94.2 |
| A | 0 | 30 | 1108 | 8.05 | 372 | 350 | 94.2 |
| B | 2 | 9 | 1090 | 10.16 | 361 | 344 | 73.4 |
| B | 14 | 254 | 927 | 7.94 | 361 | 344 | 73.4 |
| B | 2 | 8 | 893 | 7.48 | 361 | 344 | 73.4 |
| C | 12 | 249 | 970 | 6.45 | 369 | 345 | 97.0 |
| C | 12 | 241 | 964 | 6.38 | 369 | 345 | 97.0 |
| C | 3 | 126 | 948 | 6.22 | 369 | 345 | 97.0 |
| D | 7 | 3 | 883 | 6.0 | 346 | 315 | 94.6 |
| D | 10 | 189 | 846 | 5.61 | 346 | 315 | 94.6 |
| D | 6 | 83 | 845 | 5.6 | 346 | 315 | 94.6 |
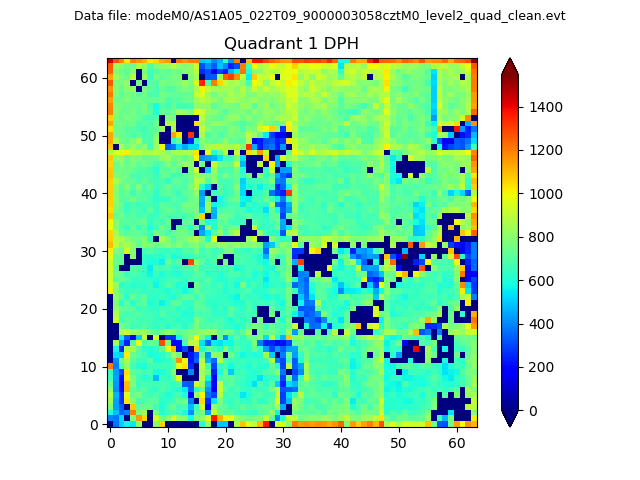
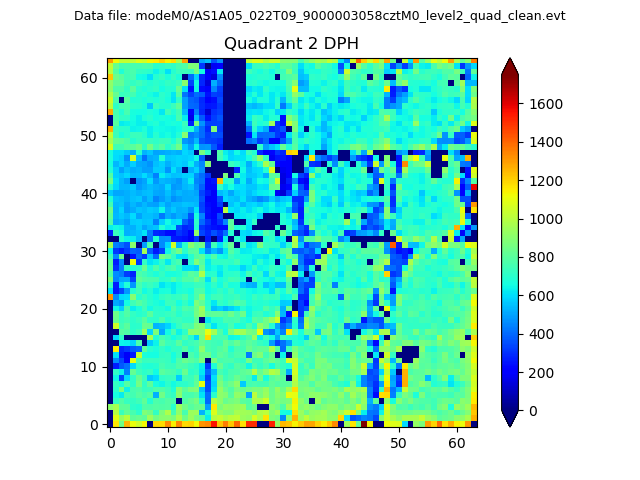
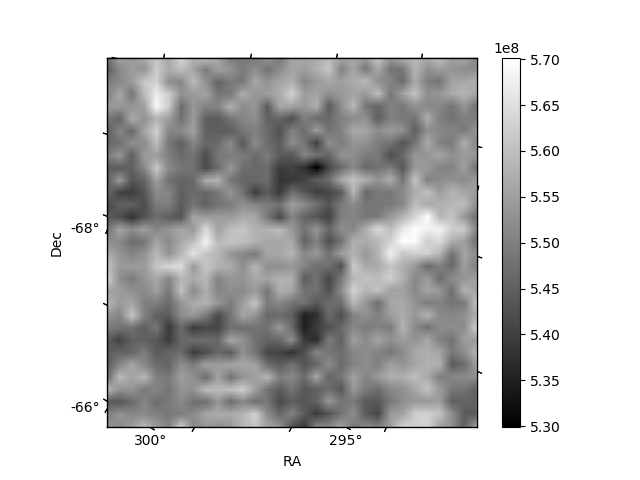
Histogram calculated using DETX and DETY for each event in the final _common_clean file
| Quadrant A |  |
 |
Quadrant B |
|---|---|---|---|
| Quadrant D |  |
 |
Quadrant C |
| Plot type | Count rate plots | Images |
|---|---|---|
| Comparison with Poisson distribution Blue bars denote a histogram of data divided into 1 sec bins. Red curve is a Poisson curve with rate = median count rate of data. |
 |
 |
| Quadrant-wise count rates Data is divided into 100 sec bins |
 |
|
| Module-wise count rates for Quadrant A Data is divided into 100 sec bins |
 |
 |
| Module-wise count rates for Quadrant B Data is divided into 100 sec bins |
 |
 |
| Module-wise count rates for Quadrant C Data is divided into 100 sec bins |
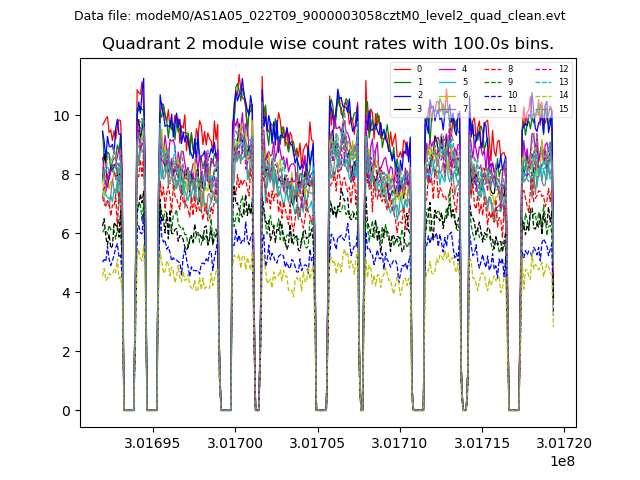 |
 |
| Module-wise count rates for Quadrant D Data is divided into 100 sec bins |
 |
 |
| Parameter | Plot |
|---|---|
| CZT HV Monitor |  |
| D_VDD |  |
| Temperature 1 | 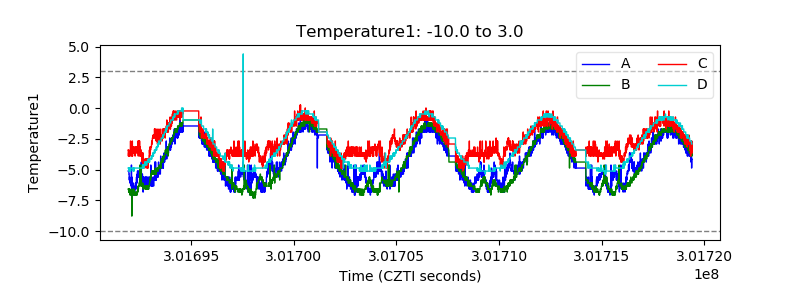 |
| Veto HV Monitor |  |
| Veto LLD | 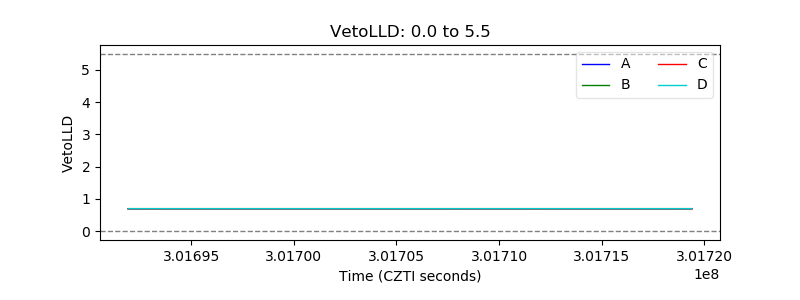 |
| Alpha Counter |  |
| _CPM_Rate | 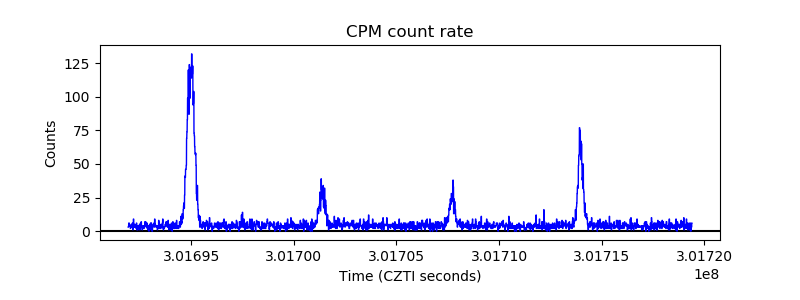 |
| CZT Counter |  |
| +2.5 Volts monitor | 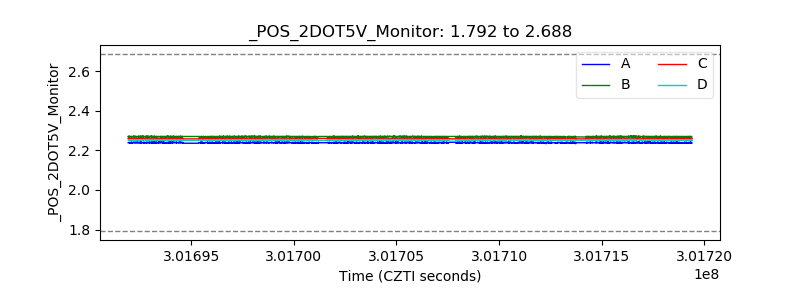 |
| +5 Volts monitor |  |
| _ROLL_ROT |  |
| _Roll_DEC |  |
| _Roll_RA |  |
| Veto Counter | 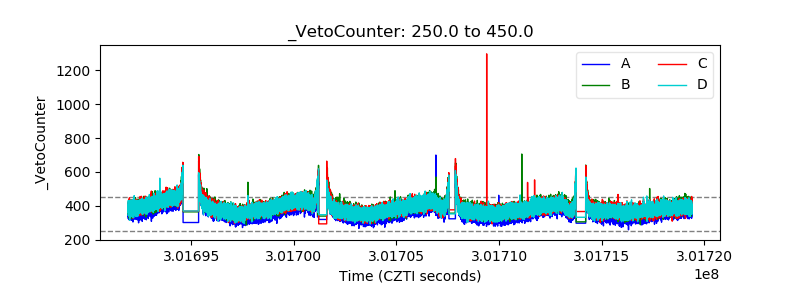 |