| Param | Original file | Final file |
|---|---|---|
| Filename | modeM0/AS1A05_022T09_9000003058_20658cztM0_level2.evt | modeM0/AS1A05_022T09_9000003058_20658cztM0_level2_quad_clean.evt |
| Size (bytes) | 289,952,640 | 65,280,960 |
| Size | 276.5 MB | 62.3 MB |
| Events in quadrant A | 2,005,316 | 434,034 |
| Events in quadrant B | 2,086,334 | 435,651 |
| Events in quadrant C | 1,960,459 | 423,449 |
| Events in quadrant D | 2,447,697 | 393,150 |
| Mode M0 | |||
|---|---|---|---|
| Quadrant | BADHDUFLAG | Total packets | Discarded packets |
| A | 0 | 8649 | 1 |
| B | 0 | 8771 | 1 |
| C | 0 | 8462 | 1 |
| D | 0 | 9994 | 1 |
| Mode M9 | |||
|---|---|---|---|
| Quadrant | BADHDUFLAG | Total packets | Discarded packets |
| A | 0 | 7 | 0 |
| B | 0 | 7 | 0 |
| C | 0 | 7 | 0 |
| D | 0 | 7 | 0 |
| Mode SS | |||
|---|---|---|---|
| Quadrant | BADHDUFLAG | Total packets | Discarded packets |
| A | 0 | 86 | 0 |
| B | 0 | 86 | 0 |
| C | 0 | 86 | 0 |
| D | 0 | 86 | 0 |
| Quadrant | Total seconds | Saturated seconds | Saturation percentage |
|---|---|---|---|
| A | 4114 | 33 | 0.802139% |
| B | 4114 | 65 | 1.579971% |
| C | 4114 | 45 | 1.093826% |
| D | 4114 | 247 | 6.003889% |
Noise dominated data is calculated using 1-second bins in cleaned event files. If a bin has >2000 counts, and if more than 50% of those come from <1% of pixels, then it is considered to be noise-dominated and hence unusable.
| Quadrant | # 1 sec bins | Bins with >0 counts | Bins with >2000 counts | High rate bins dominated by noise | Noise dominated (total time) | Noise dominated (detector-on time) | Marked lightcurve |
|---|---|---|---|---|---|---|---|
| A | 4874 | 4115 | 5 | 5 | 0.10% | 0.12% | 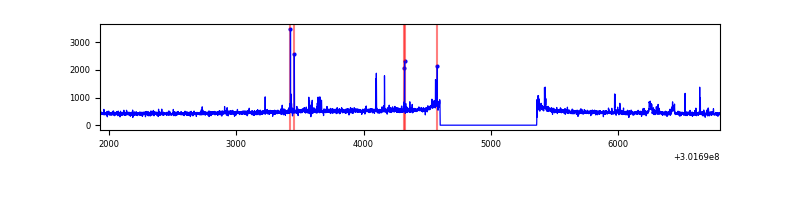 |
| B | 4874 | 4115 | 7 | 7 | 0.14% | 0.17% | 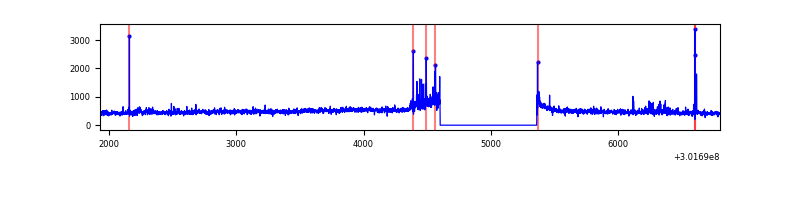 |
| C | 4874 | 4115 | 0 | 0 | 0.00% | 0.00% | 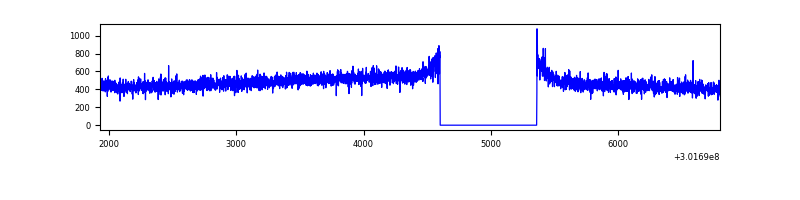 |
| D | 4874 | 4115 | 70 | 70 | 1.44% | 1.70% | 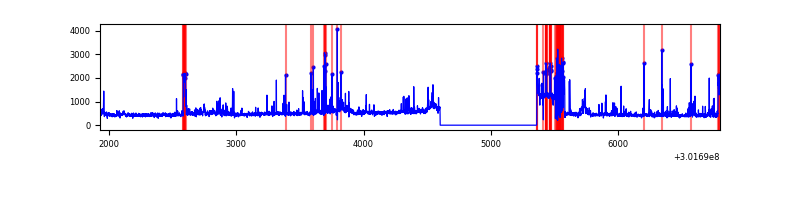 |
Top three noisy pixels from each quadrant. If the there are fewer than three noisy pixels in the level2.evt file, extra rows are filled as -1
| Pixel properties | Quadrant properties | ||||||
|---|---|---|---|---|---|---|---|
| Quadrant | DetID | PixID | Counts | Sigma | Mean | Median | Sigma |
| A | 5 | 16 | 53938 | 523.9 | 500 | 489 | 102.0 |
| A | 12 | 16 | 13874 | 131.2 | 500 | 489 | 102.0 |
| A | 8 | 205 | 7732 | 70.99 | 500 | 489 | 102.0 |
| B | 7 | 220 | 72607 | 751.02 | 497 | 484 | 96.0 |
| B | 0 | 219 | 13214 | 132.56 | 497 | 484 | 96.0 |
| B | 12 | 111 | 11137 | 110.93 | 497 | 484 | 96.0 |
| C | 14 | 238 | 76386 | 669.93 | 481 | 483 | 113.3 |
| C | 13 | 61 | 3541 | 26.99 | 481 | 483 | 113.3 |
| C | 7 | 247 | 3039 | 22.56 | 481 | 483 | 113.3 |
| D | 1 | 20 | 503701 | 4465.94 | 462 | 448 | 112.7 |
| D | 13 | 153 | 56329 | 495.89 | 462 | 448 | 112.7 |
| D | 1 | 52 | 51666 | 454.51 | 462 | 448 | 112.7 |
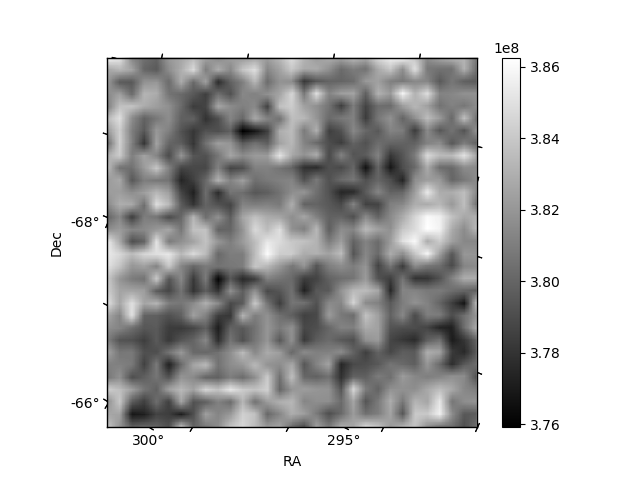
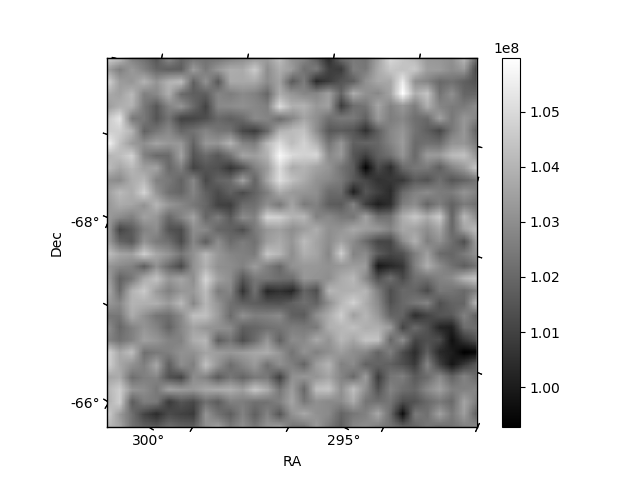
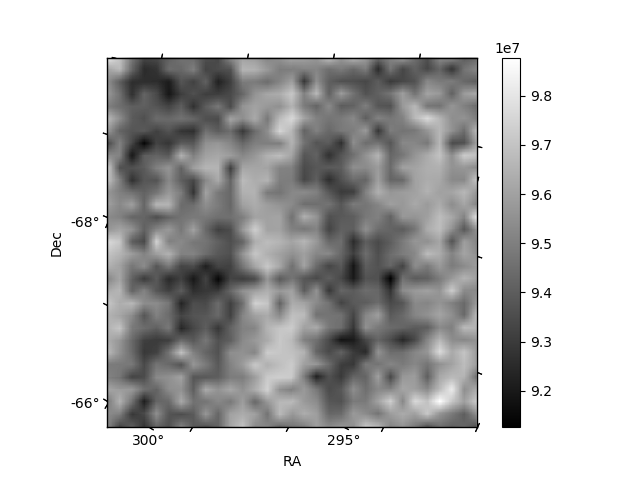
Histogram calculated using DETX and DETY for each event in the final _common_clean file
| Quadrant A | 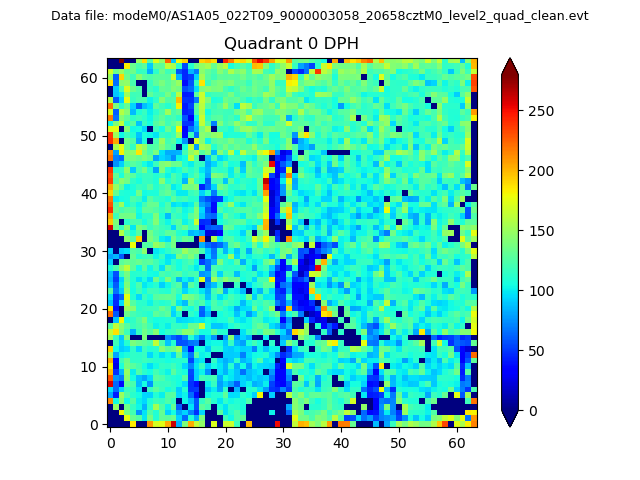 |
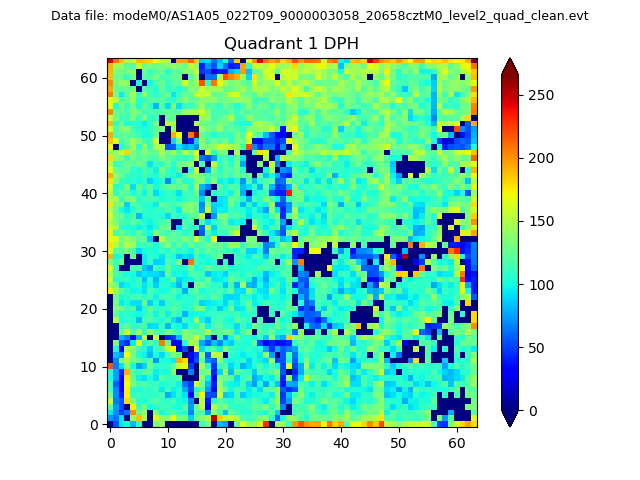 |
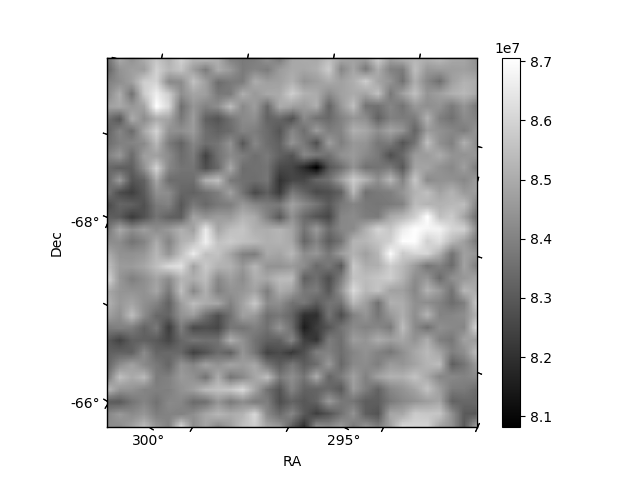
Quadrant B |
|---|---|---|---|
| Quadrant D | 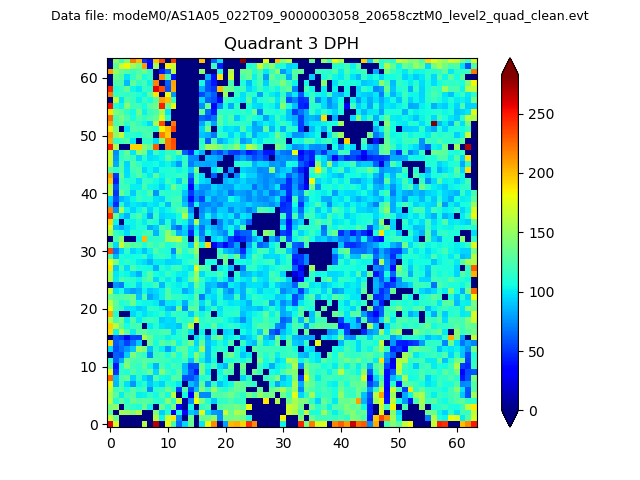 |
 |
Quadrant C |
| Plot type | Count rate plots | Images |
|---|---|---|
| Comparison with Poisson distribution Blue bars denote a histogram of data divided into 1 sec bins. Red curve is a Poisson curve with rate = median count rate of data. |
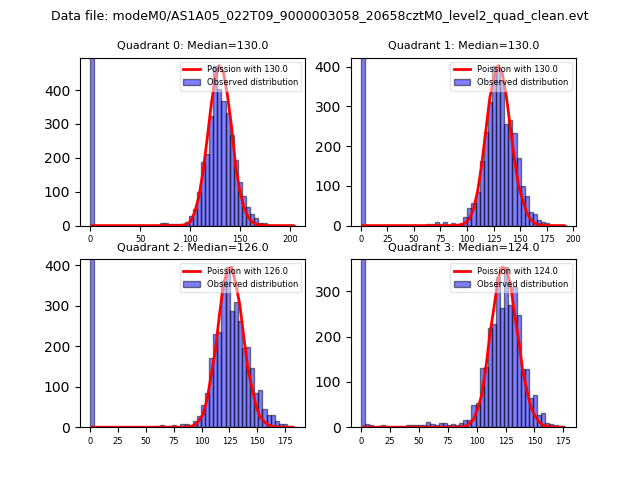 |
 |
| Quadrant-wise count rates Data is divided into 100 sec bins |
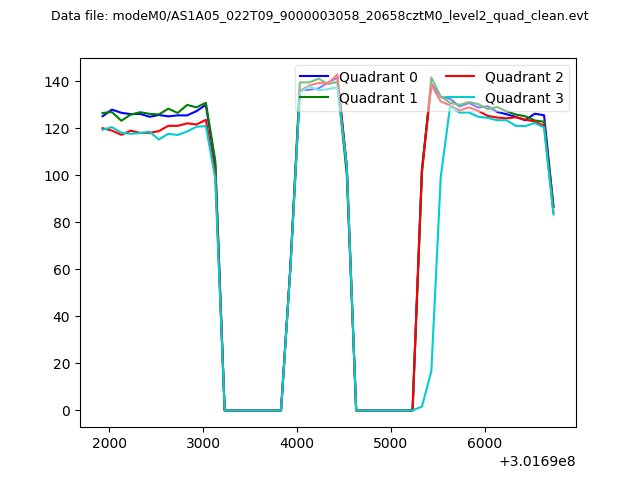 |
|
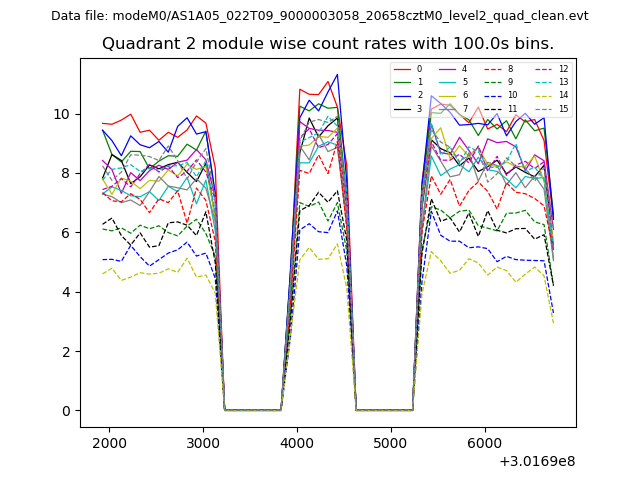
| Module-wise count rates for Quadrant A Data is divided into 100 sec bins |
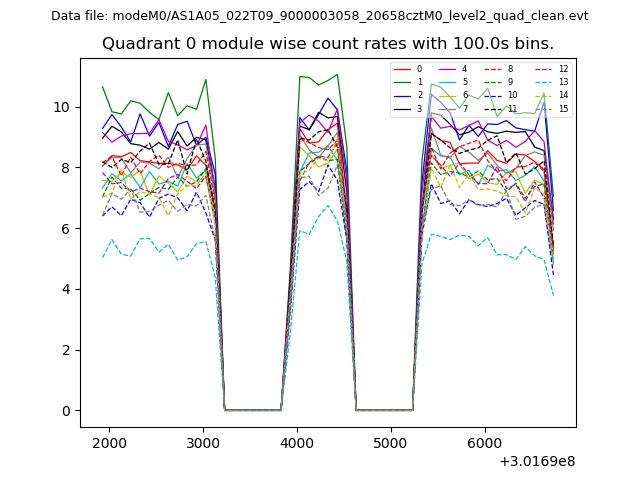 |
 |
| Module-wise count rates for Quadrant B Data is divided into 100 sec bins |
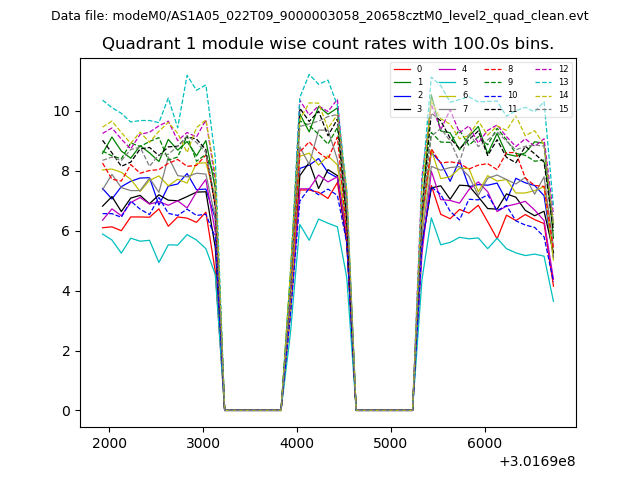 |
 |
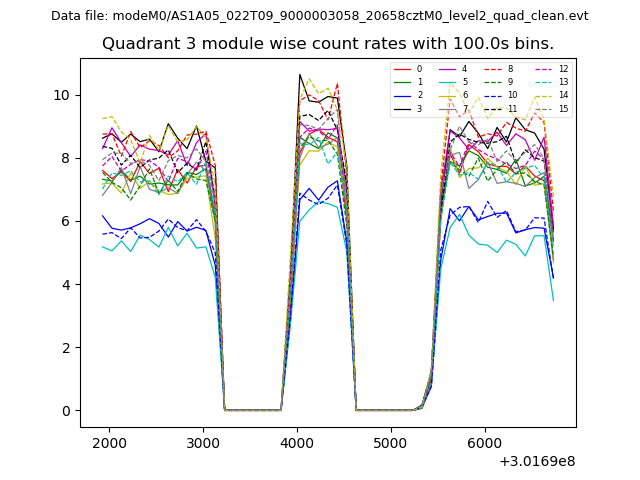
| Module-wise count rates for Quadrant C Data is divided into 100 sec bins |
 |
 |
| Module-wise count rates for Quadrant D Data is divided into 100 sec bins |
 |
 |
| Parameter | Plot |
|---|---|
| CZT HV Monitor | 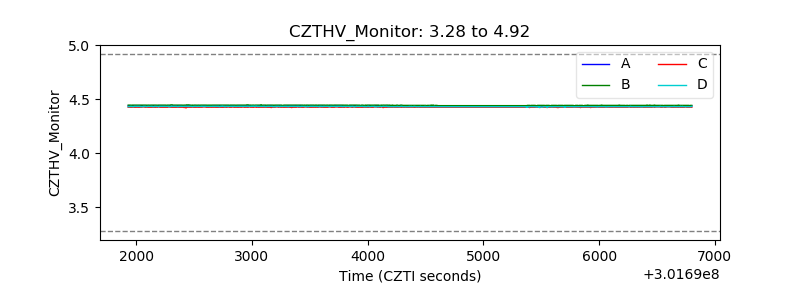 |
| D_VDD | 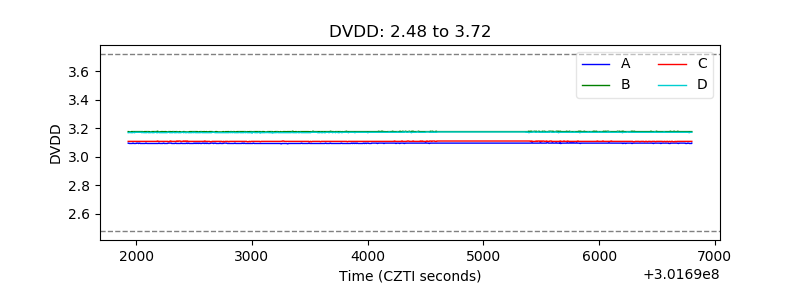 |
| Temperature 1 | 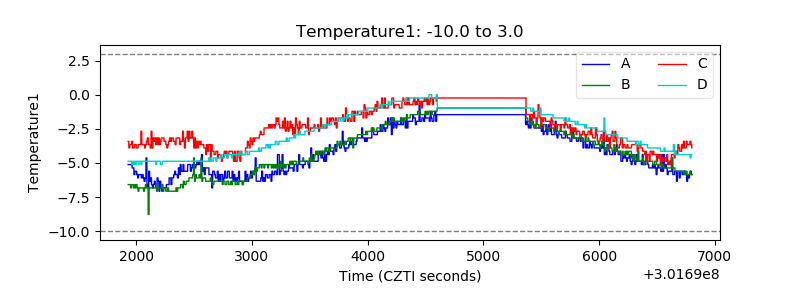 |
| Veto HV Monitor | 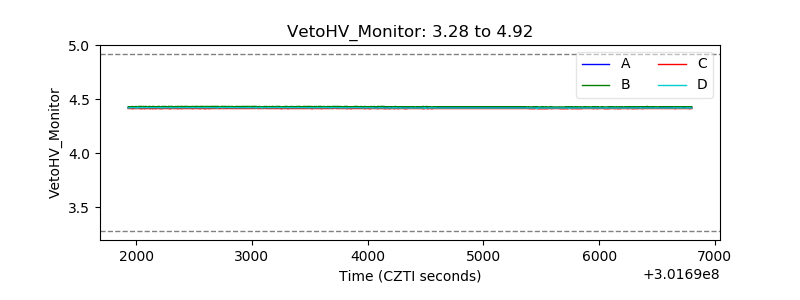 |
| Veto LLD | 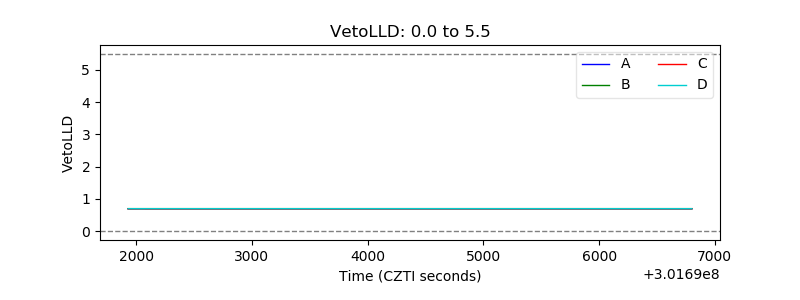 |
| Alpha Counter | 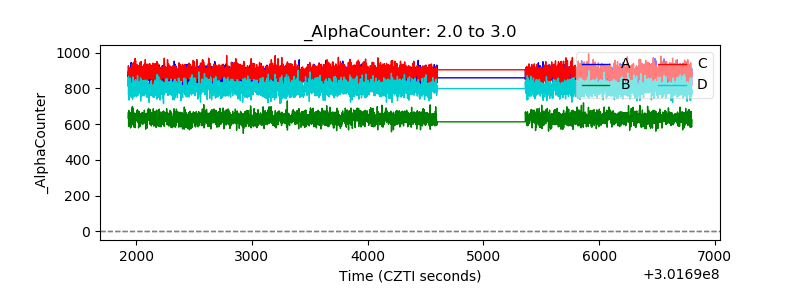 |
| _CPM_Rate | 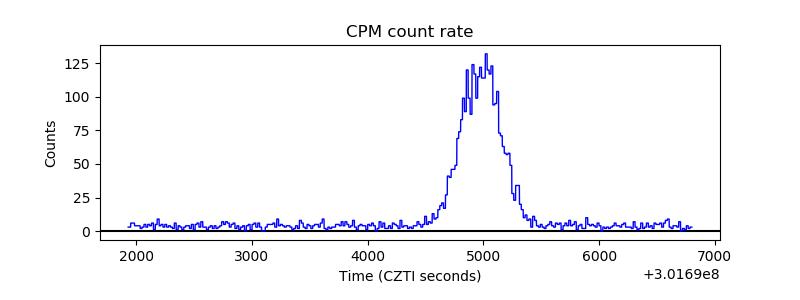 |
| CZT Counter |  |
| +2.5 Volts monitor |  |
| +5 Volts monitor | 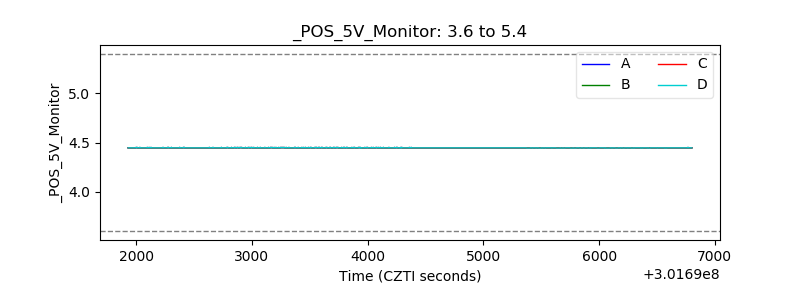 |
| _ROLL_ROT | 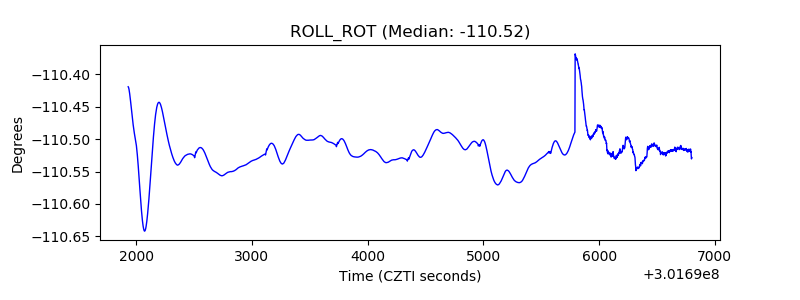 |
| _Roll_DEC | 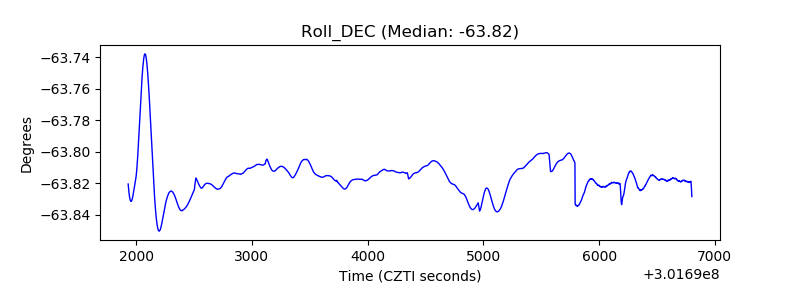 |
| _Roll_RA | 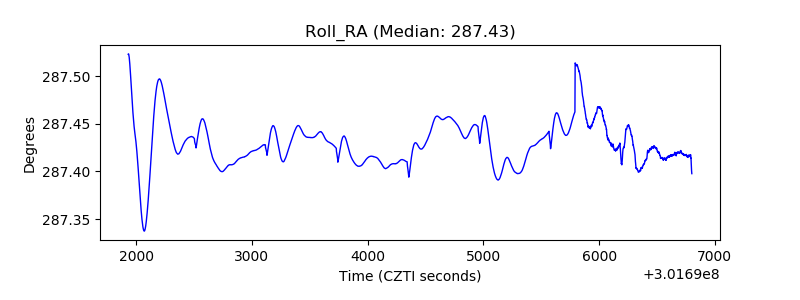 |
| Veto Counter | 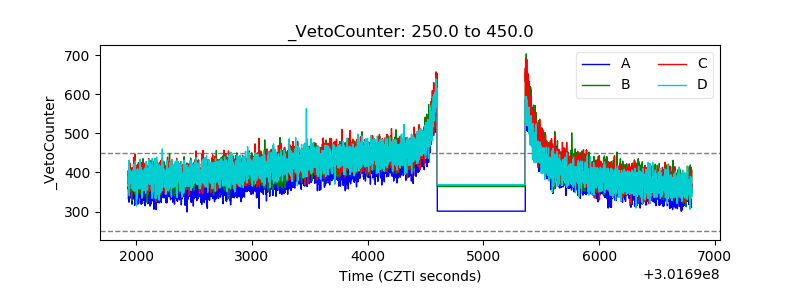 |