| Param | Original file | Final file |
|---|---|---|
| Filename | modeM0/AS1A05_022T09_9000003058_20659cztM0_level2.evt | modeM0/AS1A05_022T09_9000003058_20659cztM0_level2_quad_clean.evt |
| Size (bytes) | 515,462,400 | 132,318,720 |
| Size | 491.6 MB | 126.2 MB |
| Events in quadrant A | 3,580,478 | 884,680 |
| Events in quadrant B | 3,966,326 | 881,389 |
| Events in quadrant C | 3,564,137 | 870,436 |
| Events in quadrant D | 3,973,268 | 832,227 |
| Mode M0 | |||
|---|---|---|---|
| Quadrant | BADHDUFLAG | Total packets | Discarded packets |
| A | 0 | 16019 | 2 |
| B | 0 | 17171 | 2 |
| C | 0 | 15868 | 2 |
| D | 0 | 17392 | 2 |
| Mode M9 | |||
|---|---|---|---|
| Quadrant | BADHDUFLAG | Total packets | Discarded packets |
| A | 0 | 12 | 0 |
| B | 0 | 12 | 0 |
| C | 0 | 12 | 0 |
| D | 0 | 12 | 0 |
| Mode SS | |||
|---|---|---|---|
| Quadrant | BADHDUFLAG | Total packets | Discarded packets |
| A | 0 | 160 | 0 |
| B | 0 | 160 | 0 |
| C | 0 | 160 | 0 |
| D | 0 | 160 | 0 |
| Quadrant | Total seconds | Saturated seconds | Saturation percentage |
|---|---|---|---|
| A | 7752 | 47 | 0.606295% |
| B | 7753 | 166 | 2.141107% |
| C | 7753 | 57 | 0.735199% |
| D | 7753 | 267 | 3.443828% |
Noise dominated data is calculated using 1-second bins in cleaned event files. If a bin has >2000 counts, and if more than 50% of those come from <1% of pixels, then it is considered to be noise-dominated and hence unusable.
| Quadrant | # 1 sec bins | Bins with >0 counts | Bins with >2000 counts | High rate bins dominated by noise | Noise dominated (total time) | Noise dominated (detector-on time) | Marked lightcurve |
|---|---|---|---|---|---|---|---|
| A | 8947 | 7755 | 3 | 3 | 0.03% | 0.04% | 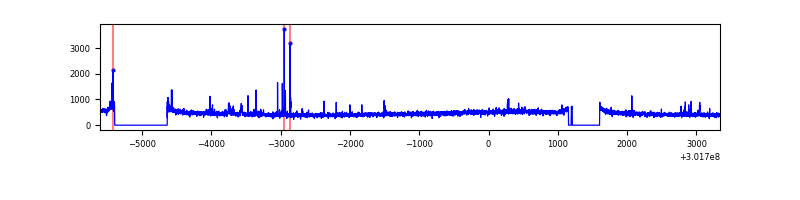 |
| B | 8948 | 7756 | 39 | 39 | 0.44% | 0.50% |  |
| C | 8948 | 7756 | 0 | 0 | 0.00% | 0.00% | 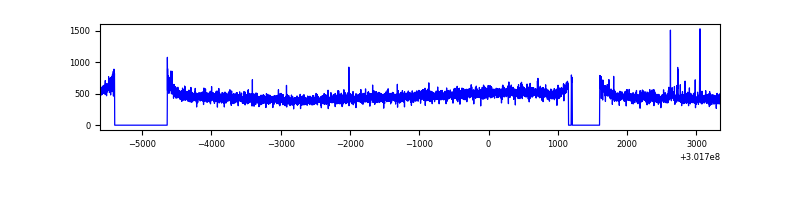 |
| D | 8948 | 7756 | 85 | 85 | 0.95% | 1.10% | 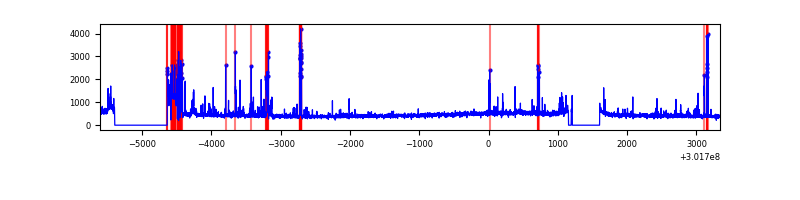 |
Top three noisy pixels from each quadrant. If the there are fewer than three noisy pixels in the level2.evt file, extra rows are filled as -1
| Pixel properties | Quadrant properties | ||||||
|---|---|---|---|---|---|---|---|
| Quadrant | DetID | PixID | Counts | Sigma | Mean | Median | Sigma |
| A | 5 | 16 | 60139 | 324.77 | 907 | 889 | 182.4 |
| A | 12 | 16 | 14369 | 73.89 | 907 | 889 | 182.4 |
| A | 12 | 194 | 8929 | 44.07 | 907 | 889 | 182.4 |
| B | 7 | 220 | 305885 | 1769.21 | 903 | 878 | 172.4 |
| B | 0 | 189 | 28026 | 157.47 | 903 | 878 | 172.4 |
| B | 6 | 36 | 24042 | 134.36 | 903 | 878 | 172.4 |
| C | 14 | 238 | 135317 | 658.43 | 871 | 877 | 204.2 |
| C | 7 | 247 | 17074 | 79.33 | 871 | 877 | 204.2 |
| C | 5 | 4 | 10916 | 49.17 | 871 | 877 | 204.2 |
| D | 1 | 20 | 445734 | 2141.4 | 855 | 828 | 207.8 |
| D | 13 | 153 | 112451 | 537.26 | 855 | 828 | 207.8 |
| D | 1 | 52 | 82766 | 394.38 | 855 | 828 | 207.8 |
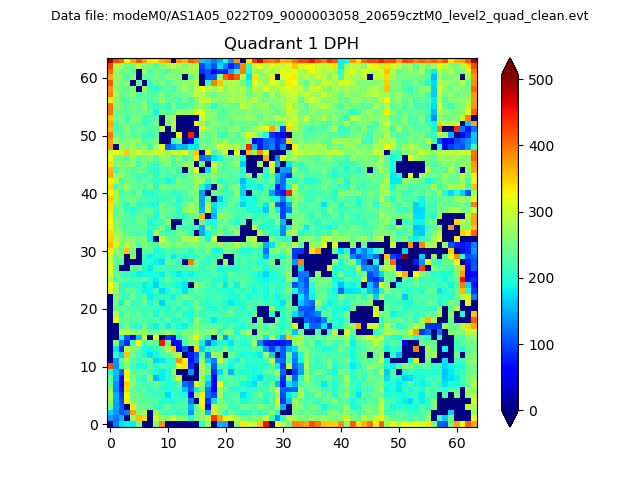
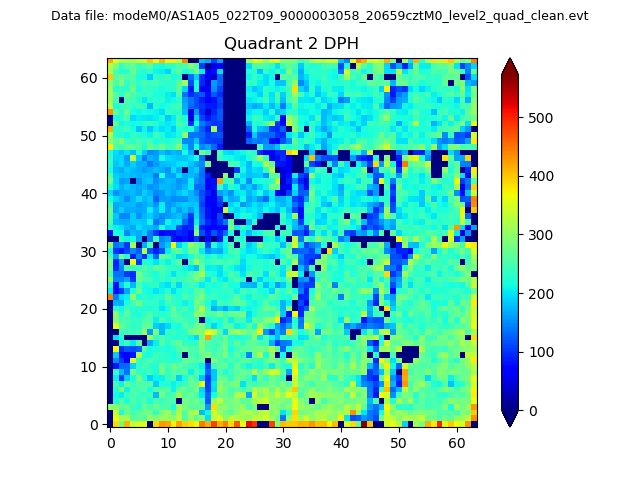
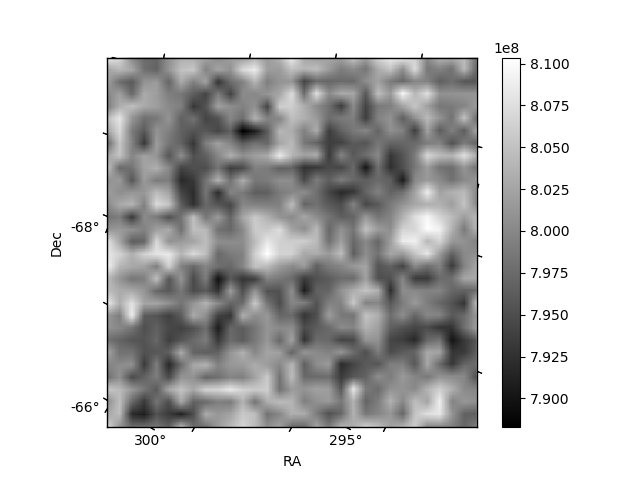
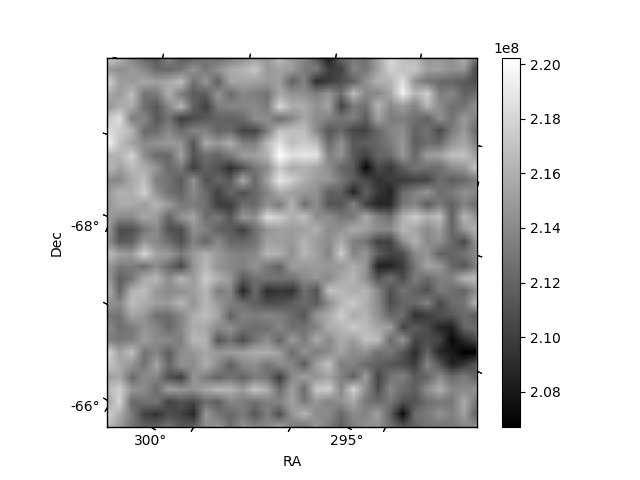
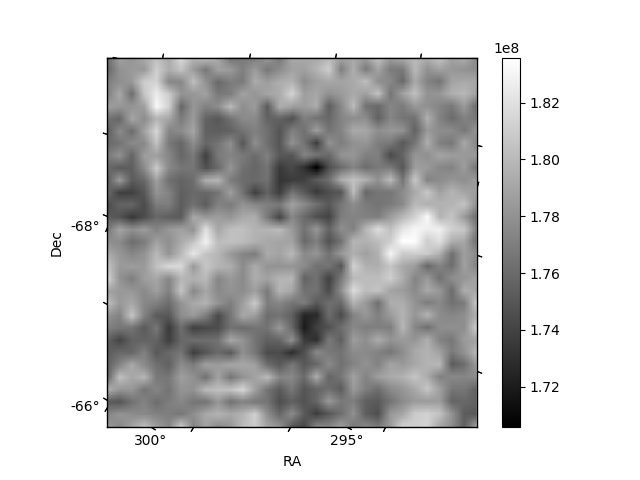
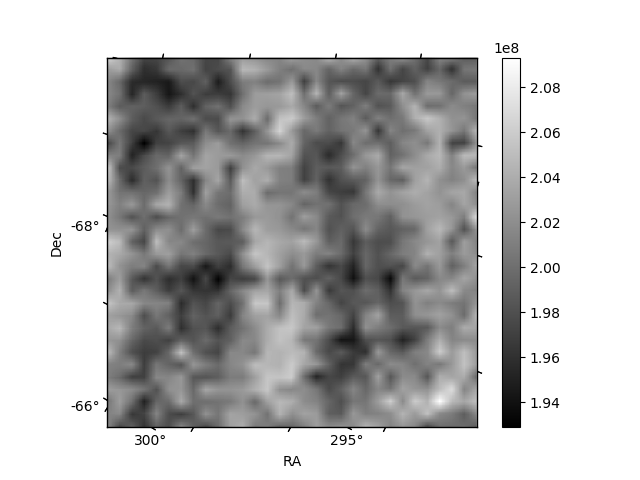
Histogram calculated using DETX and DETY for each event in the final _common_clean file
| Quadrant A | 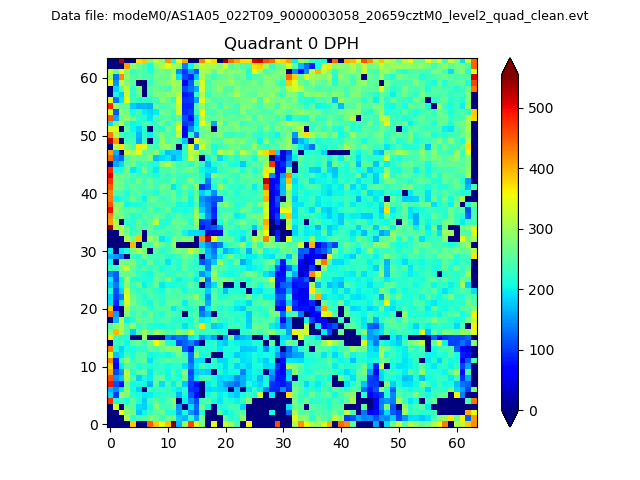 |
 |
Quadrant B |
|---|---|---|---|
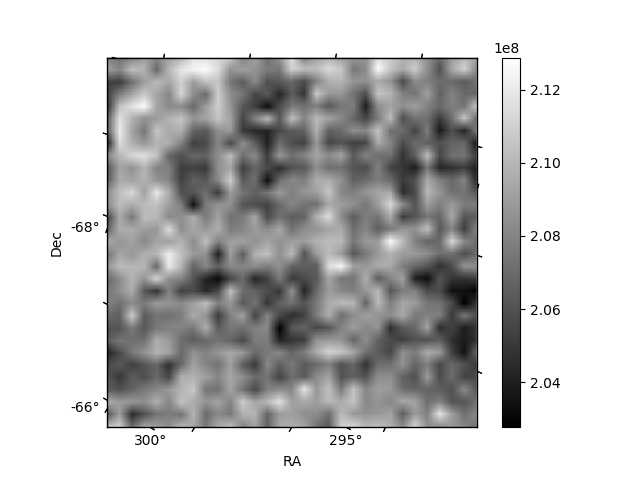
| Quadrant D | 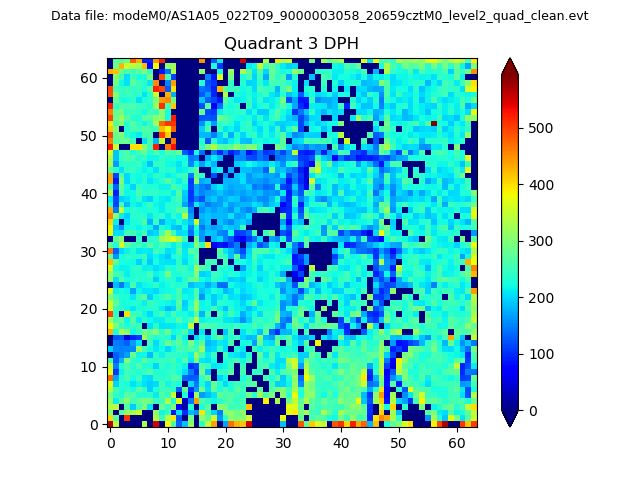 |
 |
Quadrant C |
| Plot type | Count rate plots | Images |
|---|---|---|
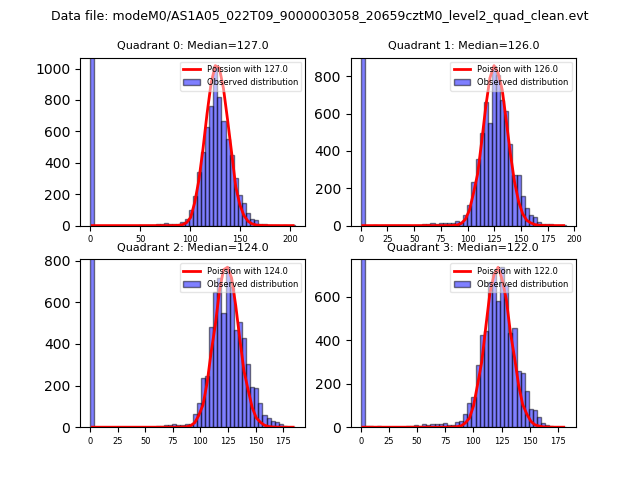
| Comparison with Poisson distribution Blue bars denote a histogram of data divided into 1 sec bins. Red curve is a Poisson curve with rate = median count rate of data. |
 |
 |
| Quadrant-wise count rates Data is divided into 100 sec bins |
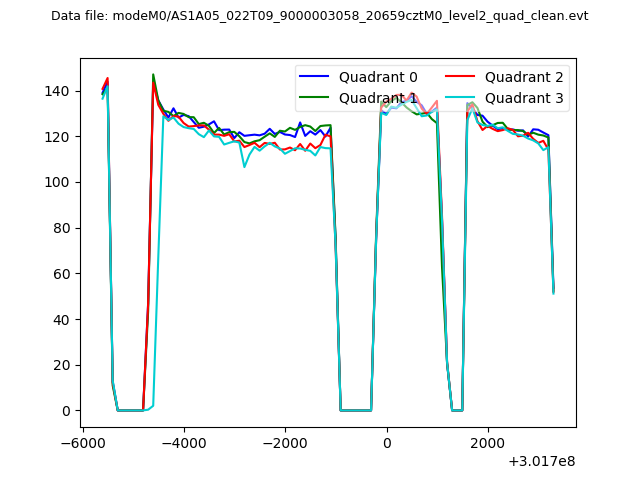 |
|
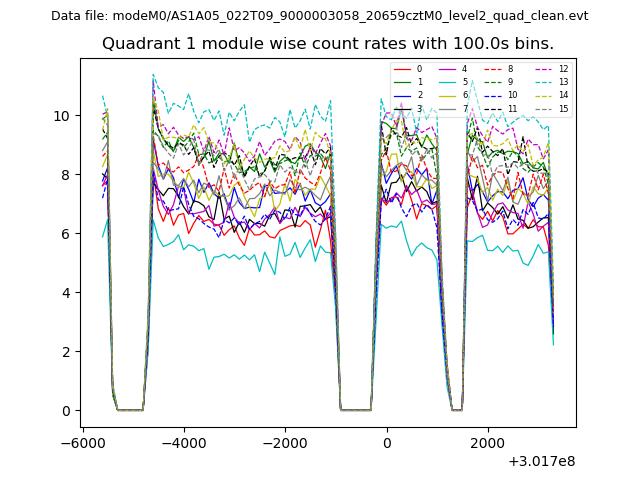
| Module-wise count rates for Quadrant A Data is divided into 100 sec bins |
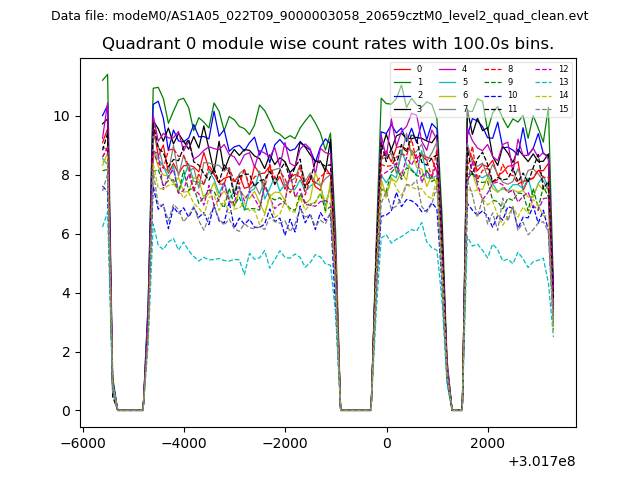 |
 |
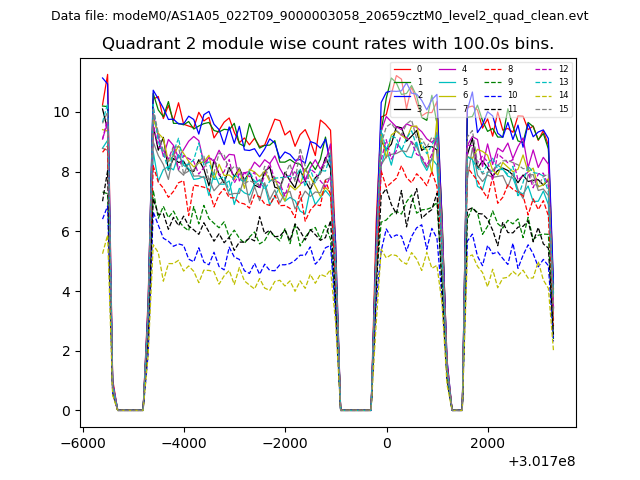
| Module-wise count rates for Quadrant B Data is divided into 100 sec bins |
 |
 |
| Module-wise count rates for Quadrant C Data is divided into 100 sec bins |
 |
 |
| Module-wise count rates for Quadrant D Data is divided into 100 sec bins |
 |
 |
| Parameter | Plot |
|---|---|
| CZT HV Monitor | 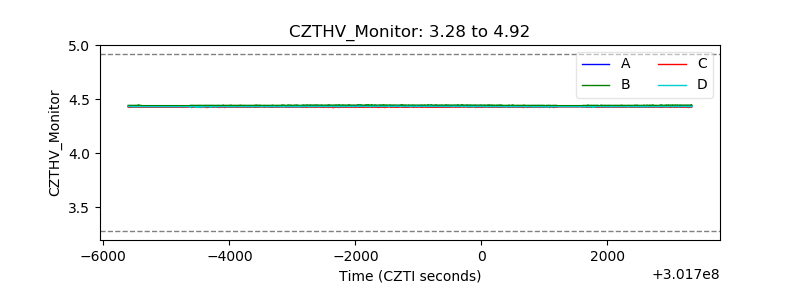 |
| D_VDD |  |
| Temperature 1 | 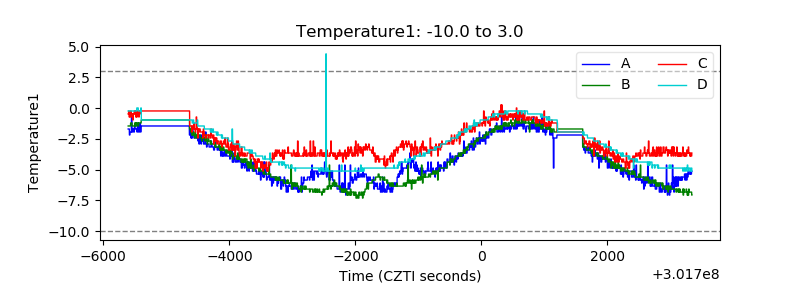 |
| Veto HV Monitor | 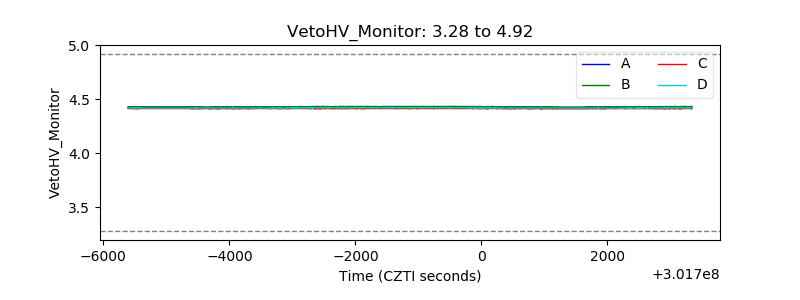 |
| Veto LLD |  |
| Alpha Counter | 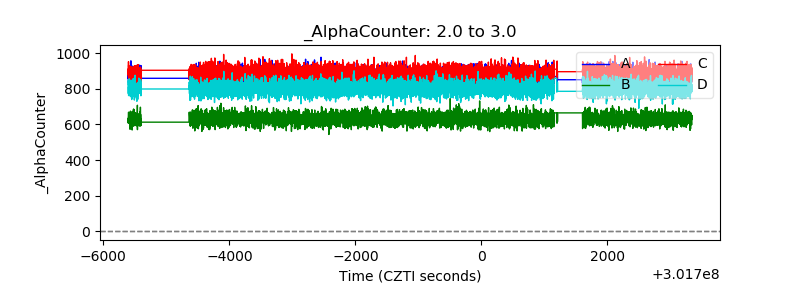 |
| _CPM_Rate | 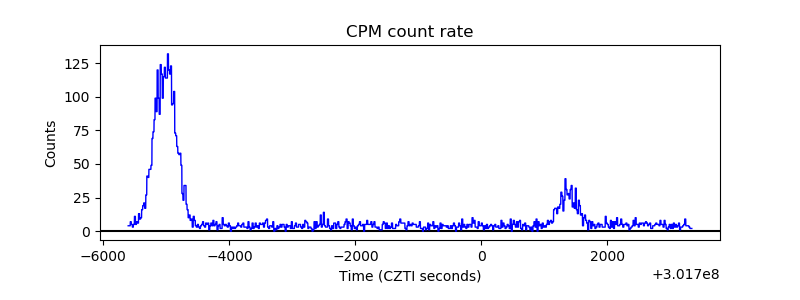 |
| CZT Counter | 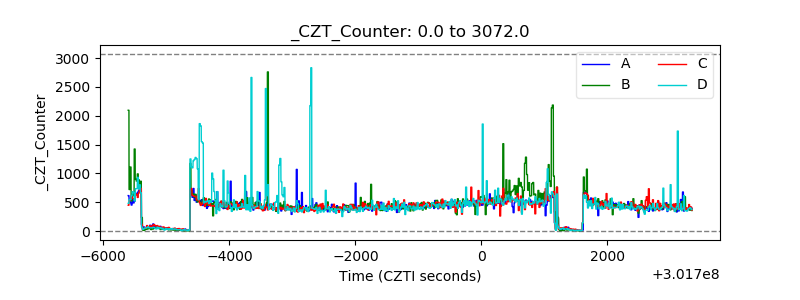 |
| +2.5 Volts monitor |  |
| +5 Volts monitor |  |
| _ROLL_ROT |  |
| _Roll_DEC | 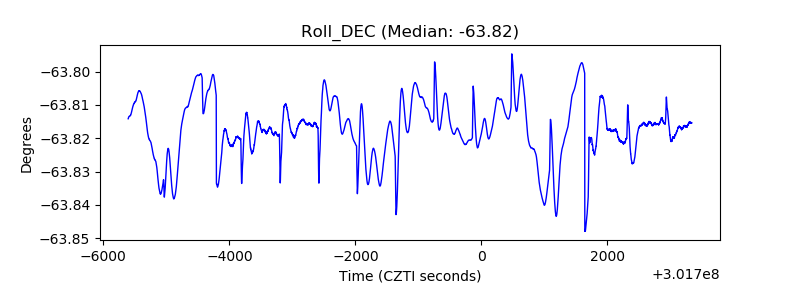 |
| _Roll_RA | 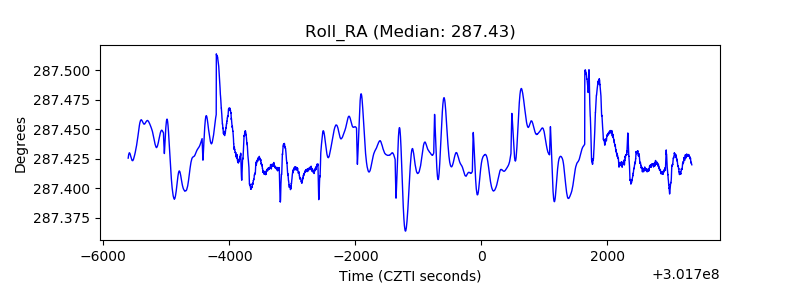 |
| Veto Counter | 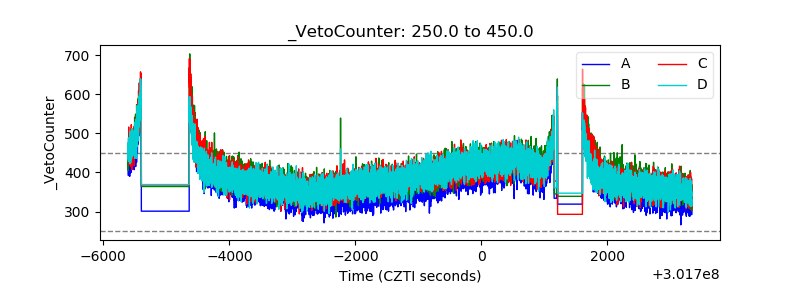 |