| Param | Original file | Final file |
|---|---|---|
| Filename | modeM0/AS1A05_022T09_9000003058_20660cztM0_level2.evt | modeM0/AS1A05_022T09_9000003058_20660cztM0_level2_quad_clean.evt |
| Size (bytes) | 532,270,080 | 138,588,480 |
| Size | 507.6 MB | 132.2 MB |
| Events in quadrant A | 3,674,397 | 921,885 |
| Events in quadrant B | 4,199,922 | 916,904 |
| Events in quadrant C | 3,747,466 | 906,361 |
| Events in quadrant D | 3,947,644 | 889,344 |
| Mode M0 | |||
|---|---|---|---|
| Quadrant | BADHDUFLAG | Total packets | Discarded packets |
| A | 0 | 16557 | 2 |
| B | 0 | 18110 | 2 |
| C | 0 | 16532 | 2 |
| D | 0 | 17558 | 2 |
| Mode M9 | |||
|---|---|---|---|
| Quadrant | BADHDUFLAG | Total packets | Discarded packets |
| A | 0 | 8 | 0 |
| B | 0 | 8 | 0 |
| C | 0 | 8 | 0 |
| D | 0 | 8 | 0 |
| Mode SS | |||
|---|---|---|---|
| Quadrant | BADHDUFLAG | Total packets | Discarded packets |
| A | 0 | 166 | 0 |
| B | 0 | 166 | 0 |
| C | 0 | 166 | 0 |
| D | 0 | 166 | 0 |
| Quadrant | Total seconds | Saturated seconds | Saturation percentage |
|---|---|---|---|
| A | 8110 | 40 | 0.493218% |
| B | 8110 | 188 | 2.318126% |
| C | 8110 | 69 | 0.850801% |
| D | 8111 | 120 | 1.479472% |
Noise dominated data is calculated using 1-second bins in cleaned event files. If a bin has >2000 counts, and if more than 50% of those come from <1% of pixels, then it is considered to be noise-dominated and hence unusable.
| Quadrant | # 1 sec bins | Bins with >0 counts | Bins with >2000 counts | High rate bins dominated by noise | Noise dominated (total time) | Noise dominated (detector-on time) | Marked lightcurve |
|---|---|---|---|---|---|---|---|
| A | 8865 | 8113 | 0 | 0 | 0.00% | 0.00% | 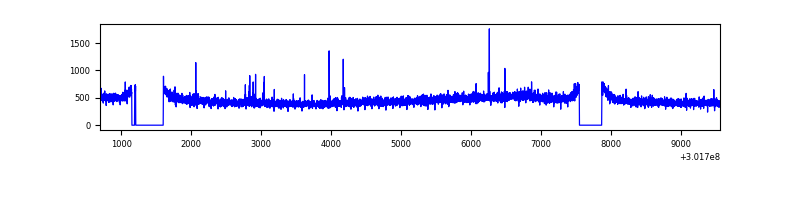 |
| B | 8865 | 8113 | 49 | 49 | 0.55% | 0.60% | 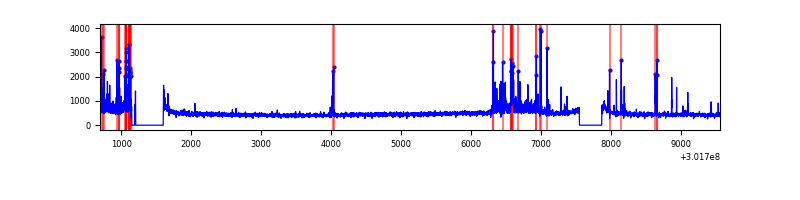 |
| C | 8865 | 8113 | 0 | 0 | 0.00% | 0.00% | 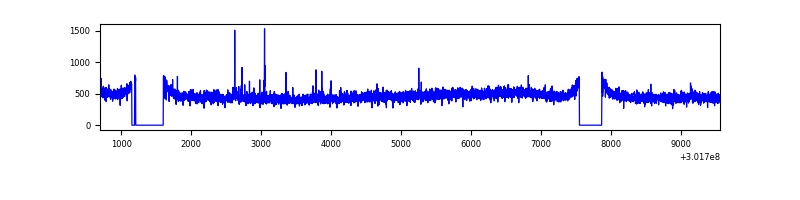 |
| D | 8866 | 8114 | 73 | 73 | 0.82% | 0.90% | 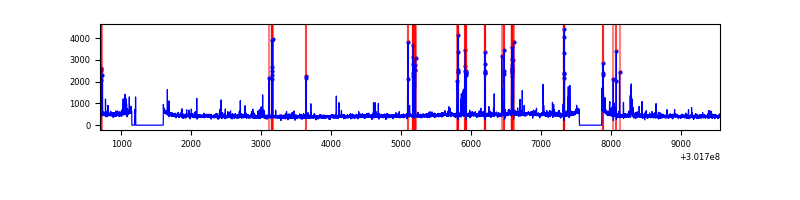 |
Top three noisy pixels from each quadrant. If the there are fewer than three noisy pixels in the level2.evt file, extra rows are filled as -1
| Pixel properties | Quadrant properties | ||||||
|---|---|---|---|---|---|---|---|
| Quadrant | DetID | PixID | Counts | Sigma | Mean | Median | Sigma |
| A | 5 | 16 | 15215 | 74.55 | 948 | 927 | 191.7 |
| A | 8 | 205 | 9523 | 44.85 | 948 | 927 | 191.7 |
| A | 0 | 226 | 8371 | 38.84 | 948 | 927 | 191.7 |
| B | 7 | 220 | 325908 | 1836.57 | 941 | 917 | 177.0 |
| B | 6 | 36 | 41568 | 229.72 | 941 | 917 | 177.0 |
| B | 0 | 214 | 30758 | 168.64 | 941 | 917 | 177.0 |
| C | 14 | 238 | 141454 | 658.59 | 912 | 917 | 213.4 |
| C | 7 | 247 | 29166 | 132.38 | 912 | 917 | 213.4 |
| C | 5 | 4 | 11645 | 50.27 | 912 | 917 | 213.4 |
| D | 1 | 239 | 170005 | 759.85 | 917 | 889 | 222.6 |
| D | 1 | 52 | 115145 | 513.36 | 917 | 889 | 222.6 |
| D | 13 | 153 | 87833 | 390.65 | 917 | 889 | 222.6 |
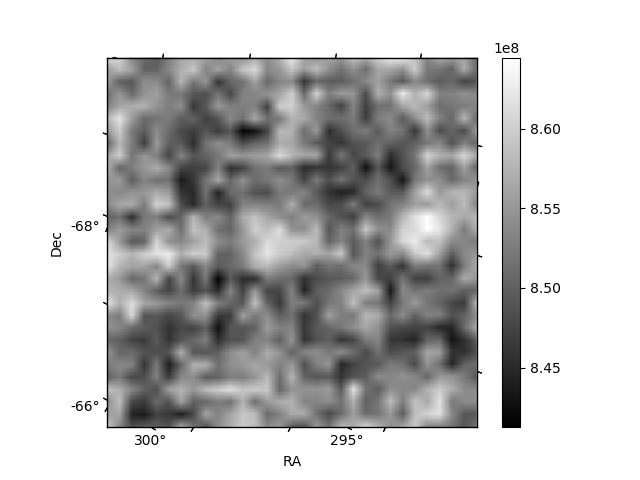
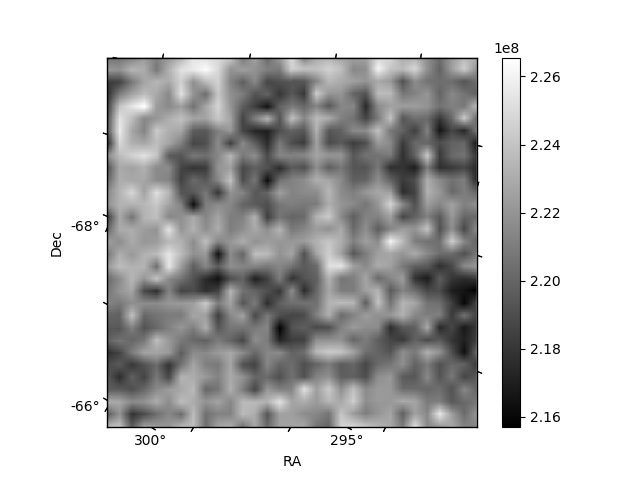
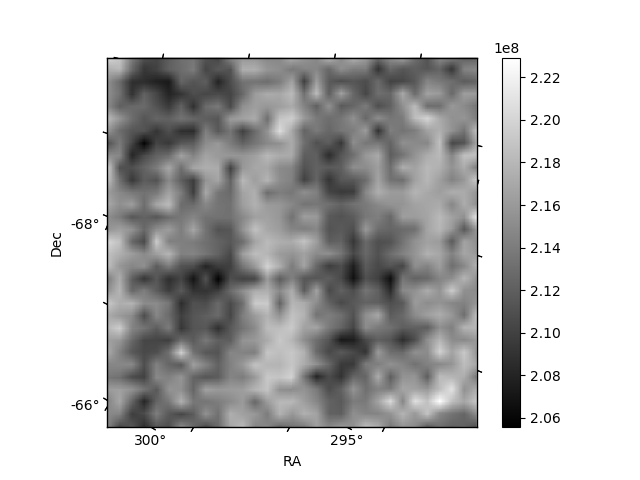
Histogram calculated using DETX and DETY for each event in the final _common_clean file
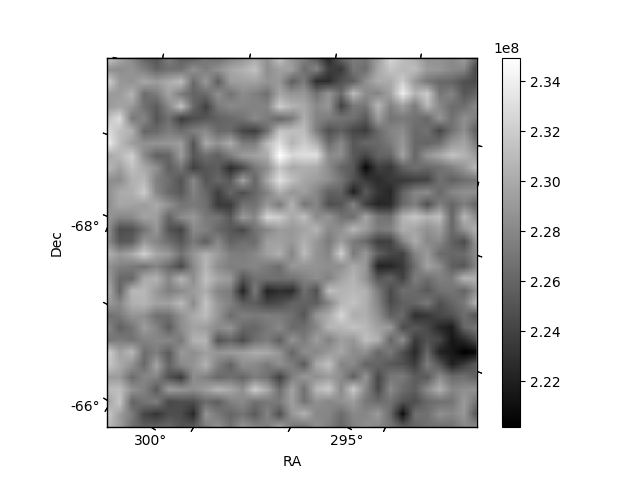
| Quadrant A | 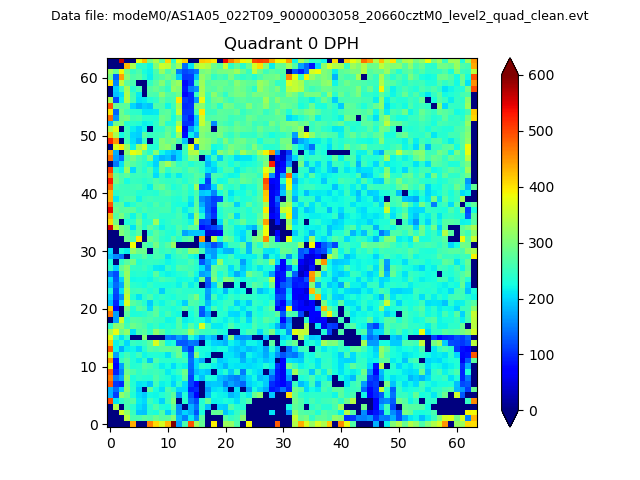 |
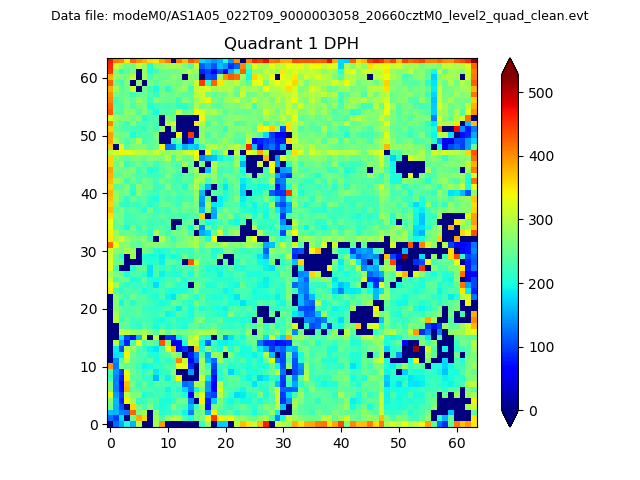 |
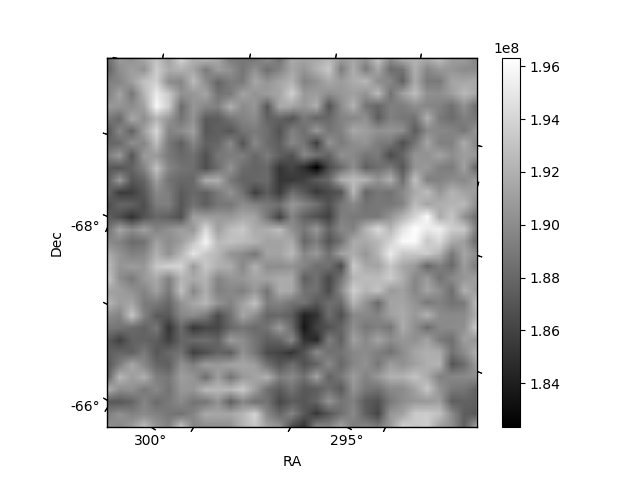
Quadrant B |
|---|---|---|---|
| Quadrant D |  |
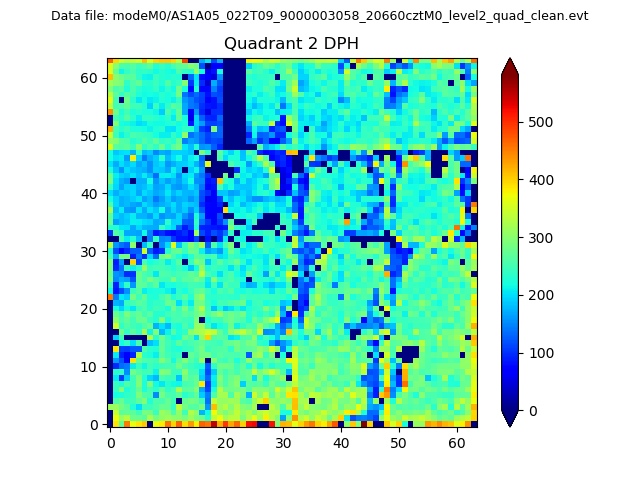 |
Quadrant C |
| Plot type | Count rate plots | Images |
|---|---|---|
| Comparison with Poisson distribution Blue bars denote a histogram of data divided into 1 sec bins. Red curve is a Poisson curve with rate = median count rate of data. |
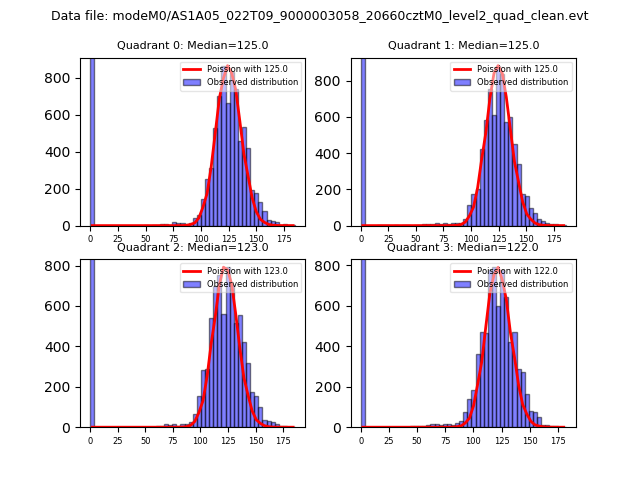 |
 |
| Quadrant-wise count rates Data is divided into 100 sec bins |
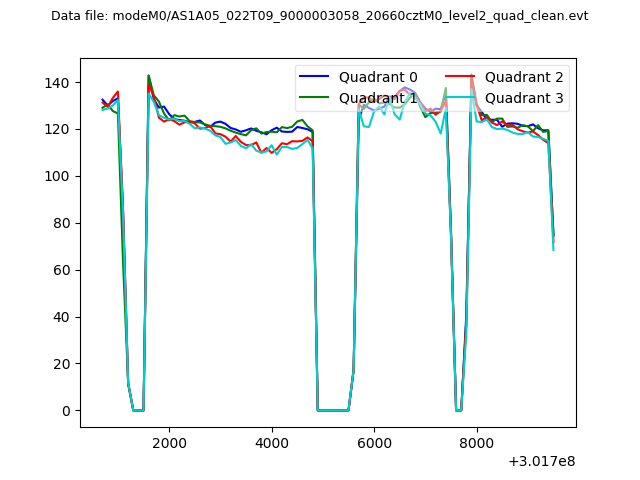 |
|
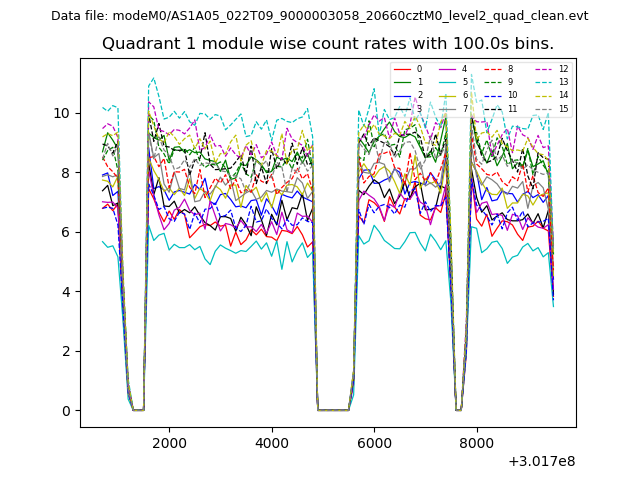
| Module-wise count rates for Quadrant A Data is divided into 100 sec bins |
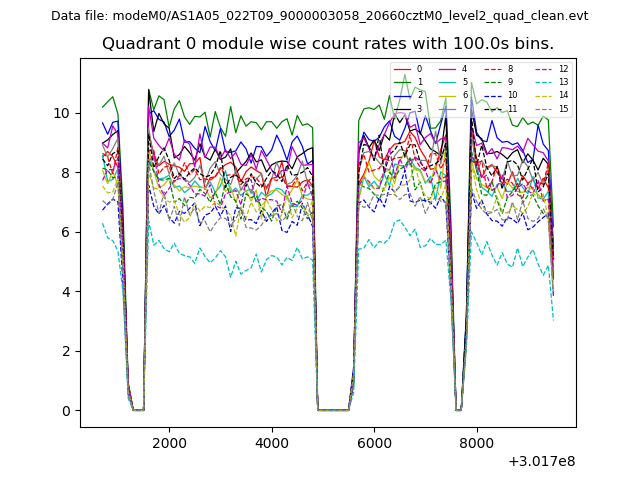 |
 |
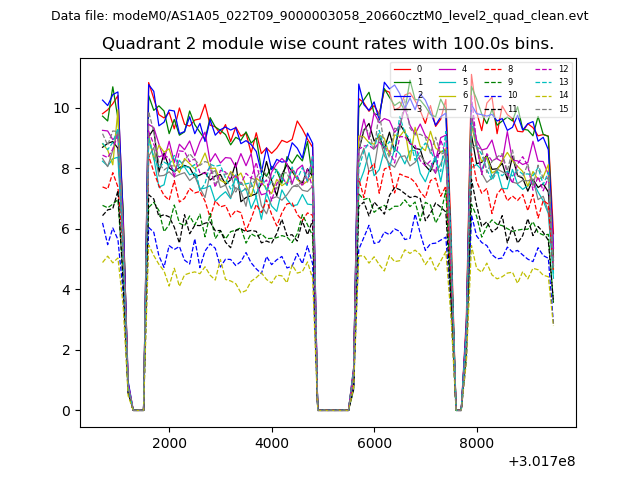
| Module-wise count rates for Quadrant B Data is divided into 100 sec bins |
 |
 |
| Module-wise count rates for Quadrant C Data is divided into 100 sec bins |
 |
 |
| Module-wise count rates for Quadrant D Data is divided into 100 sec bins |
 |
 |
| Parameter | Plot |
|---|---|
| CZT HV Monitor | 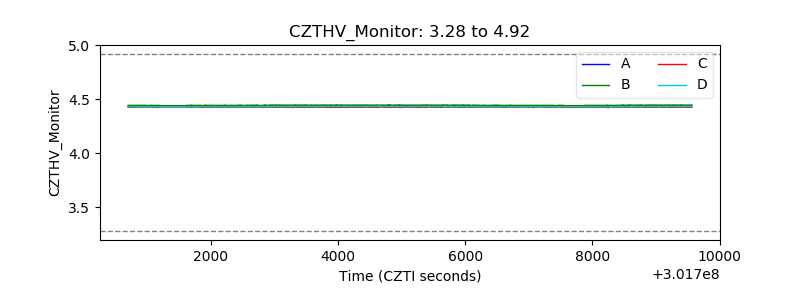 |
| D_VDD | 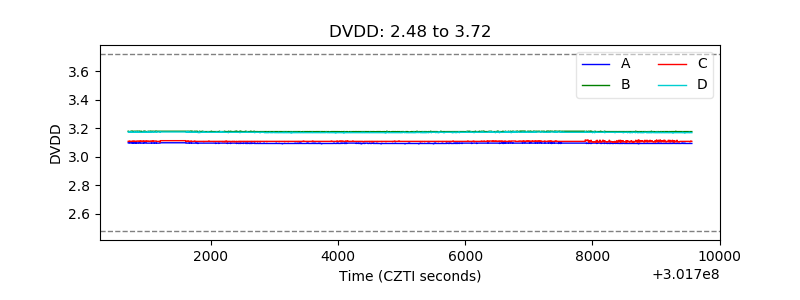 |
| Temperature 1 | 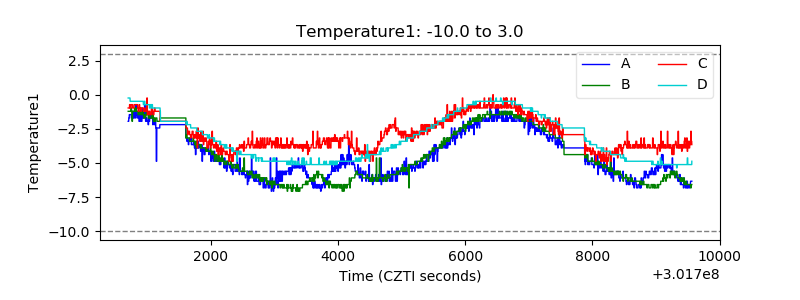 |
| Veto HV Monitor | 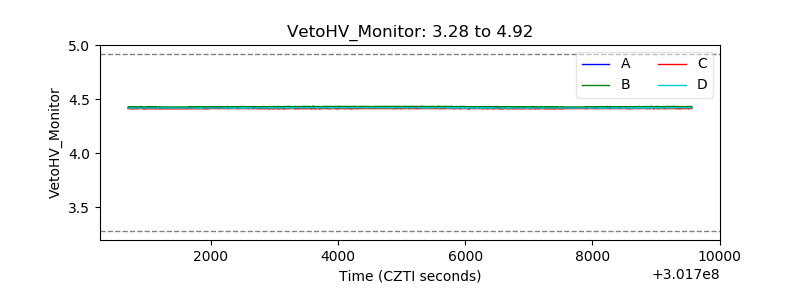 |
| Veto LLD | 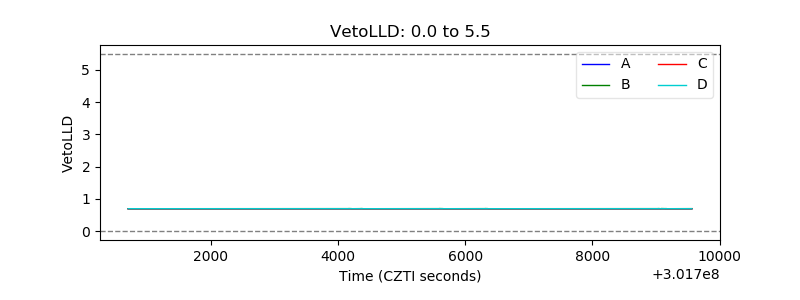 |
| Alpha Counter | 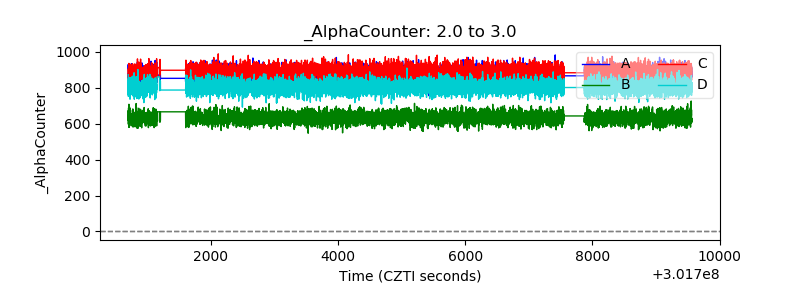 |
| _CPM_Rate | 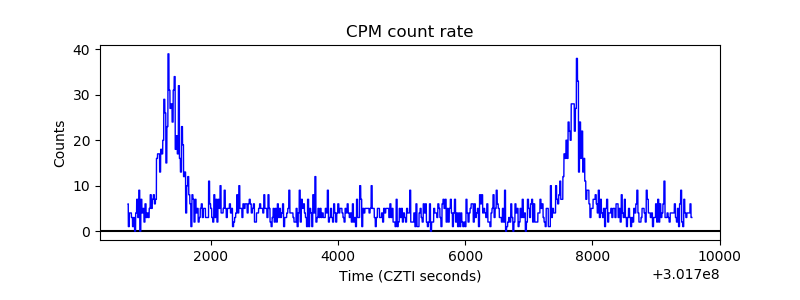 |
| CZT Counter | 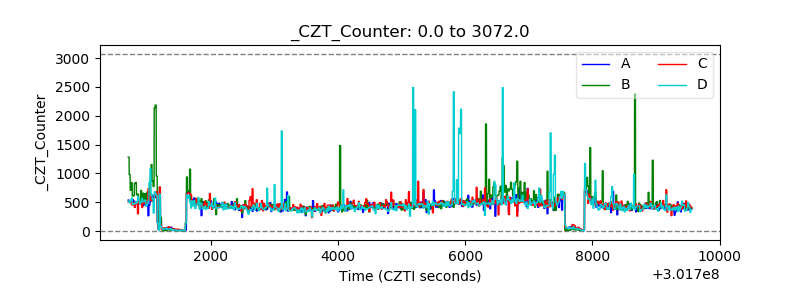 |
| +2.5 Volts monitor |  |
| +5 Volts monitor |  |
| _ROLL_ROT | 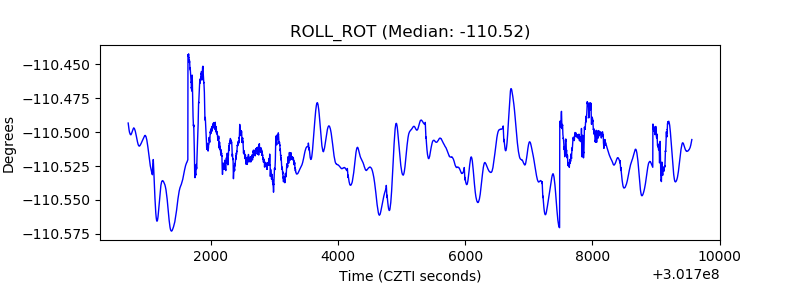 |
| _Roll_DEC | 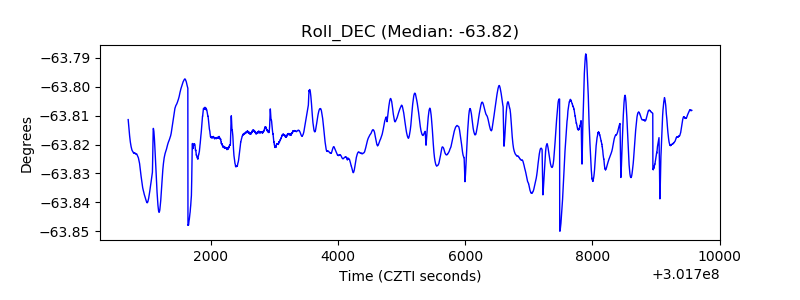 |
| _Roll_RA | 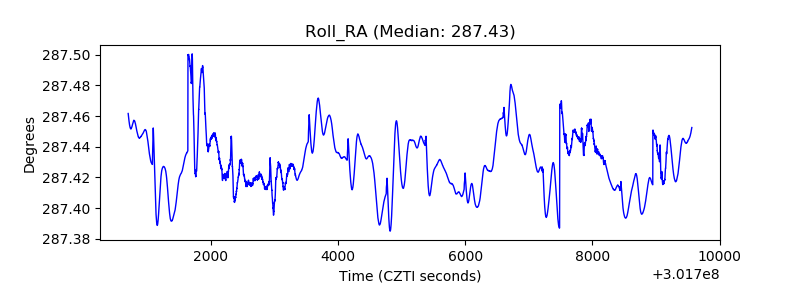 |
| Veto Counter | 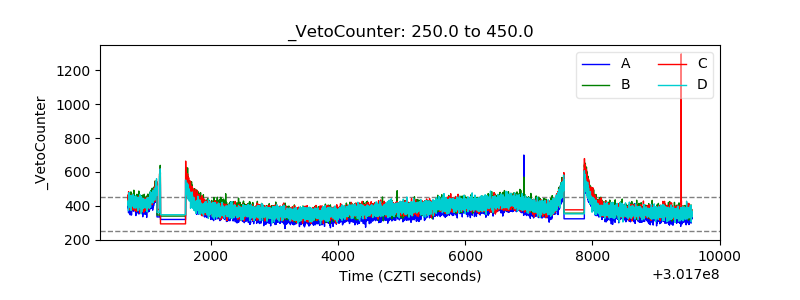 |