| Param | Original file | Final file |
|---|---|---|
| Filename | modeM0/AS1A05_022T09_9000003058_20661cztM0_level2.evt | modeM0/AS1A05_022T09_9000003058_20661cztM0_level2_quad_clean.evt |
| Size (bytes) | 546,341,760 | 135,691,200 |
| Size | 521.0 MB | 129.4 MB |
| Events in quadrant A | 3,651,676 | 902,823 |
| Events in quadrant B | 4,128,342 | 900,021 |
| Events in quadrant C | 3,696,595 | 887,032 |
| Events in quadrant D | 4,524,314 | 862,200 |
| Mode M0 | |||
|---|---|---|---|
| Quadrant | BADHDUFLAG | Total packets | Discarded packets |
| A | 0 | 16430 | 2 |
| B | 0 | 17742 | 2 |
| C | 0 | 16328 | 2 |
| D | 0 | 19215 | 2 |
| Mode M9 | |||
|---|---|---|---|
| Quadrant | BADHDUFLAG | Total packets | Discarded packets |
| A | 0 | 8 | 0 |
| B | 0 | 8 | 0 |
| C | 0 | 8 | 0 |
| D | 0 | 8 | 0 |
| Mode SS | |||
|---|---|---|---|
| Quadrant | BADHDUFLAG | Total packets | Discarded packets |
| A | 0 | 164 | 0 |
| B | 0 | 164 | 0 |
| C | 0 | 164 | 0 |
| D | 0 | 164 | 0 |
| Quadrant | Total seconds | Saturated seconds | Saturation percentage |
|---|---|---|---|
| A | 8026 | 56 | 0.697732% |
| B | 8027 | 181 | 2.254890% |
| C | 8027 | 105 | 1.308085% |
| D | 8027 | 311 | 3.874424% |
Noise dominated data is calculated using 1-second bins in cleaned event files. If a bin has >2000 counts, and if more than 50% of those come from <1% of pixels, then it is considered to be noise-dominated and hence unusable.
| Quadrant | # 1 sec bins | Bins with >0 counts | Bins with >2000 counts | High rate bins dominated by noise | Noise dominated (total time) | Noise dominated (detector-on time) | Marked lightcurve |
|---|---|---|---|---|---|---|---|
| A | 8816 | 8028 | 5 | 5 | 0.06% | 0.06% | 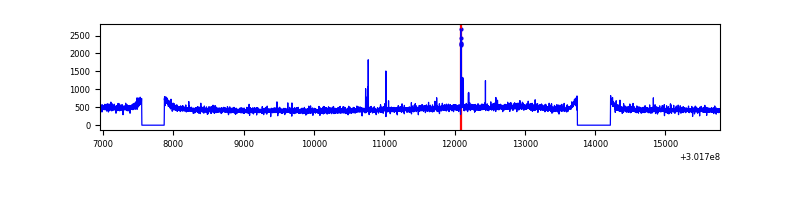 |
| B | 8817 | 8029 | 46 | 46 | 0.52% | 0.57% | 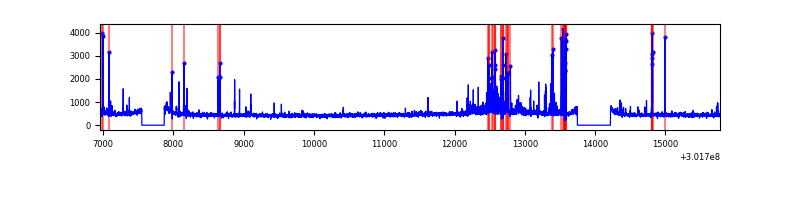 |
| C | 8817 | 8029 | 0 | 0 | 0.00% | 0.00% | 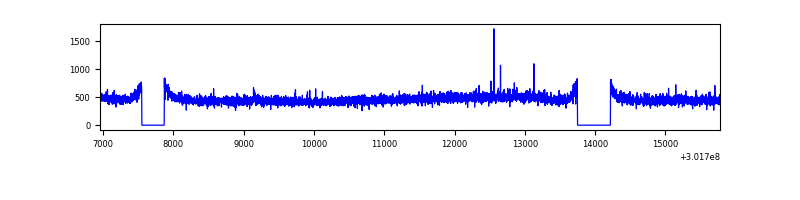 |
| D | 8817 | 8029 | 196 | 196 | 2.22% | 2.44% | 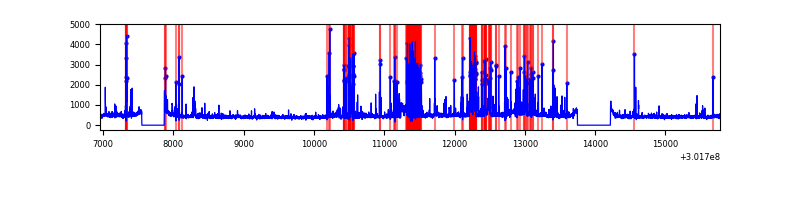 |
Top three noisy pixels from each quadrant. If the there are fewer than three noisy pixels in the level2.evt file, extra rows are filled as -1
| Pixel properties | Quadrant properties | ||||||
|---|---|---|---|---|---|---|---|
| Quadrant | DetID | PixID | Counts | Sigma | Mean | Median | Sigma |
| A | 5 | 16 | 40609 | 209.42 | 935 | 912 | 189.6 |
| A | 8 | 205 | 12952 | 63.52 | 935 | 912 | 189.6 |
| A | 0 | 226 | 8088 | 37.86 | 935 | 912 | 189.6 |
| B | 7 | 220 | 301984 | 1715.19 | 931 | 906 | 175.5 |
| B | 3 | 64 | 61713 | 346.41 | 931 | 906 | 175.5 |
| B | 12 | 111 | 21397 | 116.73 | 931 | 906 | 175.5 |
| C | 14 | 238 | 141520 | 661.8 | 903 | 907 | 212.5 |
| C | 7 | 247 | 21231 | 95.66 | 903 | 907 | 212.5 |
| C | 13 | 61 | 6254 | 25.17 | 903 | 907 | 212.5 |
| D | 1 | 52 | 631624 | 2903.17 | 897 | 869 | 217.3 |
| D | 2 | 165 | 232035 | 1063.98 | 897 | 869 | 217.3 |
| D | 13 | 153 | 70596 | 320.93 | 897 | 869 | 217.3 |
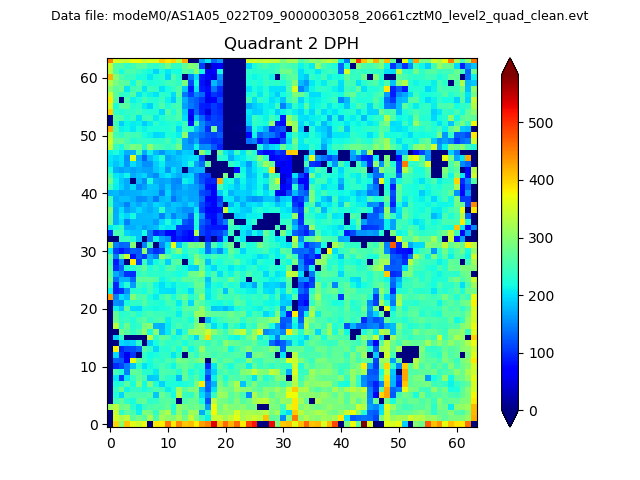
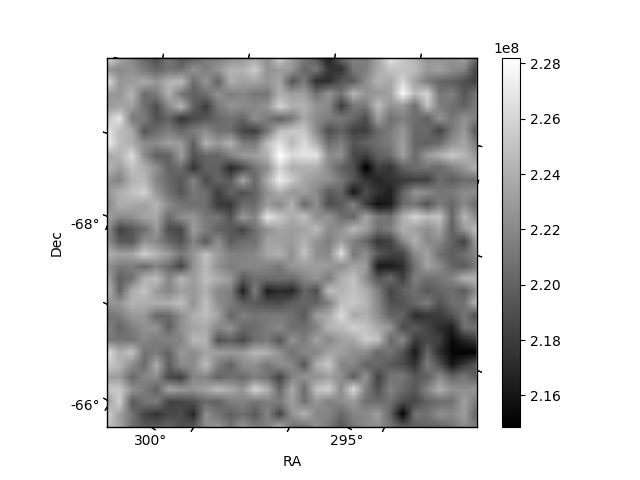
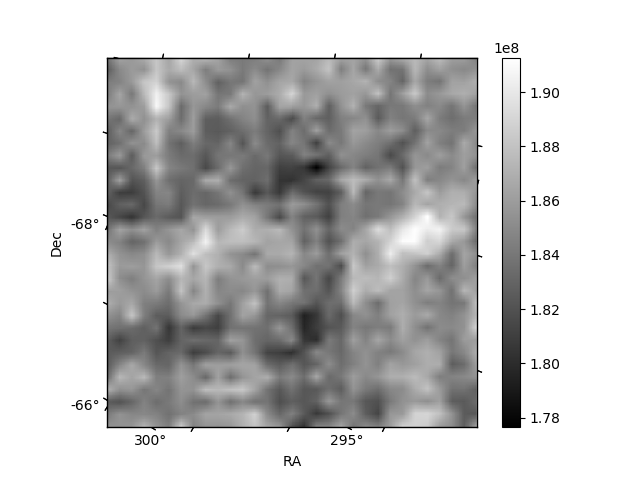
Histogram calculated using DETX and DETY for each event in the final _common_clean file
| Quadrant A | 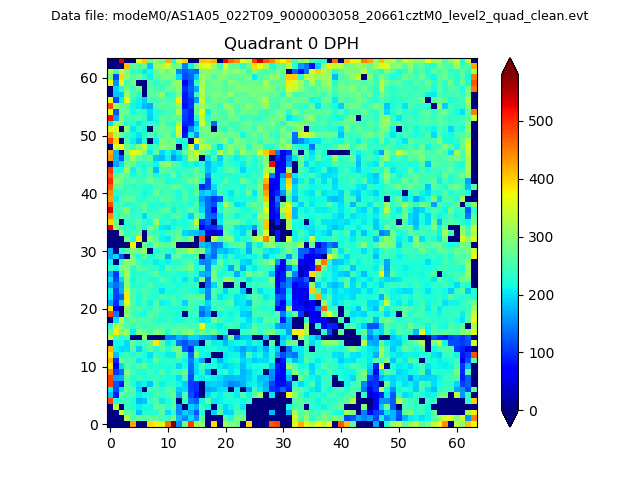 |
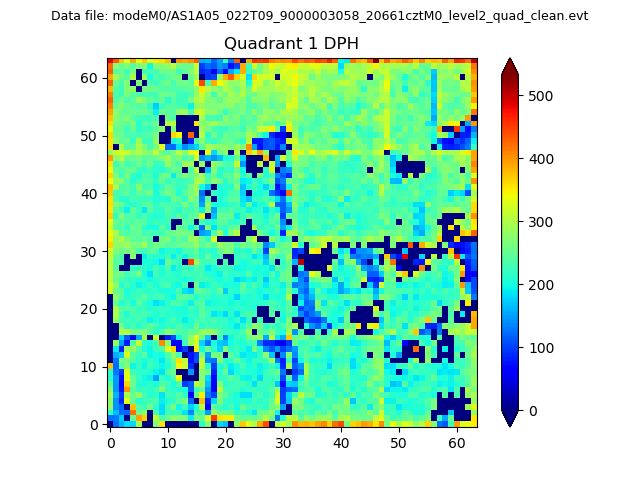 |
Quadrant B |
|---|---|---|---|
| Quadrant D | 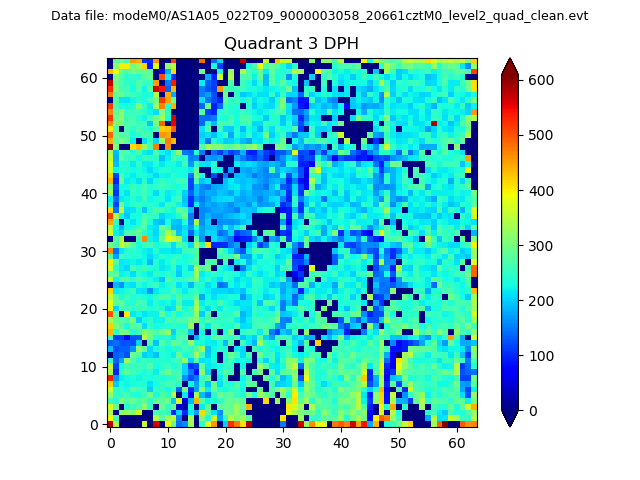 |
 |
Quadrant C |
| Plot type | Count rate plots | Images |
|---|---|---|
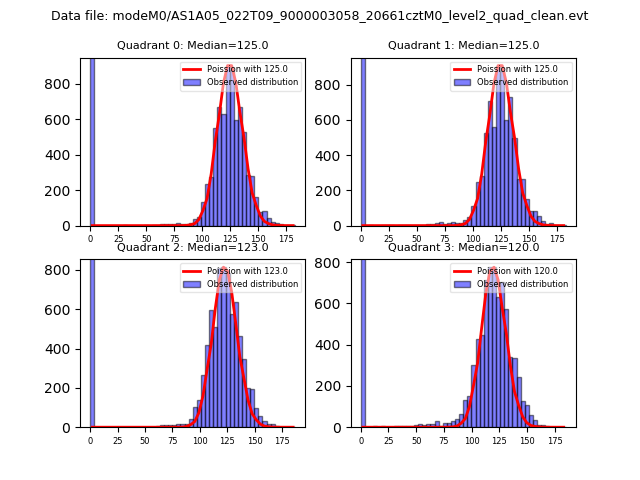
| Comparison with Poisson distribution Blue bars denote a histogram of data divided into 1 sec bins. Red curve is a Poisson curve with rate = median count rate of data. |
 |
 |
| Quadrant-wise count rates Data is divided into 100 sec bins |
 |
|
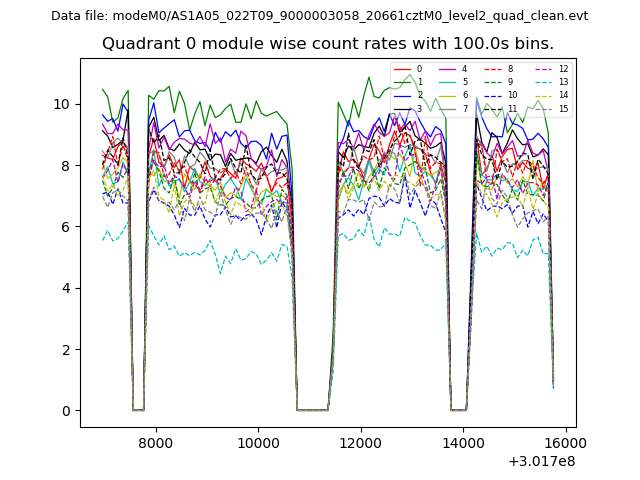
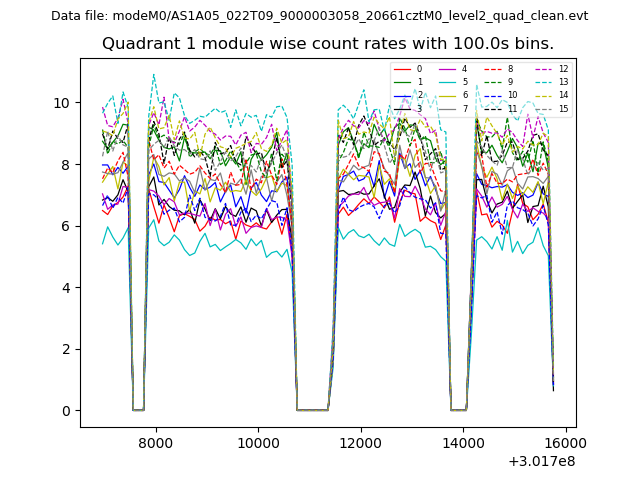
| Module-wise count rates for Quadrant A Data is divided into 100 sec bins |
 |
 |
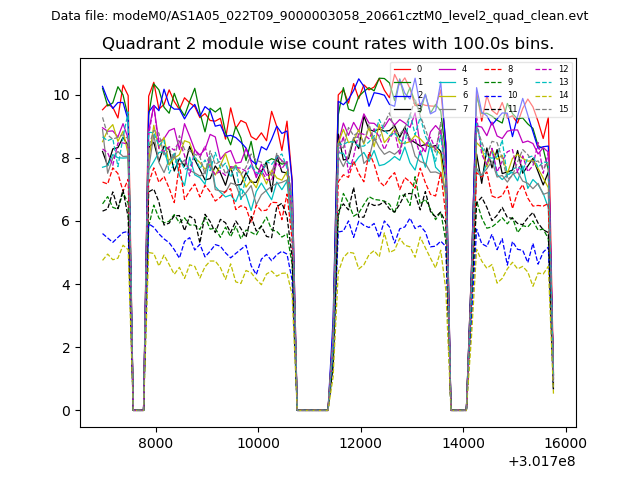
| Module-wise count rates for Quadrant B Data is divided into 100 sec bins |
 |
 |
| Module-wise count rates for Quadrant C Data is divided into 100 sec bins |
 |
 |
| Module-wise count rates for Quadrant D Data is divided into 100 sec bins |
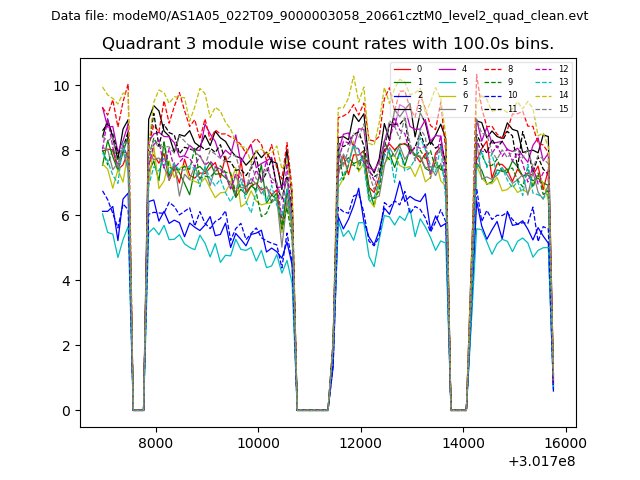 |
 |
| Parameter | Plot |
|---|---|
| CZT HV Monitor | 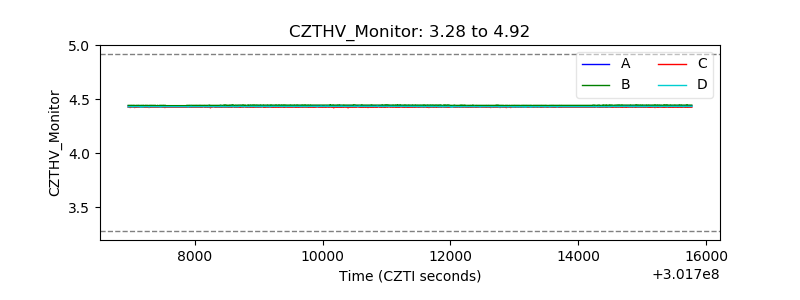 |
| D_VDD | 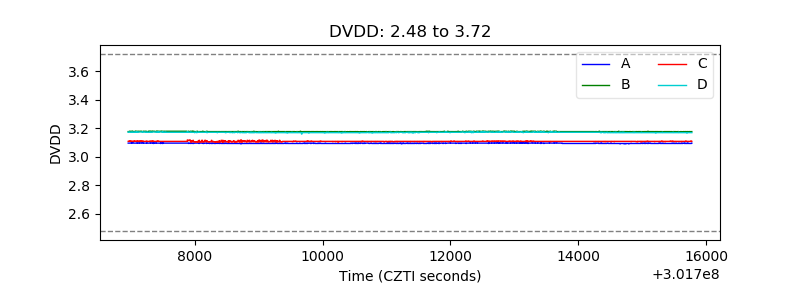 |
| Temperature 1 | 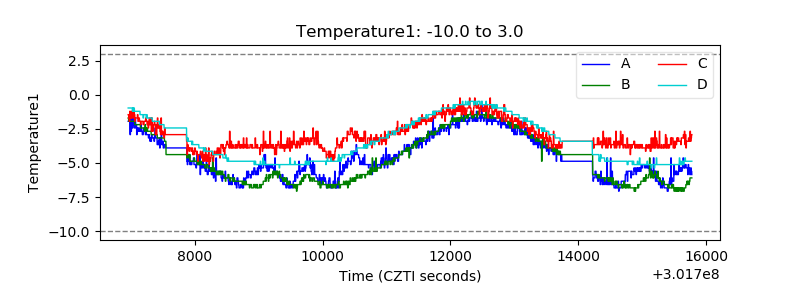 |
| Veto HV Monitor | 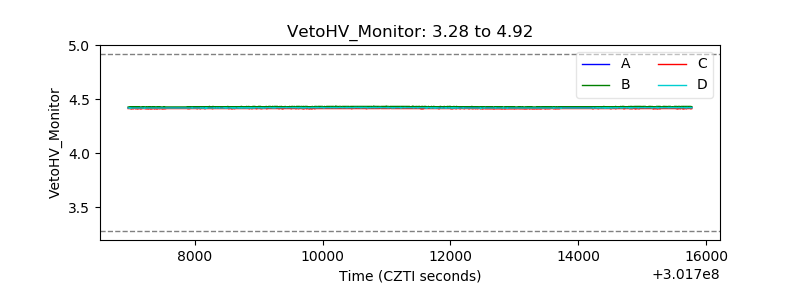 |
| Veto LLD | 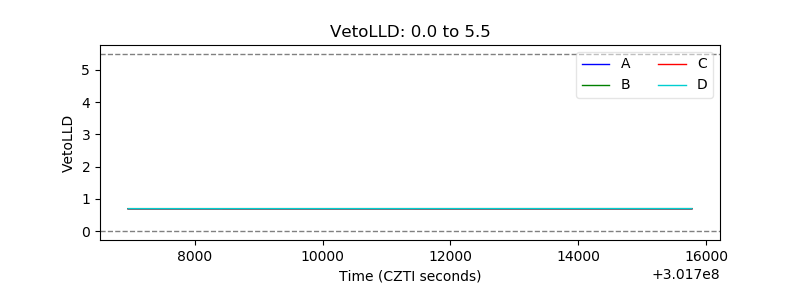 |
| Alpha Counter |  |
| _CPM_Rate | 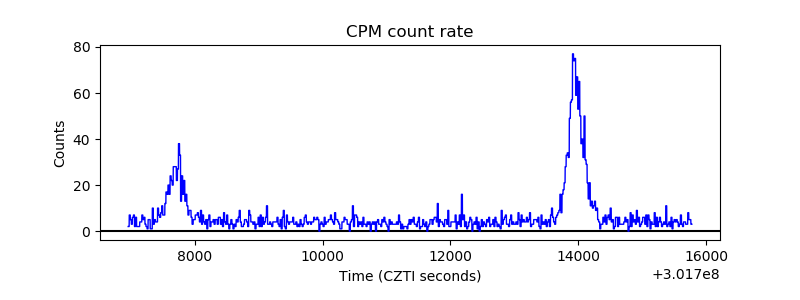 |
| CZT Counter | 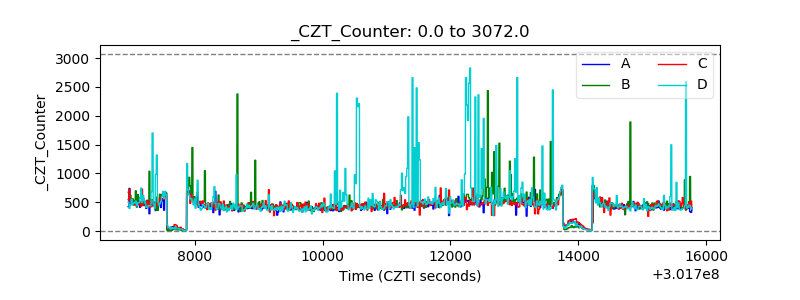 |
| +2.5 Volts monitor |  |
| +5 Volts monitor |  |
| _ROLL_ROT | 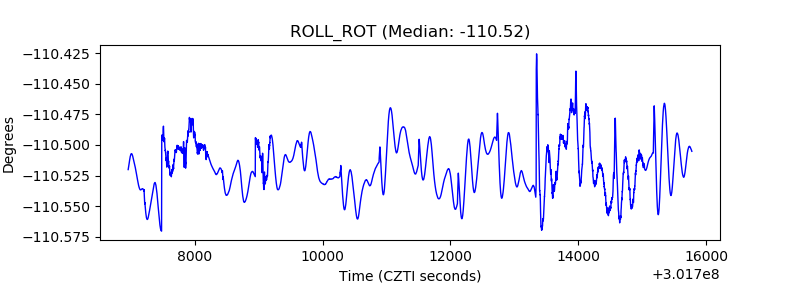 |
| _Roll_DEC | 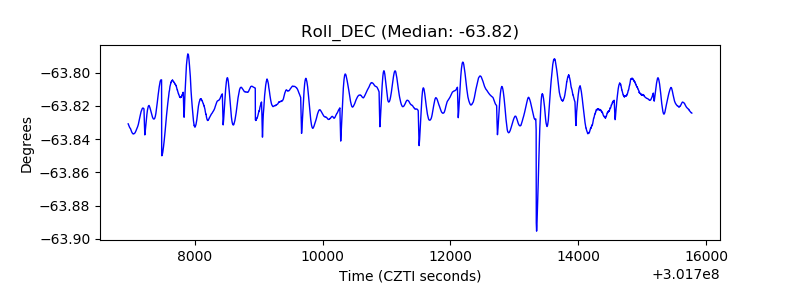 |
| _Roll_RA | 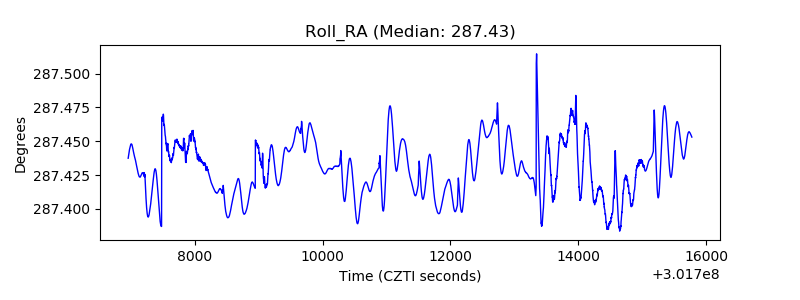 |
| Veto Counter | 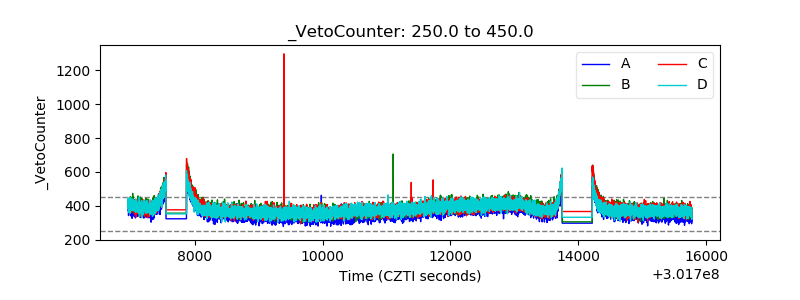 |