| Param | Original file | Final file |
|---|---|---|
| Filename | modeM0/AS1A05_103T06_9000003056cztM0_level2.fits | modeM0/AS1A05_103T06_9000003056cztM0_level2_quad_clean.evt |
| Size (bytes) | 141,940,800 | 118,794,240 |
| Size | 135.4 MB | 113.3 MB |
| Events in quadrant A | 896,318 | 698,866 |
| Events in quadrant B | 847,844 | 689,870 |
| Events in quadrant C | 851,490 | 650,870 |
| Events in quadrant D | 749,732 | 603,416 |
| Mode M9 | |||
|---|---|---|---|
| Quadrant | BADHDUFLAG | Total packets | Discarded packets |
| A | 0 | 36 | 0 |
| B | 0 | 36 | 0 |
| C | 0 | 36 | 0 |
| D | 0 | 36 | 0 |
| Mode M0 | |||
|---|---|---|---|
| Quadrant | BADHDUFLAG | Total packets | Discarded packets |
| A | 0 | 29250 | 0 |
| B | 0 | 29896 | 0 |
| C | 0 | 29113 | 0 |
| D | 0 | 37497 | 0 |
| Mode SS | |||
|---|---|---|---|
| Quadrant | BADHDUFLAG | Total packets | Discarded packets |
| A | 0 | 284 | 0 |
| B | 0 | 284 | 0 |
| C | 0 | 284 | 0 |
| D | 0 | 284 | 0 |
| Quadrant | Total seconds | Saturated seconds | Saturation percentage |
|---|---|---|---|
| A | 13802 | 214 | 1.550500% |
| B | 13801 | 210 | 1.521629% |
| C | 13802 | 258 | 1.869294% |
| D | 13802 | 332 | 2.405448% |
Noise dominated data is calculated using 1-second bins in cleaned event files. If a bin has >2000 counts, and if more than 50% of those come from <1% of pixels, then it is considered to be noise-dominated and hence unusable.
| Quadrant | # 1 sec bins | Bins with >0 counts | Bins with >2000 counts | High rate bins dominated by noise | Noise dominated (total time) | Noise dominated (detector-on time) | Marked lightcurve |
|---|---|---|---|---|---|---|---|
| A | 17512 | 13802 | 0 | 0 | 0.00% | 0.00% |  |
| B | 17512 | 13802 | 0 | 0 | 0.00% | 0.00% |  |
| C | 17512 | 13802 | 0 | 0 | 0.00% | 0.00% |  |
| D | 17512 | 13801 | 0 | 0 | 0.00% | 0.00% |  |
Top three noisy pixels from each quadrant. If the there are fewer than three noisy pixels in the level2.evt file, extra rows are filled as -1
| Pixel properties | Quadrant properties | ||||||
|---|---|---|---|---|---|---|---|
| Quadrant | DetID | PixID | Counts | Sigma | Mean | Median | Sigma |
| A | 0 | 29 | 862 | 10.92 | 233 | 220 | 58.8 |
| A | 7 | 110 | 734 | 8.74 | 233 | 220 | 58.8 |
| A | 0 | 30 | 695 | 8.08 | 233 | 220 | 58.8 |
| B | 2 | 9 | 659 | 9.75 | 224 | 215 | 45.5 |
| B | 5 | 232 | 555 | 7.47 | 224 | 215 | 45.5 |
| B | 10 | 128 | 532 | 6.96 | 224 | 215 | 45.5 |
| C | 1 | 81 | 661 | 7.63 | 224 | 211 | 59.0 |
| C | 1 | 80 | 661 | 7.63 | 224 | 211 | 59.0 |
| C | 9 | 209 | 594 | 6.49 | 224 | 211 | 59.0 |
| D | 6 | 67 | 531 | 5.7 | 213 | 195 | 58.9 |
| D | 10 | 189 | 528 | 5.65 | 213 | 195 | 58.9 |
| D | 6 | 231 | 528 | 5.65 | 213 | 195 | 58.9 |
Histogram calculated using DETX and DETY for each event in the final _common_clean file
| Quadrant A |  |
 |
Quadrant B |
|---|---|---|---|
| Quadrant D |  |
 |
Quadrant C |
| Plot type | Count rate plots | Images |
|---|---|---|
| Comparison with Poisson distribution Blue bars denote a histogram of data divided into 1 sec bins. Red curve is a Poisson curve with rate = median count rate of data. |
 |
 |
| Quadrant-wise count rates Data is divided into 100 sec bins |
 |
|
| Module-wise count rates for Quadrant A Data is divided into 100 sec bins |
 |
 |
| Module-wise count rates for Quadrant B Data is divided into 100 sec bins |
 |
 |
| Module-wise count rates for Quadrant C Data is divided into 100 sec bins |
 |
 |
| Module-wise count rates for Quadrant D Data is divided into 100 sec bins |
 |
 |
| Parameter | Plot |
|---|---|
| CZT HV Monitor |  |
| D_VDD | 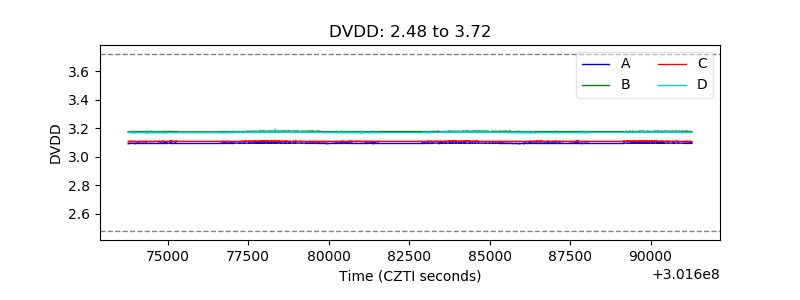 |
| Temperature 1 |  |
| Veto HV Monitor |  |
| Veto LLD |  |
| Alpha Counter |  |
| _CPM_Rate |  |
| CZT Counter |  |
| +2.5 Volts monitor |  |
| +5 Volts monitor |  |
| _ROLL_ROT |  |
| _Roll_DEC |  |
| _Roll_RA |  |
| Veto Counter |  |