| Param | Original file | Final file |
|---|---|---|
| Filename | modeM0/AS1A05_103T06_9000003056_20655cztM0_level2.evt | modeM0/AS1A05_103T06_9000003056_20655cztM0_level2_quad_clean.evt |
| Size (bytes) | 263,808,000 | 54,849,600 |
| Size | 251.6 MB | 52.3 MB |
| Events in quadrant A | 1,702,895 | 372,578 |
| Events in quadrant B | 1,789,015 | 372,232 |
| Events in quadrant C | 1,691,831 | 349,580 |
| Events in quadrant D | 2,586,324 | 338,307 |
| Mode M9 | |||
|---|---|---|---|
| Quadrant | BADHDUFLAG | Total packets | Discarded packets |
| A | 0 | 13 | 0 |
| B | 0 | 13 | 0 |
| C | 0 | 13 | 0 |
| D | 0 | 13 | 0 |
| Mode M0 | |||
|---|---|---|---|
| Quadrant | BADHDUFLAG | Total packets | Discarded packets |
| A | 0 | 7085 | 1 |
| B | 0 | 7373 | 3 |
| C | 0 | 7019 | 1 |
| D | 0 | 9955 | 3 |
| Mode SS | |||
|---|---|---|---|
| Quadrant | BADHDUFLAG | Total packets | Discarded packets |
| A | 0 | 68 | 0 |
| B | 0 | 68 | 0 |
| C | 0 | 68 | 0 |
| D | 0 | 68 | 0 |
| Quadrant | Total seconds | Saturated seconds | Saturation percentage |
|---|---|---|---|
| A | 3202 | 68 | 2.123673% |
| B | 3201 | 67 | 2.093096% |
| C | 3202 | 81 | 2.529669% |
| D | 3201 | 157 | 4.904717% |
Noise dominated data is calculated using 1-second bins in cleaned event files. If a bin has >2000 counts, and if more than 50% of those come from <1% of pixels, then it is considered to be noise-dominated and hence unusable.
| Quadrant | # 1 sec bins | Bins with >0 counts | Bins with >2000 counts | High rate bins dominated by noise | Noise dominated (total time) | Noise dominated (detector-on time) | Marked lightcurve |
|---|---|---|---|---|---|---|---|
| A | 4542 | 3203 | 0 | 0 | 0.00% | 0.00% | 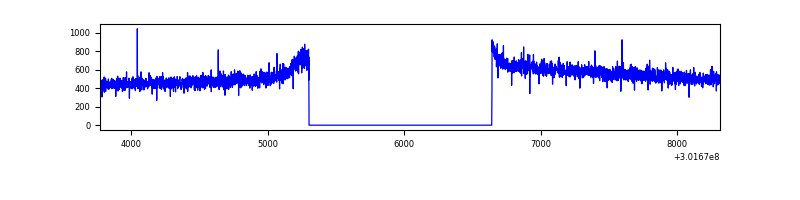 |
| B | 4542 | 3203 | 0 | 0 | 0.00% | 0.00% | 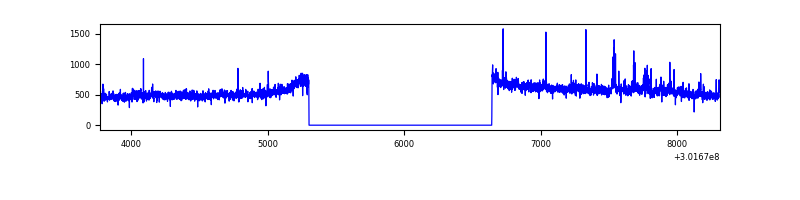 |
| C | 4542 | 3203 | 0 | 0 | 0.00% | 0.00% | 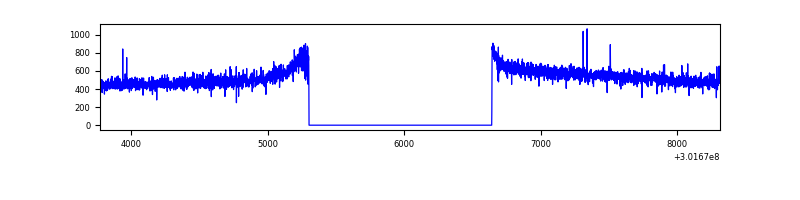 |
| D | 4541 | 3202 | 88 | 88 | 1.94% | 2.75% | 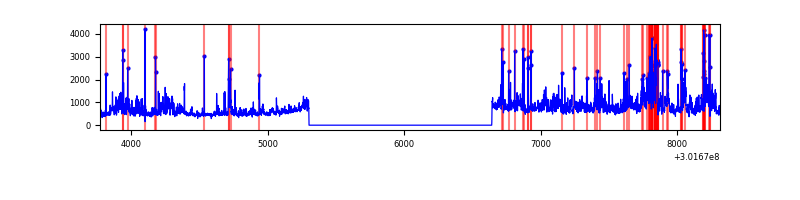 |
Top three noisy pixels from each quadrant. If the there are fewer than three noisy pixels in the level2.evt file, extra rows are filled as -1
| Pixel properties | Quadrant properties | ||||||
|---|---|---|---|---|---|---|---|
| Quadrant | DetID | PixID | Counts | Sigma | Mean | Median | Sigma |
| A | 0 | 226 | 3934 | 38.67 | 442 | 433 | 90.5 |
| A | 13 | 210 | 3780 | 36.97 | 442 | 433 | 90.5 |
| A | 3 | 137 | 3372 | 32.46 | 442 | 433 | 90.5 |
| B | 4 | 216 | 14387 | 169.14 | 435 | 426 | 82.5 |
| B | 0 | 189 | 13989 | 164.32 | 435 | 426 | 82.5 |
| B | 6 | 36 | 10919 | 127.13 | 435 | 426 | 82.5 |
| C | 14 | 238 | 66061 | 677.36 | 413 | 415 | 96.9 |
| C | 7 | 247 | 6354 | 61.28 | 413 | 415 | 96.9 |
| C | 3 | 233 | 3780 | 34.72 | 413 | 415 | 96.9 |
| D | 1 | 52 | 472658 | 4592.89 | 419 | 408 | 102.8 |
| D | 1 | 239 | 408829 | 3972.12 | 419 | 408 | 102.8 |
| D | 13 | 153 | 65501 | 633.07 | 419 | 408 | 102.8 |
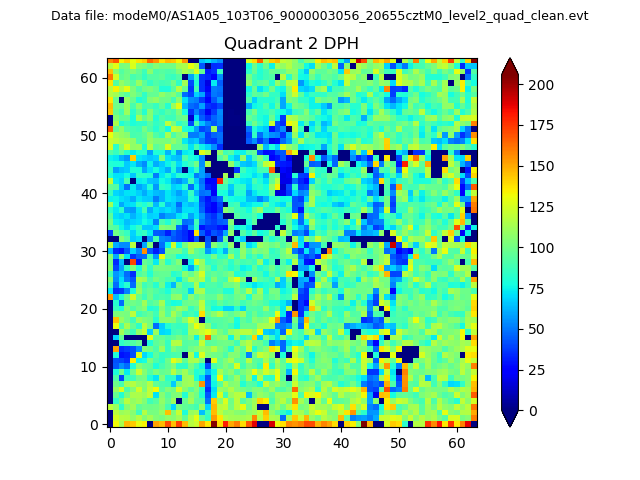
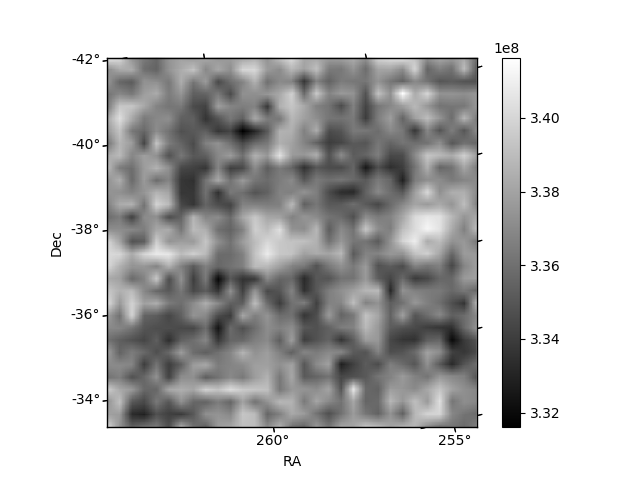
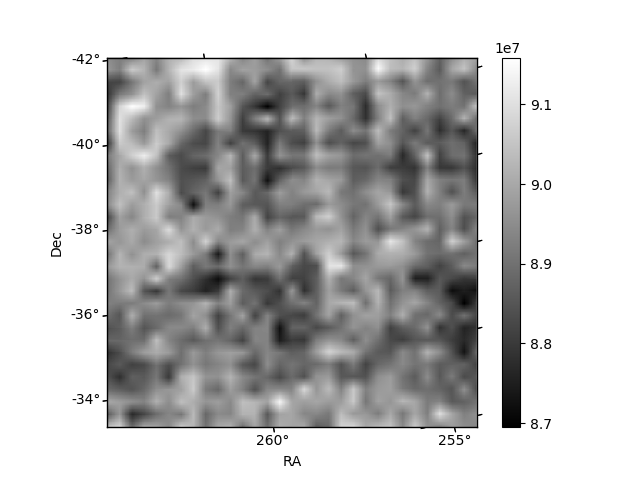
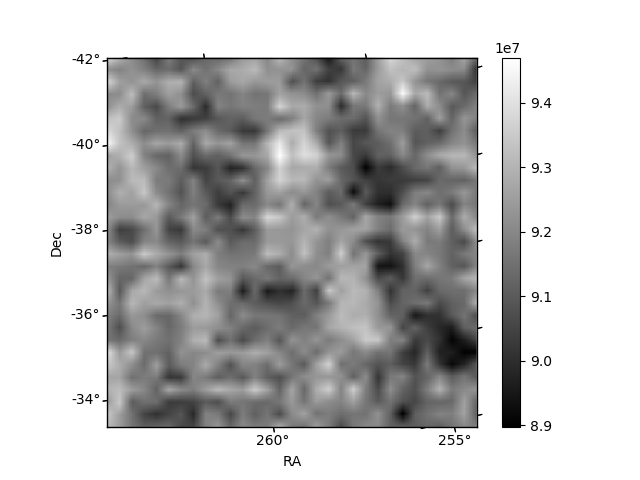
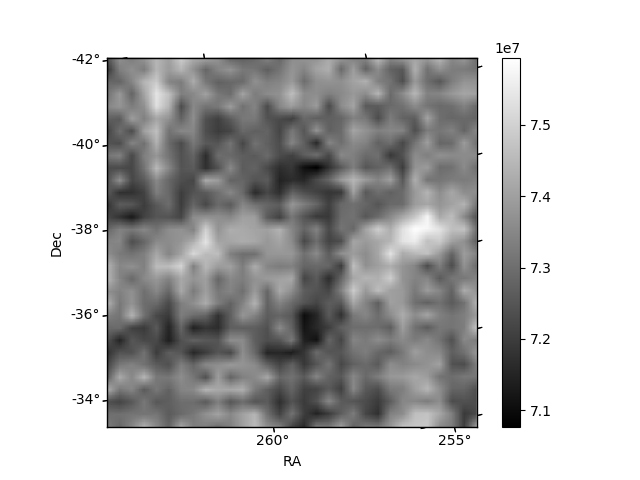
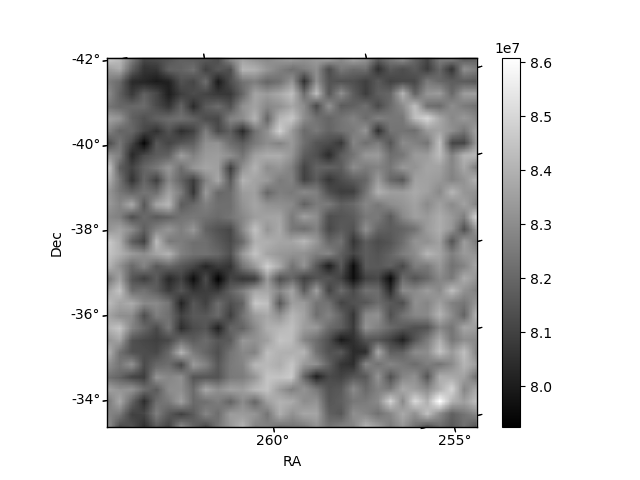
Histogram calculated using DETX and DETY for each event in the final _common_clean file
| Quadrant A | 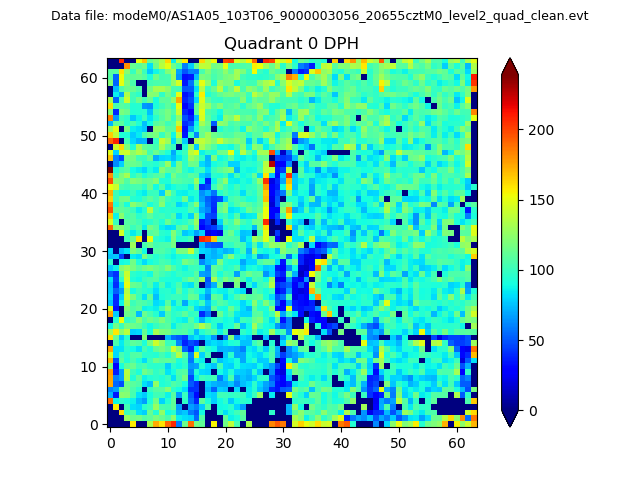 |
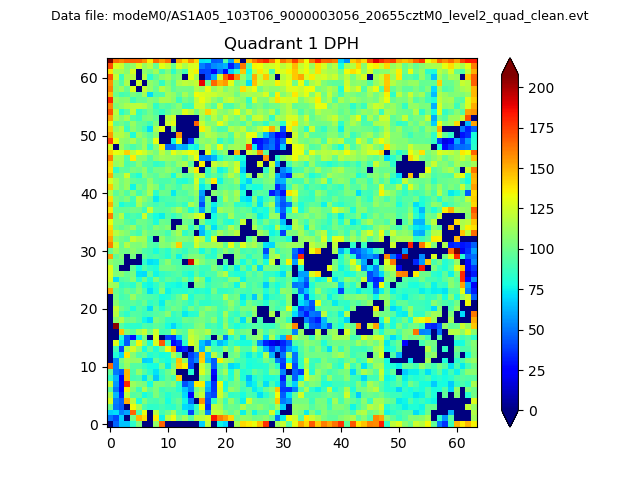 |
Quadrant B |
|---|---|---|---|
| Quadrant D | 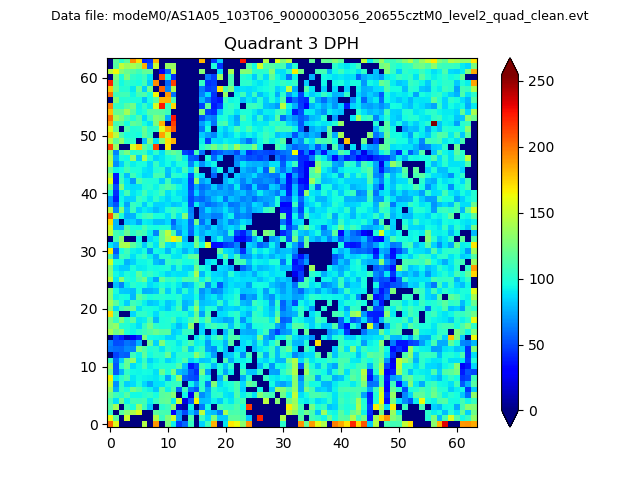 |
 |
Quadrant C |
| Plot type | Count rate plots | Images |
|---|---|---|
| Comparison with Poisson distribution Blue bars denote a histogram of data divided into 1 sec bins. Red curve is a Poisson curve with rate = median count rate of data. |
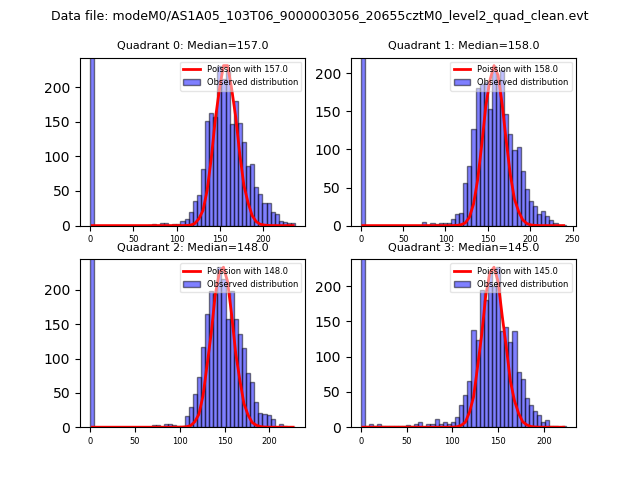 |
 |
| Quadrant-wise count rates Data is divided into 100 sec bins |
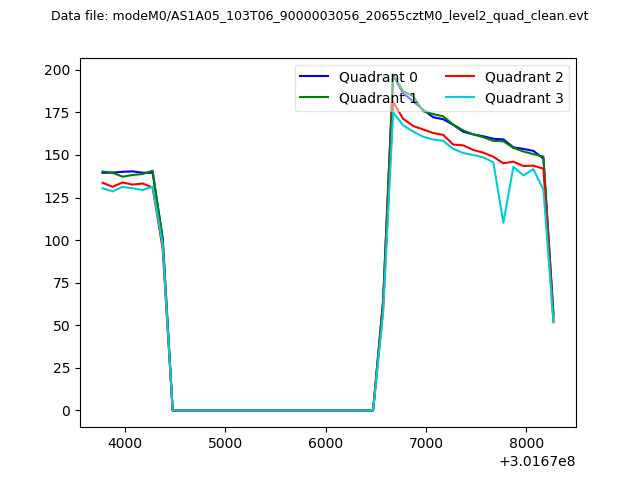 |
|
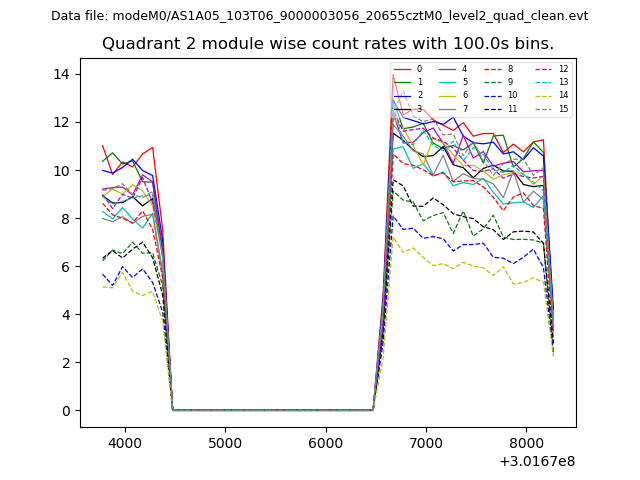
| Module-wise count rates for Quadrant A Data is divided into 100 sec bins |
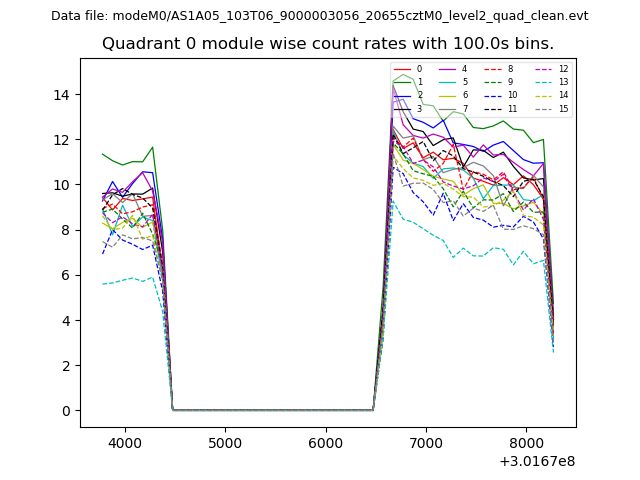 |
 |
| Module-wise count rates for Quadrant B Data is divided into 100 sec bins |
 |
 |
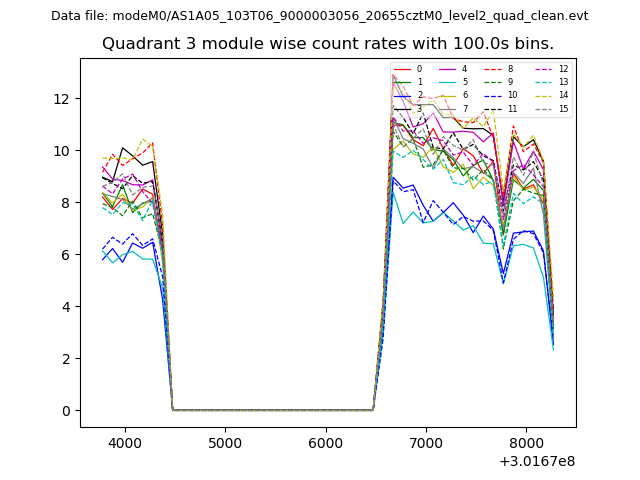
| Module-wise count rates for Quadrant C Data is divided into 100 sec bins |
 |
 |
| Module-wise count rates for Quadrant D Data is divided into 100 sec bins |
 |
 |
| Parameter | Plot |
|---|---|
| CZT HV Monitor | 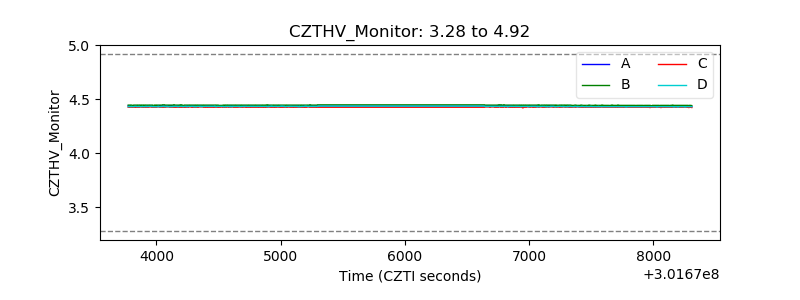 |
| D_VDD | 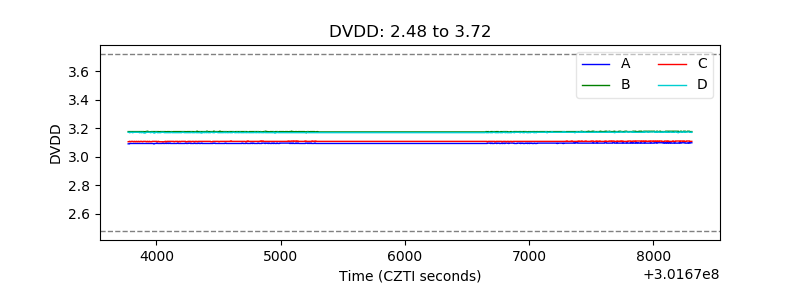 |
| Temperature 1 | 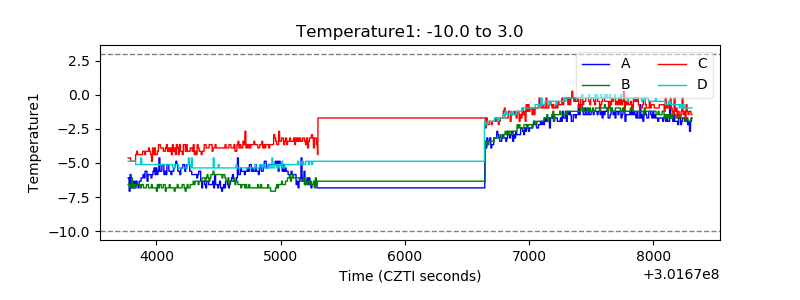 |
| Veto HV Monitor | 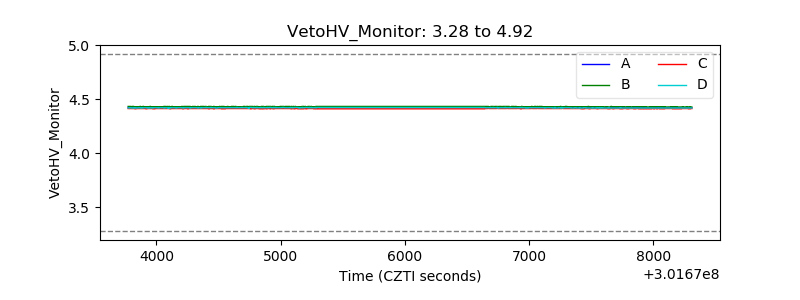 |
| Veto LLD | 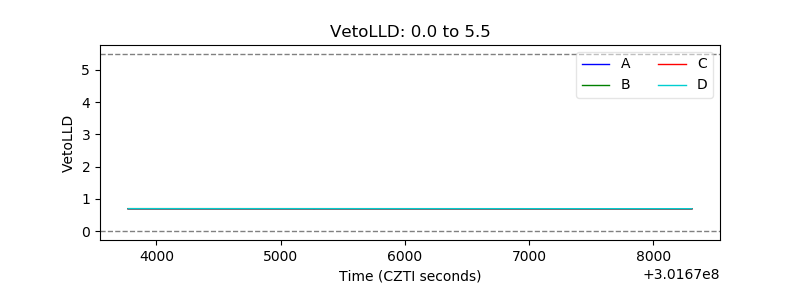 |
| Alpha Counter | 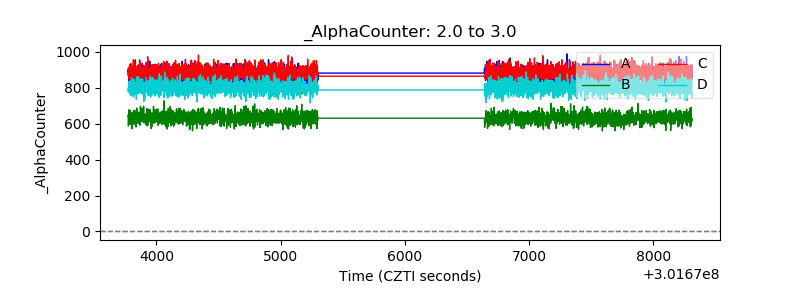 |
| _CPM_Rate | 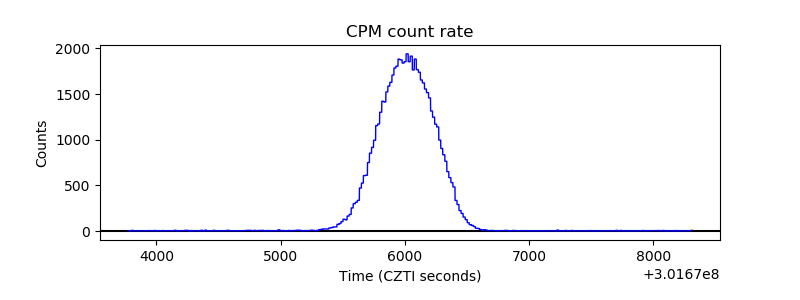 |
| CZT Counter | 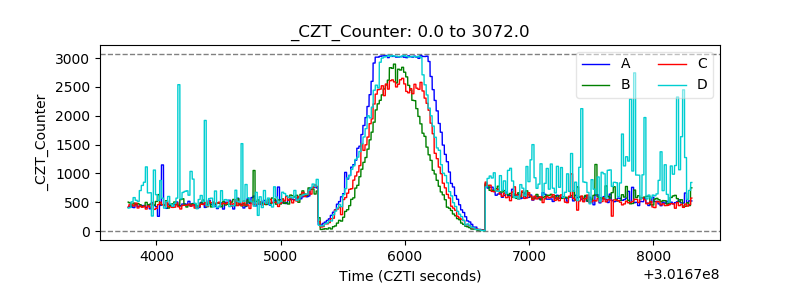 |
| +2.5 Volts monitor | 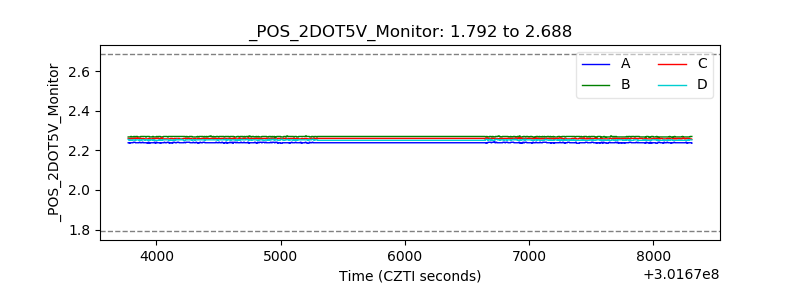 |
| +5 Volts monitor |  |
| _ROLL_ROT | 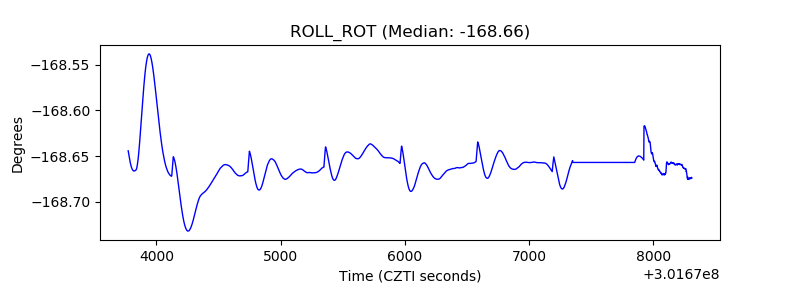 |
| _Roll_DEC | 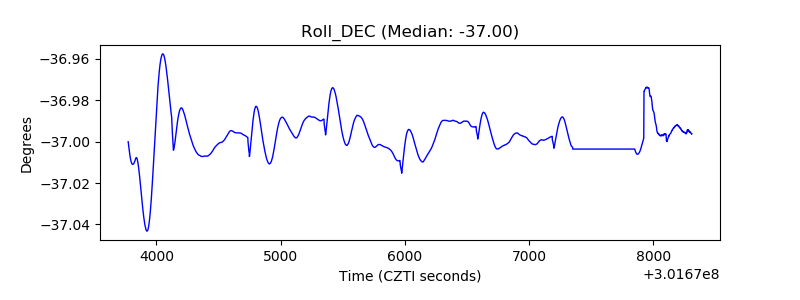 |
| _Roll_RA | 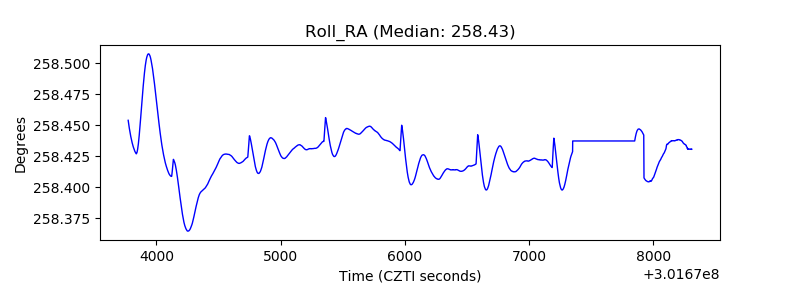 |
| Veto Counter | 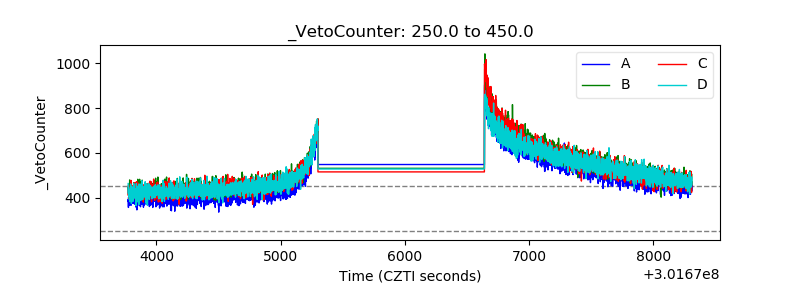 |