| Param | Original file | Final file |
|---|---|---|
| Filename | modeM0/AS1A05_103T06_9000003056_20658cztM0_level2.evt | modeM0/AS1A05_103T06_9000003056_20658cztM0_level2_quad_clean.evt |
| Size (bytes) | 147,064,320 | 42,511,680 |
| Size | 140.3 MB | 40.5 MB |
| Events in quadrant A | 1,012,880 | 290,758 |
| Events in quadrant B | 1,045,578 | 291,941 |
| Events in quadrant C | 984,242 | 278,088 |
| Events in quadrant D | 1,264,031 | 272,130 |
| Mode M9 | |||
|---|---|---|---|
| Quadrant | BADHDUFLAG | Total packets | Discarded packets |
| A | 0 | 1 | 0 |
| B | 0 | 2 | 0 |
| C | 0 | 2 | 0 |
| D | 0 | 2 | 0 |
| Mode M0 | |||
|---|---|---|---|
| Quadrant | BADHDUFLAG | Total packets | Discarded packets |
| A | 0 | 4393 | 1 |
| B | 0 | 4476 | 1 |
| C | 0 | 4369 | 1 |
| D | 0 | 5200 | 1 |
| Mode SS | |||
|---|---|---|---|
| Quadrant | BADHDUFLAG | Total packets | Discarded packets |
| A | 0 | 42 | 0 |
| B | 0 | 42 | 0 |
| C | 0 | 42 | 0 |
| D | 0 | 42 | 0 |
| Quadrant | Total seconds | Saturated seconds | Saturation percentage |
|---|---|---|---|
| A | 2130 | 8 | 0.375587% |
| B | 2130 | 4 | 0.187793% |
| C | 2130 | 9 | 0.422535% |
| D | 2130 | 16 | 0.751174% |
Noise dominated data is calculated using 1-second bins in cleaned event files. If a bin has >2000 counts, and if more than 50% of those come from <1% of pixels, then it is considered to be noise-dominated and hence unusable.
| Quadrant | # 1 sec bins | Bins with >0 counts | Bins with >2000 counts | High rate bins dominated by noise | Noise dominated (total time) | Noise dominated (detector-on time) | Marked lightcurve |
|---|---|---|---|---|---|---|---|
| A | 2130 | 2130 | 0 | 0 | 0.00% | 0.00% | 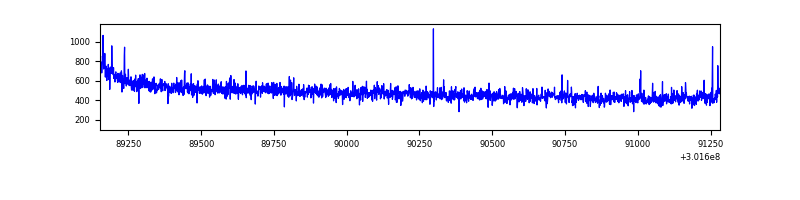 |
| B | 2130 | 2130 | 0 | 0 | 0.00% | 0.00% | 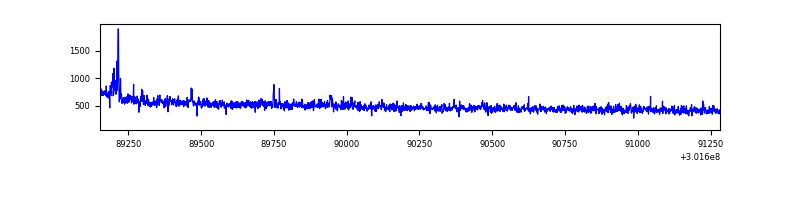 |
| C | 2130 | 2130 | 1 | 1 | 0.05% | 0.05% | 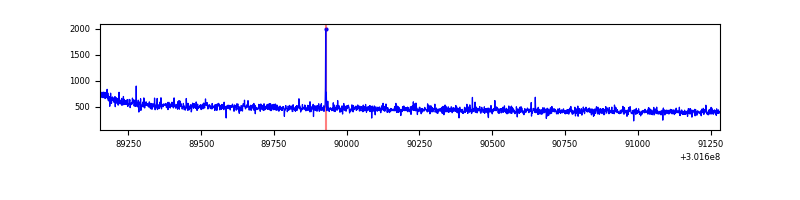 |
| D | 2130 | 2130 | 15 | 15 | 0.70% | 0.70% | 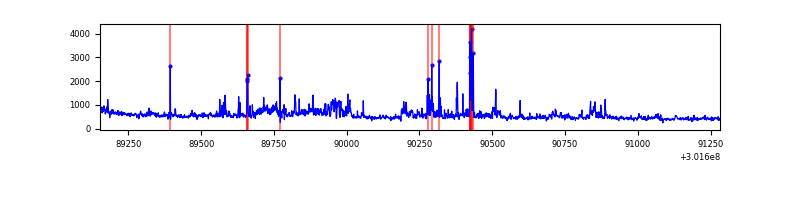 |
Top three noisy pixels from each quadrant. If the there are fewer than three noisy pixels in the level2.evt file, extra rows are filled as -1
| Pixel properties | Quadrant properties | ||||||
|---|---|---|---|---|---|---|---|
| Quadrant | DetID | PixID | Counts | Sigma | Mean | Median | Sigma |
| A | 13 | 210 | 6994 | 125.98 | 258 | 254 | 53.5 |
| A | 15 | 174 | 6185 | 110.86 | 258 | 254 | 53.5 |
| A | 5 | 16 | 4309 | 75.8 | 258 | 254 | 53.5 |
| B | 0 | 190 | 9497 | 183.29 | 256 | 250 | 50.4 |
| B | 6 | 36 | 8779 | 169.06 | 256 | 250 | 50.4 |
| B | 0 | 228 | 7973 | 153.08 | 256 | 250 | 50.4 |
| C | 14 | 238 | 38082 | 662.11 | 240 | 241 | 57.2 |
| C | 7 | 247 | 3889 | 63.83 | 240 | 241 | 57.2 |
| C | 0 | 207 | 3511 | 57.22 | 240 | 241 | 57.2 |
| D | 1 | 239 | 147537 | 2371.9 | 245 | 237 | 62.1 |
| D | 2 | 165 | 69269 | 1111.59 | 245 | 237 | 62.1 |
| D | 1 | 20 | 45141 | 723.07 | 245 | 237 | 62.1 |
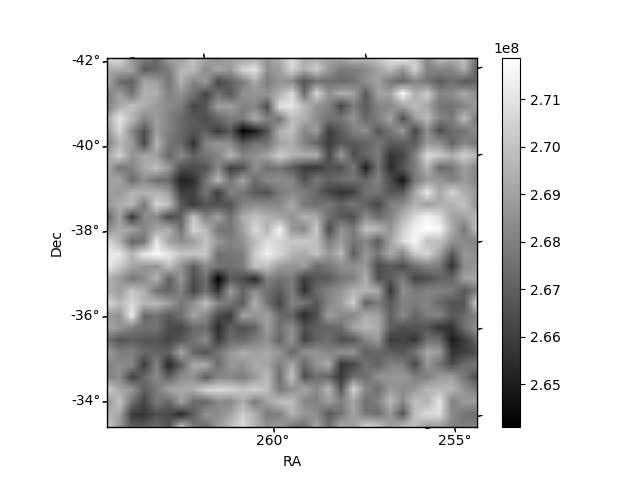
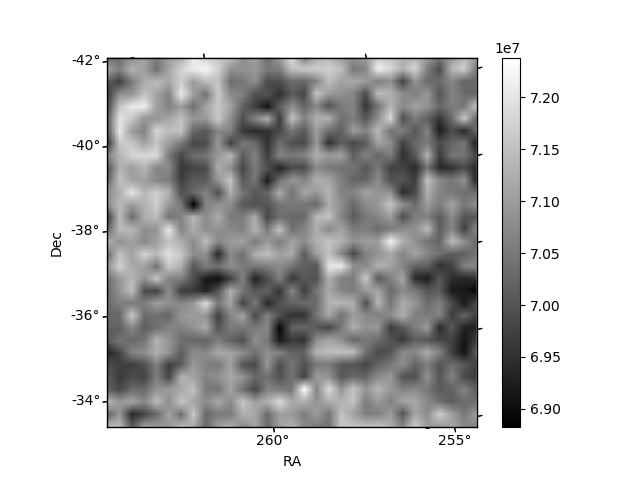
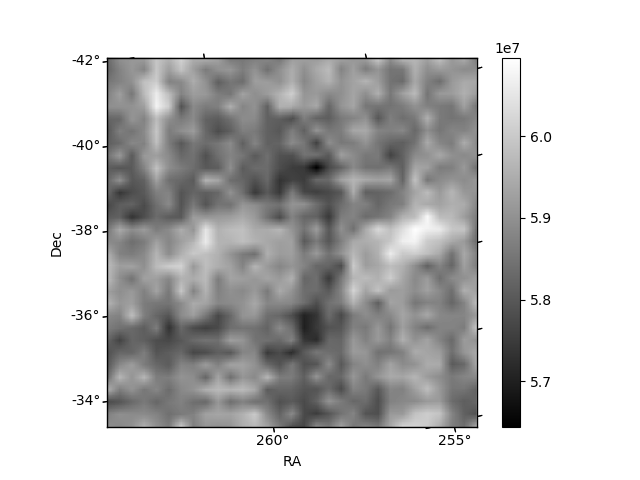
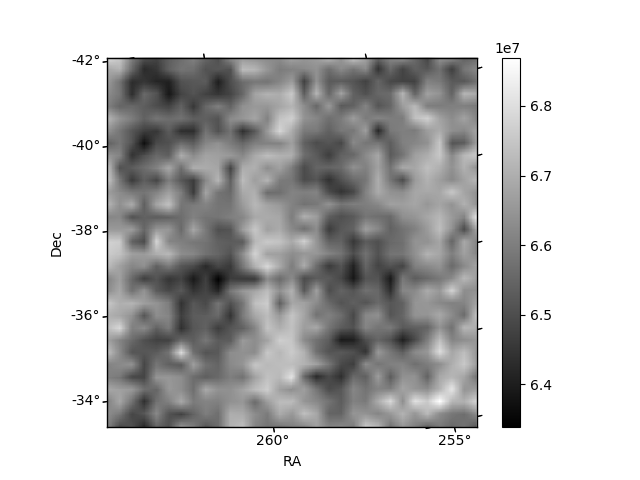
Histogram calculated using DETX and DETY for each event in the final _common_clean file
| Quadrant A | 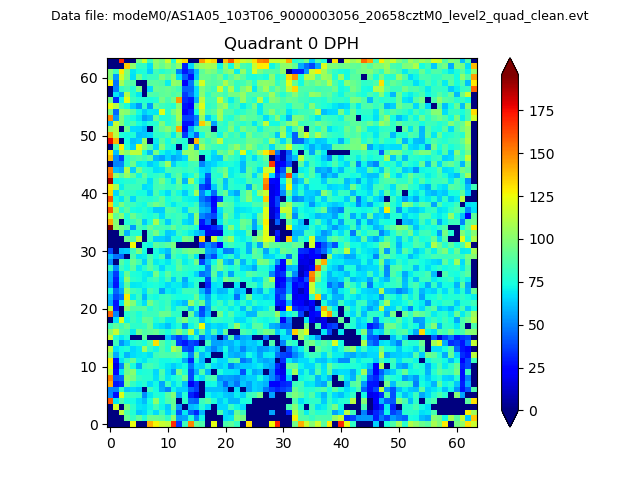 |
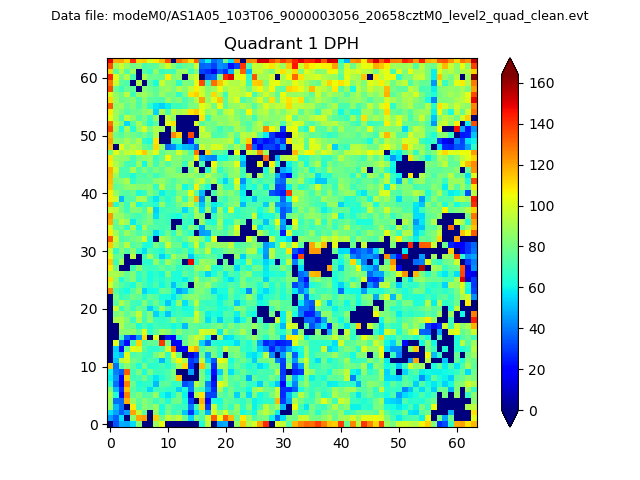 |
Quadrant B |
|---|---|---|---|
| Quadrant D | 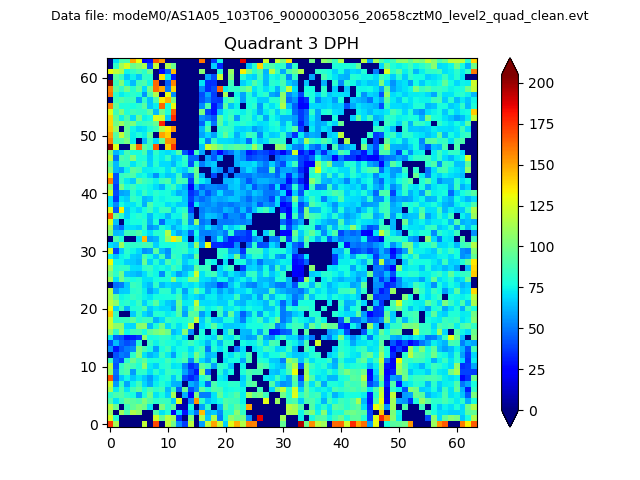 |
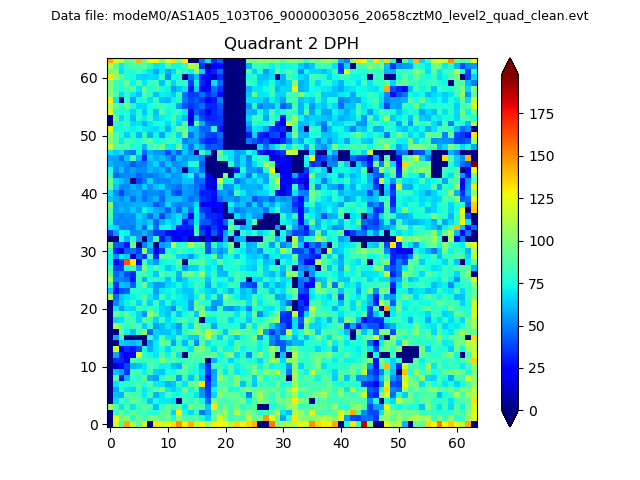 |
Quadrant C |
| Plot type | Count rate plots | Images |
|---|---|---|
| Comparison with Poisson distribution Blue bars denote a histogram of data divided into 1 sec bins. Red curve is a Poisson curve with rate = median count rate of data. |
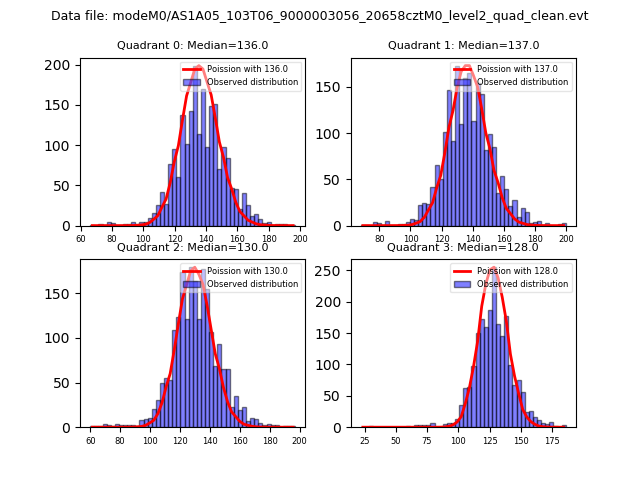 |
 |
| Quadrant-wise count rates Data is divided into 100 sec bins |
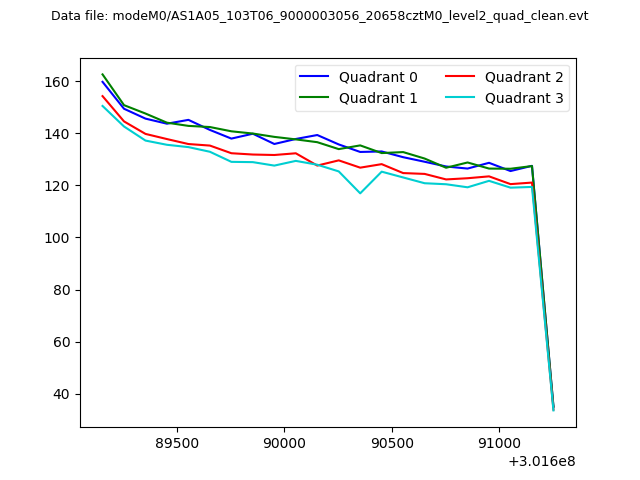 |
|
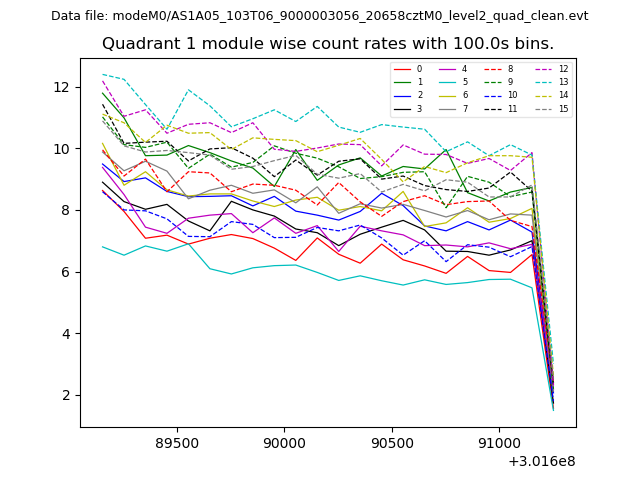
| Module-wise count rates for Quadrant A Data is divided into 100 sec bins |
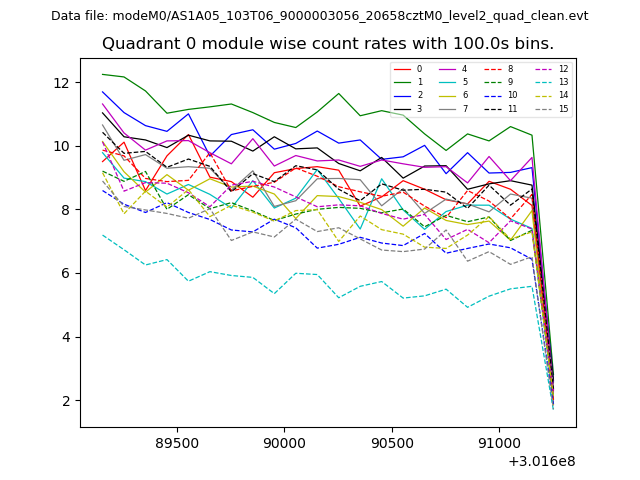 |
 |
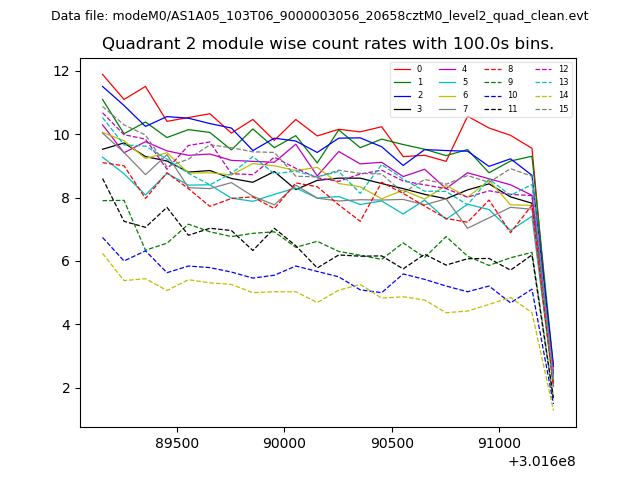
| Module-wise count rates for Quadrant B Data is divided into 100 sec bins |
 |
 |
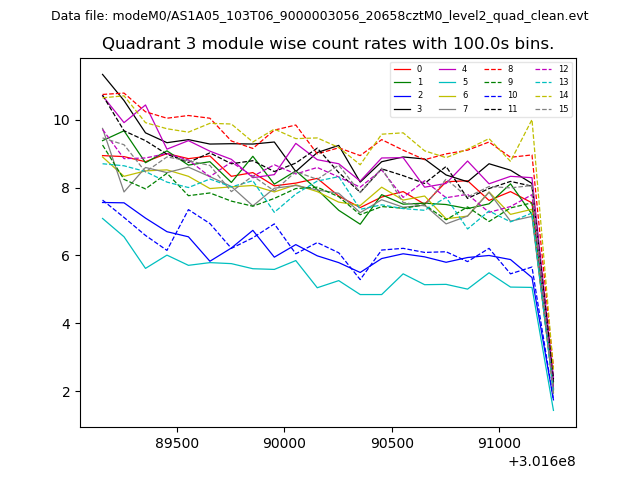
| Module-wise count rates for Quadrant C Data is divided into 100 sec bins |
 |
 |
| Module-wise count rates for Quadrant D Data is divided into 100 sec bins |
 |
 |
| Parameter | Plot |
|---|---|
| CZT HV Monitor | 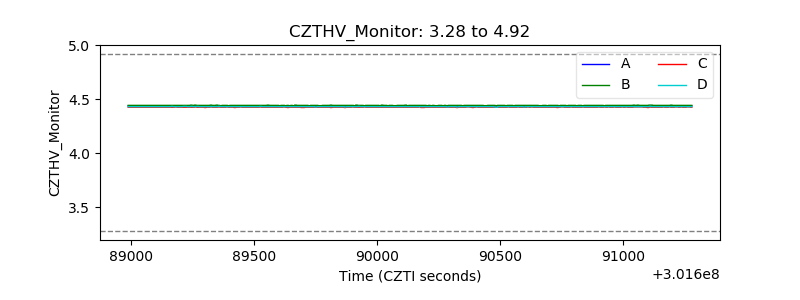 |
| D_VDD | 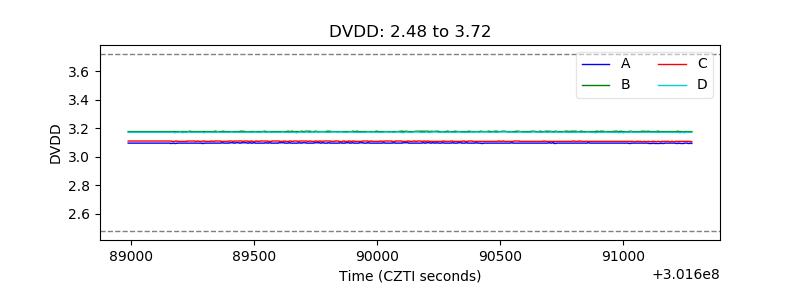 |
| Temperature 1 | 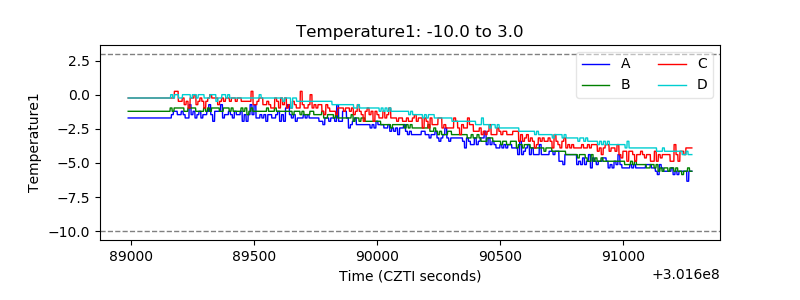 |
| Veto HV Monitor | 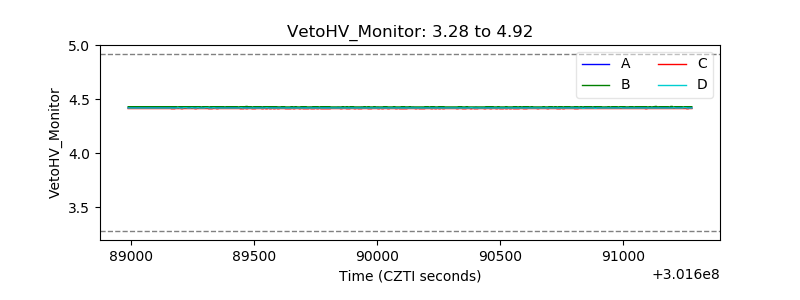 |
| Veto LLD | 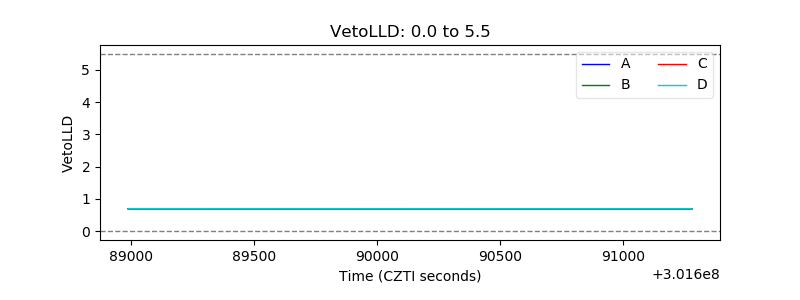 |
| Alpha Counter | 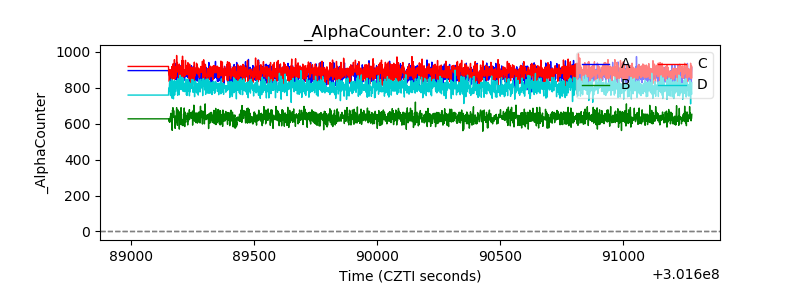 |
| _CPM_Rate | 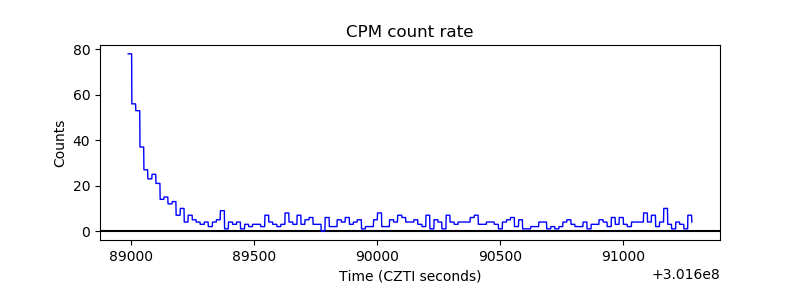 |
| CZT Counter | 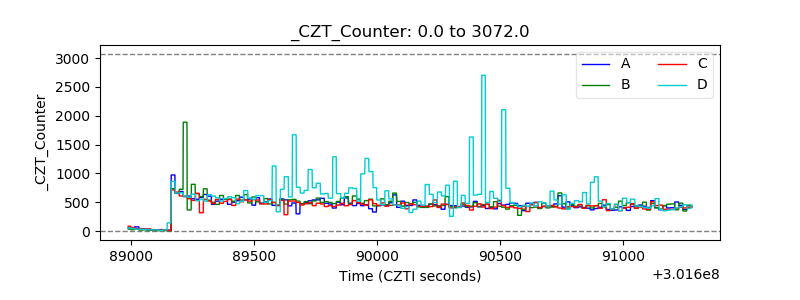 |
| +2.5 Volts monitor |  |
| +5 Volts monitor | 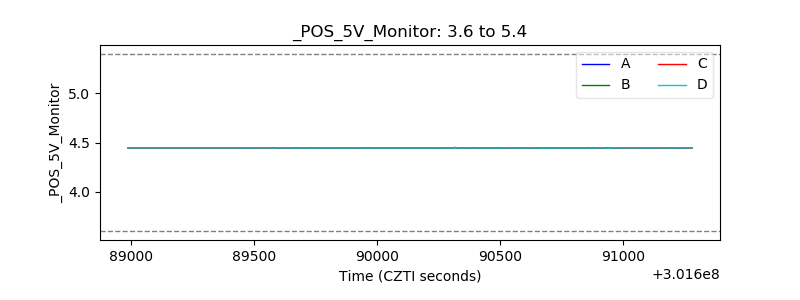 |
| _ROLL_ROT | 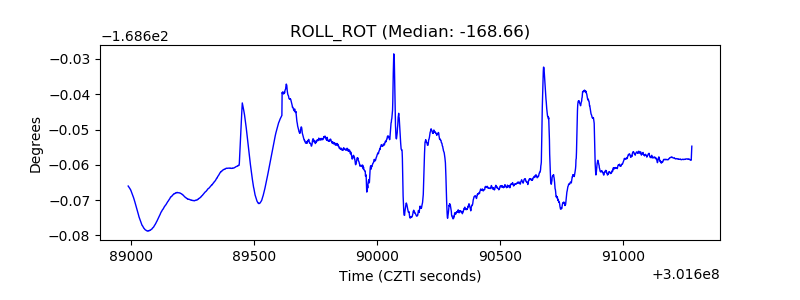 |
| _Roll_DEC | 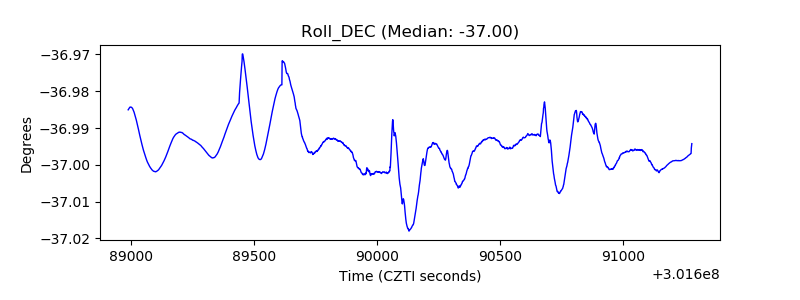 |
| _Roll_RA | 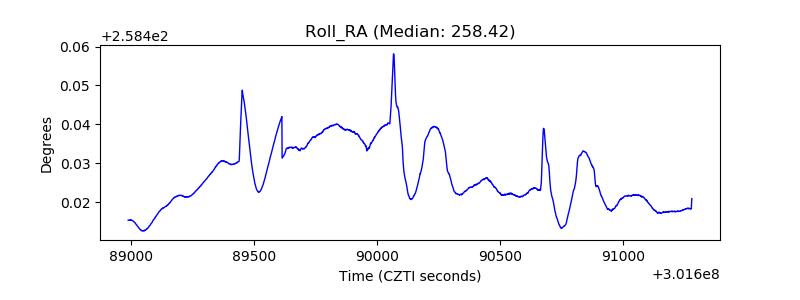 |
| Veto Counter | 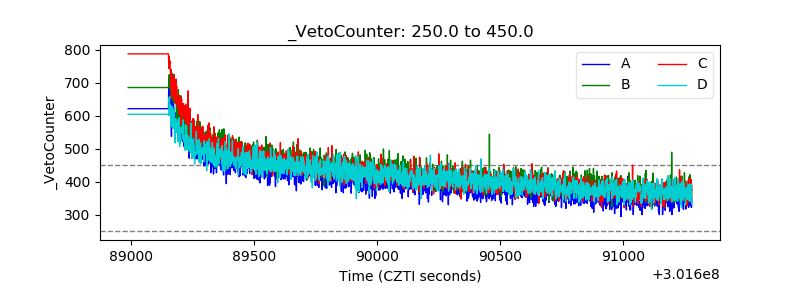 |