| Param | Original file | Final file |
|---|---|---|
| Filename | modeM0/AS1A05_229T02_9000003060cztM0_level2.fits | modeM0/AS1A05_229T02_9000003060cztM0_level2_quad_clean.evt |
| Size (bytes) | 1,209,260,160 | 1,130,719,680 |
| Size | 1.1 GB | 1.1 GB |
| Events in quadrant A | 7,608,338 | 6,903,333 |
| Events in quadrant B | 7,212,449 | 6,853,573 |
| Events in quadrant C | 7,330,120 | 6,595,641 |
| Events in quadrant D | 6,107,976 | 5,533,093 |
| Mode M0 | |||
|---|---|---|---|
| Quadrant | BADHDUFLAG | Total packets | Discarded packets |
| A | 0 | 260173 | 0 |
| B | 0 | 271391 | 0 |
| C | 0 | 258489 | 0 |
| D | 0 | 366918 | 0 |
| Mode SS | |||
|---|---|---|---|
| Quadrant | BADHDUFLAG | Total packets | Discarded packets |
| A | 0 | 2488 | 0 |
| B | 0 | 2490 | 0 |
| C | 0 | 2500 | 0 |
| D | 0 | 2490 | 0 |
| Mode M9 | |||
|---|---|---|---|
| Quadrant | BADHDUFLAG | Total packets | Discarded packets |
| A | 0 | 219 | 0 |
| B | 0 | 219 | 0 |
| C | 0 | 219 | 0 |
| D | 0 | 219 | 0 |
| Quadrant | Total seconds | Saturated seconds | Saturation percentage |
|---|---|---|---|
| A | 122114 | 1323 | 1.083414% |
| B | 122115 | 1996 | 1.634525% |
| C | 122108 | 1654 | 1.354539% |
| D | 121472 | 12783 | 10.523413% |
Noise dominated data is calculated using 1-second bins in cleaned event files. If a bin has >2000 counts, and if more than 50% of those come from <1% of pixels, then it is considered to be noise-dominated and hence unusable.
| Quadrant | # 1 sec bins | Bins with >0 counts | Bins with >2000 counts | High rate bins dominated by noise | Noise dominated (total time) | Noise dominated (detector-on time) | Marked lightcurve |
|---|---|---|---|---|---|---|---|
| A | 143940 | 121464 | 0 | 0 | 0.00% | 0.00% |  |
| B | 143941 | 121424 | 0 | 0 | 0.00% | 0.00% |  |
| C | 143926 | 121398 | 0 | 0 | 0.00% | 0.00% |  |
| D | 143919 | 120570 | 0 | 0 | 0.00% | 0.00% |  |
Top three noisy pixels from each quadrant. If the there are fewer than three noisy pixels in the level2.evt file, extra rows are filled as -1
| Pixel properties | Quadrant properties | ||||||
|---|---|---|---|---|---|---|---|
| Quadrant | DetID | PixID | Counts | Sigma | Mean | Median | Sigma |
| A | 0 | 29 | 7248 | 11.17 | 1981 | 1861 | 482.4 |
| A | 7 | 110 | 6047 | 8.68 | 1981 | 1861 | 482.4 |
| A | 0 | 30 | 5779 | 8.12 | 1981 | 1861 | 482.4 |
| B | 2 | 9 | 5819 | 10.73 | 1908 | 1825 | 372.3 |
| B | 2 | 8 | 4991 | 8.5 | 1908 | 1825 | 372.3 |
| B | 5 | 128 | 4791 | 7.97 | 1908 | 1825 | 372.3 |
| C | 12 | 241 | 5068 | 6.61 | 1938 | 1817 | 491.9 |
| C | 9 | 209 | 4992 | 6.45 | 1938 | 1817 | 491.9 |
| C | 3 | 126 | 4929 | 6.33 | 1938 | 1817 | 491.9 |
| D | 3 | 14 | 4346 | 5.94 | 1746 | 1595 | 463.1 |
| D | 7 | 3 | 4280 | 5.8 | 1746 | 1595 | 463.1 |
| D | 6 | 67 | 4269 | 5.77 | 1746 | 1595 | 463.1 |
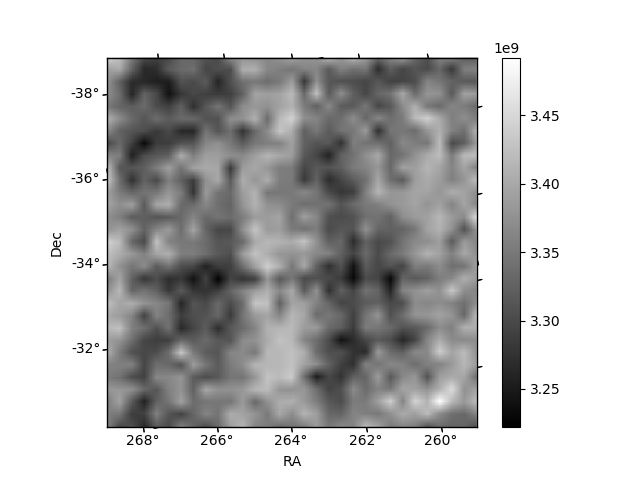
Histogram calculated using DETX and DETY for each event in the final _common_clean file
| Quadrant A |  |
 |
Quadrant B |
|---|---|---|---|
| Quadrant D |  |
 |
Quadrant C |
| Plot type | Count rate plots | Images |
|---|---|---|
| Comparison with Poisson distribution Blue bars denote a histogram of data divided into 1 sec bins. Red curve is a Poisson curve with rate = median count rate of data. |
 |
 |
| Quadrant-wise count rates Data is divided into 100 sec bins |
 |
|
| Module-wise count rates for Quadrant A Data is divided into 100 sec bins |
 |
 |
| Module-wise count rates for Quadrant B Data is divided into 100 sec bins |
 |
 |
| Module-wise count rates for Quadrant C Data is divided into 100 sec bins |
 |
 |
| Module-wise count rates for Quadrant D Data is divided into 100 sec bins |
 |
 |
| Parameter | Plot |
|---|---|
| CZT HV Monitor |  |
| D_VDD |  |
| Temperature 1 |  |
| Veto HV Monitor |  |
| Veto LLD | 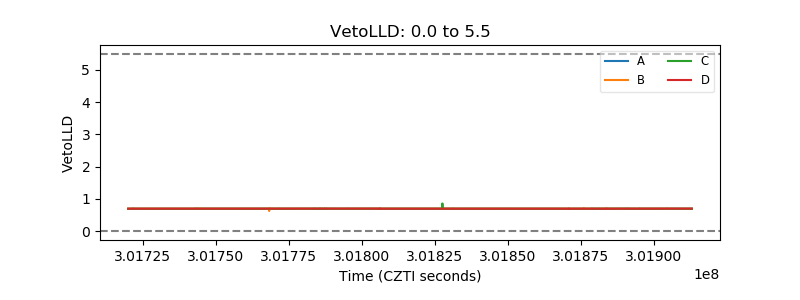 |
| Alpha Counter |  |
| _CPM_Rate | 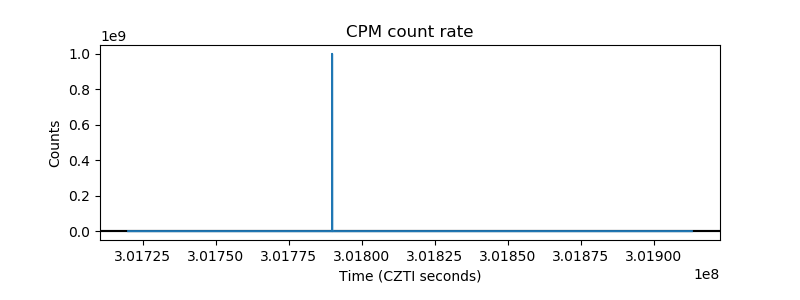 |
| CZT Counter | 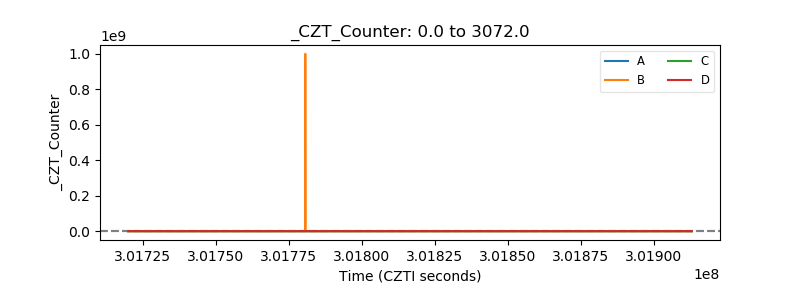 |
| +2.5 Volts monitor |  |
| +5 Volts monitor |  |
| _ROLL_ROT | 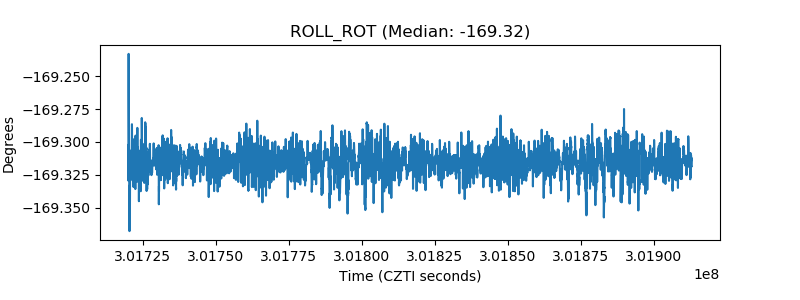 |
| _Roll_DEC |  |
| _Roll_RA |  |
| Veto Counter |  |