| Param | Original file | Final file |
|---|---|---|
| Filename | modeM0/AS1A05_229T02_9000003060_20663cztM0_level2.evt | modeM0/AS1A05_229T02_9000003060_20663cztM0_level2_quad_clean.evt |
| Size (bytes) | 473,495,040 | 78,773,760 |
| Size | 451.6 MB | 75.1 MB |
| Events in quadrant A | 3,226,273 | 482,978 |
| Events in quadrant B | 3,484,526 | 483,876 |
| Events in quadrant C | 3,265,175 | 471,879 |
| Events in quadrant D | 3,889,127 | 459,827 |
| Mode M0 | |||
|---|---|---|---|
| Quadrant | BADHDUFLAG | Total packets | Discarded packets |
| A | 0 | 14249 | 2 |
| B | 0 | 14814 | 2 |
| C | 0 | 14203 | 2 |
| D | 0 | 16309 | 2 |
| Mode SS | |||
|---|---|---|---|
| Quadrant | BADHDUFLAG | Total packets | Discarded packets |
| A | 0 | 142 | 0 |
| B | 0 | 142 | 0 |
| C | 0 | 142 | 0 |
| D | 0 | 142 | 0 |
| Mode M9 | |||
|---|---|---|---|
| Quadrant | BADHDUFLAG | Total packets | Discarded packets |
| A | 0 | 13 | 0 |
| B | 0 | 13 | 0 |
| C | 0 | 13 | 0 |
| D | 0 | 13 | 0 |
| Quadrant | Total seconds | Saturated seconds | Saturation percentage |
|---|---|---|---|
| A | 6987 | 22 | 0.314870% |
| B | 6987 | 61 | 0.873050% |
| C | 6987 | 61 | 0.873050% |
| D | 6987 | 191 | 2.733648% |
Noise dominated data is calculated using 1-second bins in cleaned event files. If a bin has >2000 counts, and if more than 50% of those come from <1% of pixels, then it is considered to be noise-dominated and hence unusable.
| Quadrant | # 1 sec bins | Bins with >0 counts | Bins with >2000 counts | High rate bins dominated by noise | Noise dominated (total time) | Noise dominated (detector-on time) | Marked lightcurve |
|---|---|---|---|---|---|---|---|
| A | 7787 | 6988 | 0 | 0 | 0.00% | 0.00% | 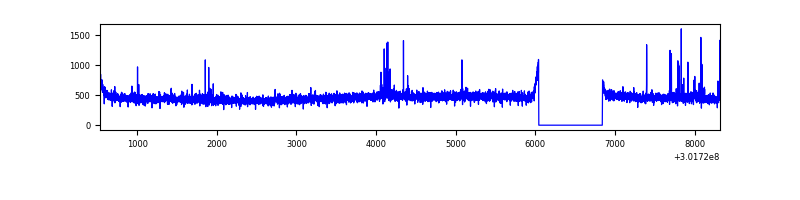 |
| B | 7787 | 6988 | 19 | 19 | 0.24% | 0.27% | 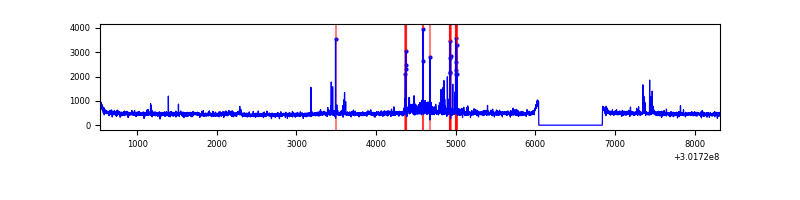 |
| C | 7787 | 6988 | 2 | 2 | 0.03% | 0.03% | 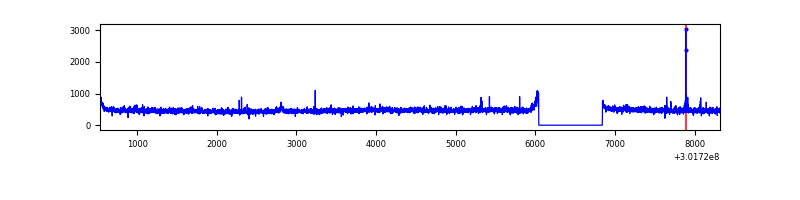 |
| D | 7787 | 6988 | 145 | 145 | 1.86% | 2.07% | 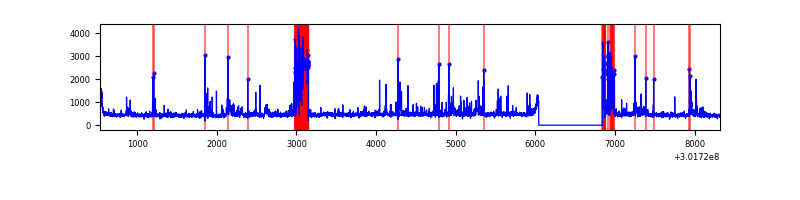 |
Top three noisy pixels from each quadrant. If the there are fewer than three noisy pixels in the level2.evt file, extra rows are filled as -1
| Pixel properties | Quadrant properties | ||||||
|---|---|---|---|---|---|---|---|
| Quadrant | DetID | PixID | Counts | Sigma | Mean | Median | Sigma |
| A | 5 | 16 | 50412 | 297.46 | 824 | 806 | 166.8 |
| A | 0 | 226 | 7185 | 38.25 | 824 | 806 | 166.8 |
| A | 3 | 137 | 6769 | 35.76 | 824 | 806 | 166.8 |
| B | 7 | 220 | 147063 | 930.4 | 826 | 806 | 157.2 |
| B | 3 | 64 | 42111 | 262.76 | 826 | 806 | 157.2 |
| B | 0 | 183 | 21878 | 134.05 | 826 | 806 | 157.2 |
| C | 14 | 238 | 124789 | 664.23 | 793 | 798 | 186.7 |
| C | 7 | 247 | 19804 | 101.82 | 793 | 798 | 186.7 |
| C | 9 | 54 | 13921 | 70.3 | 793 | 798 | 186.7 |
| D | 2 | 165 | 427554 | 2212.33 | 790 | 769 | 192.9 |
| D | 1 | 52 | 355984 | 1841.34 | 790 | 769 | 192.9 |
| D | 7 | 238 | 54212 | 277.03 | 790 | 769 | 192.9 |
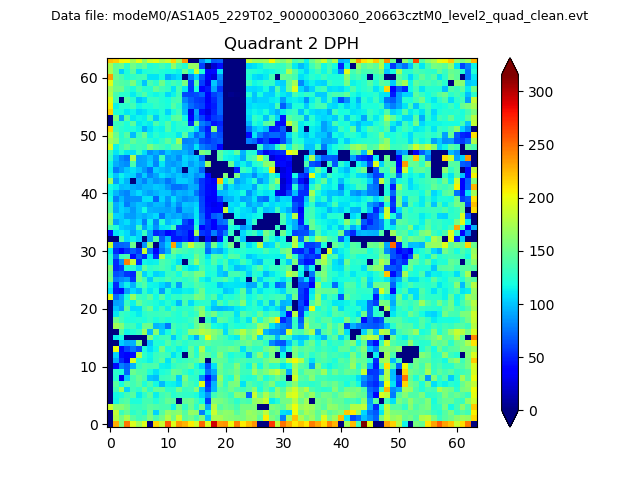
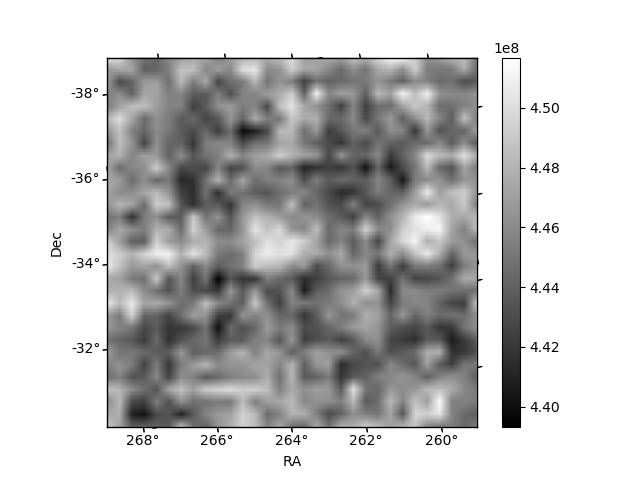
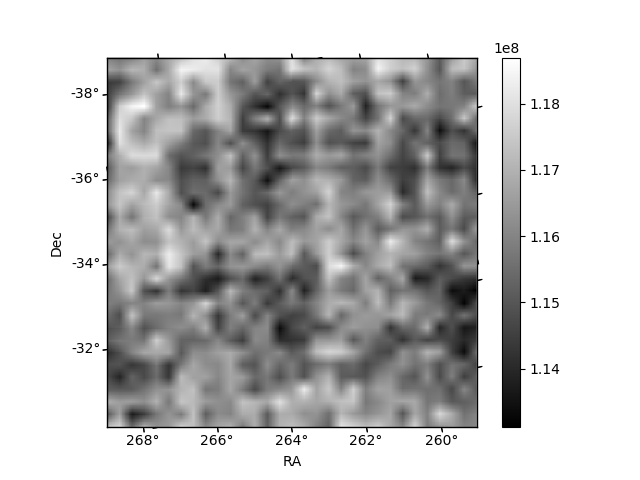
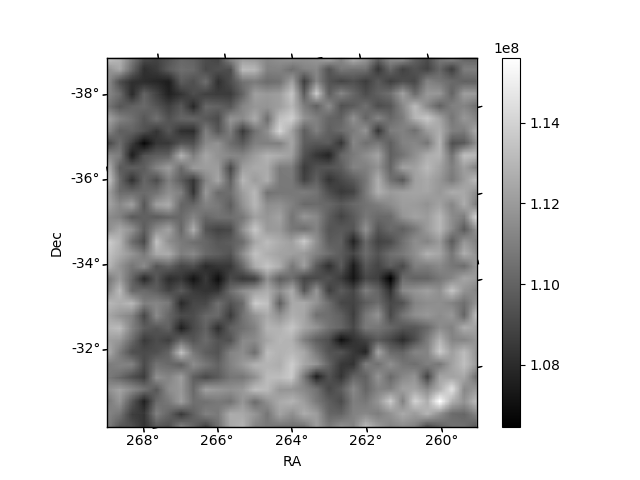
Histogram calculated using DETX and DETY for each event in the final _common_clean file
| Quadrant A | 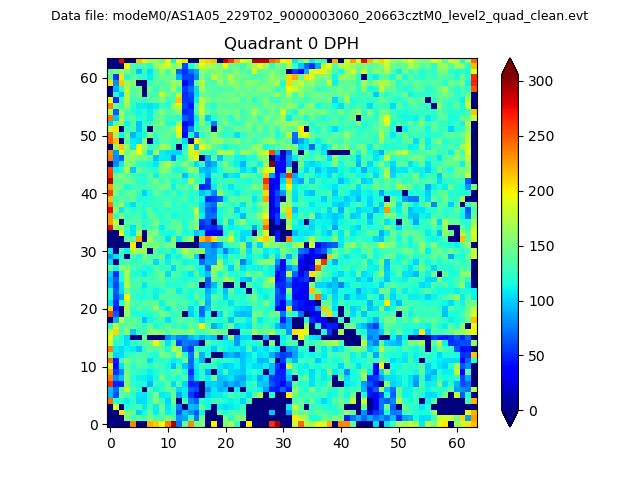 |
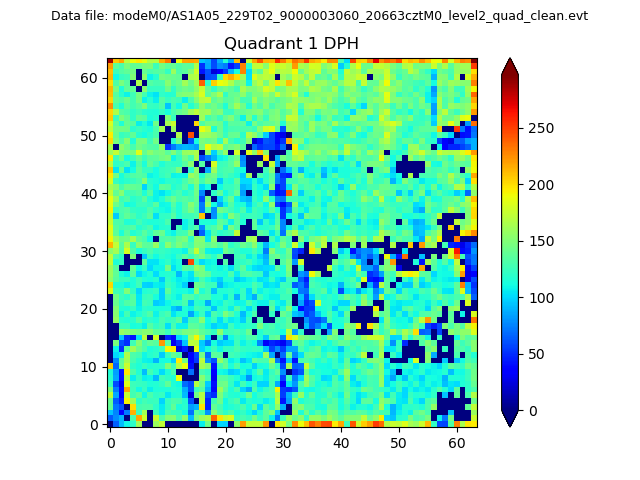 |
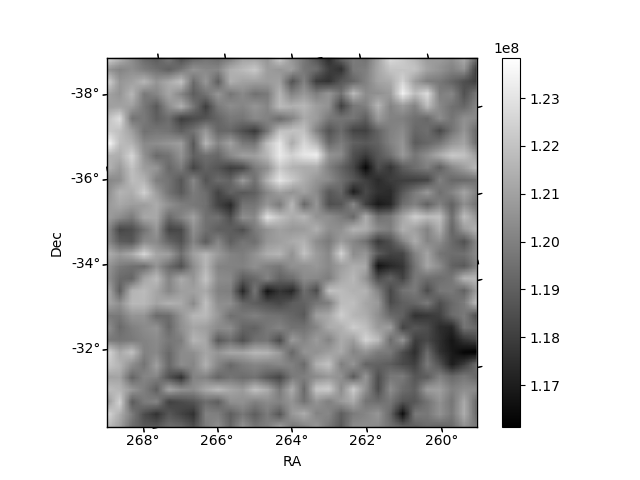
Quadrant B |
|---|---|---|---|
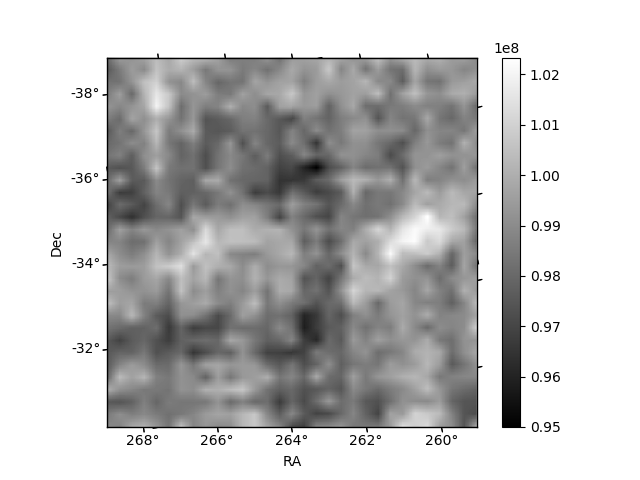
| Quadrant D | 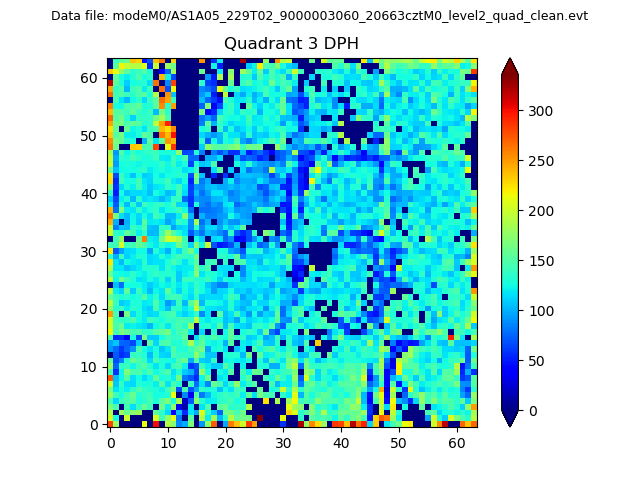 |
 |
Quadrant C |
| Plot type | Count rate plots | Images |
|---|---|---|
| Comparison with Poisson distribution Blue bars denote a histogram of data divided into 1 sec bins. Red curve is a Poisson curve with rate = median count rate of data. |
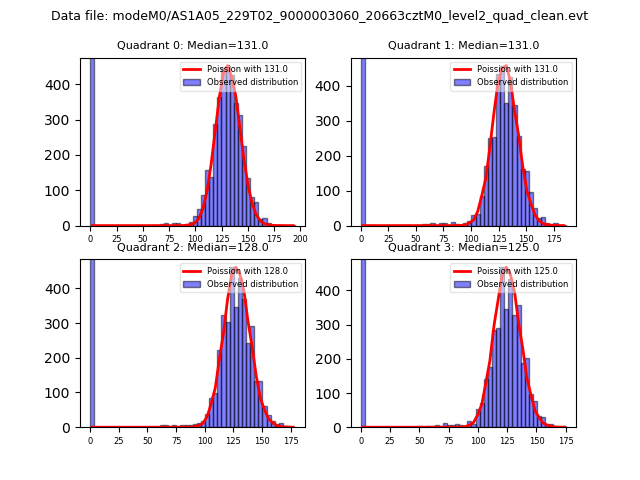 |
 |
| Quadrant-wise count rates Data is divided into 100 sec bins |
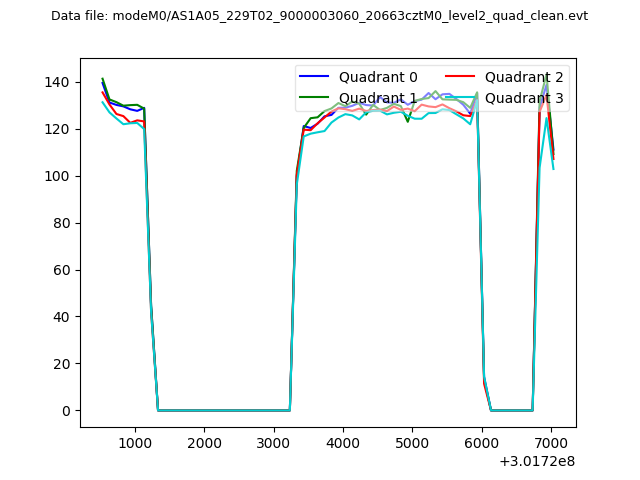 |
|
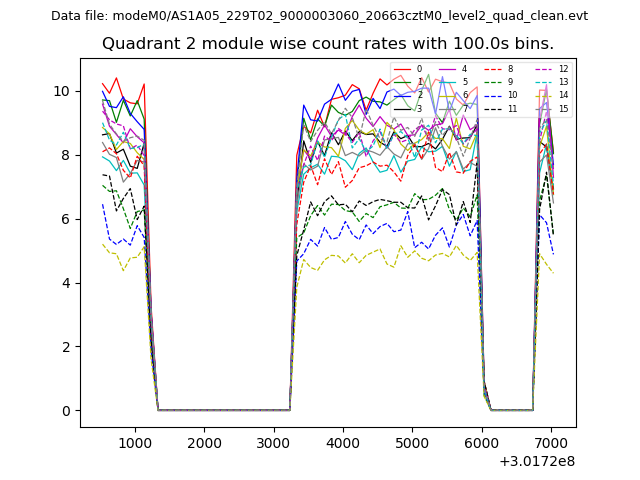
| Module-wise count rates for Quadrant A Data is divided into 100 sec bins |
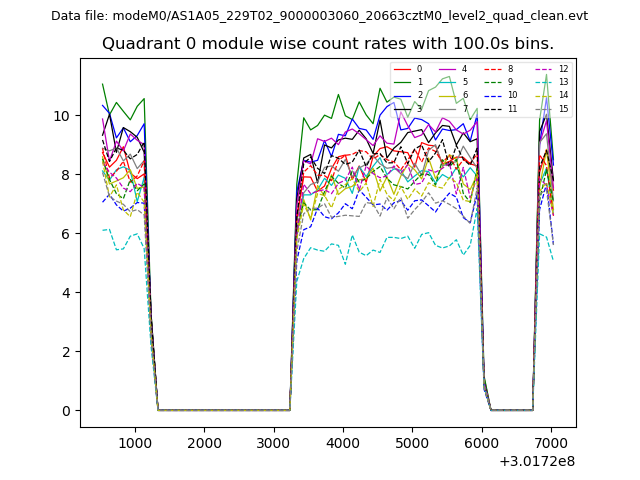 |
 |
| Module-wise count rates for Quadrant B Data is divided into 100 sec bins |
 |
 |
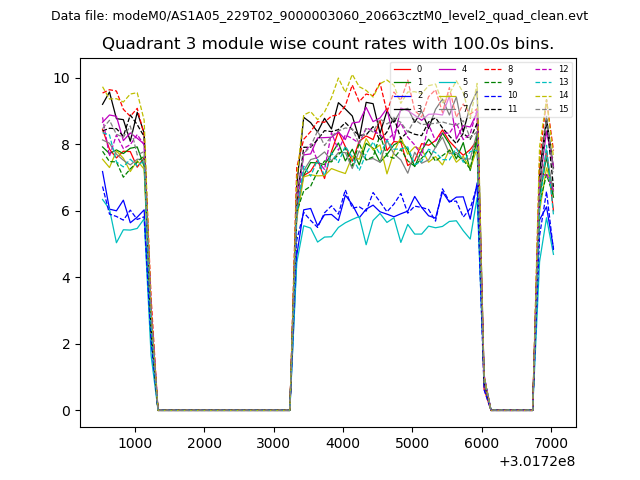
| Module-wise count rates for Quadrant C Data is divided into 100 sec bins |
 |
 |
| Module-wise count rates for Quadrant D Data is divided into 100 sec bins |
 |
 |
| Parameter | Plot |
|---|---|
| CZT HV Monitor | 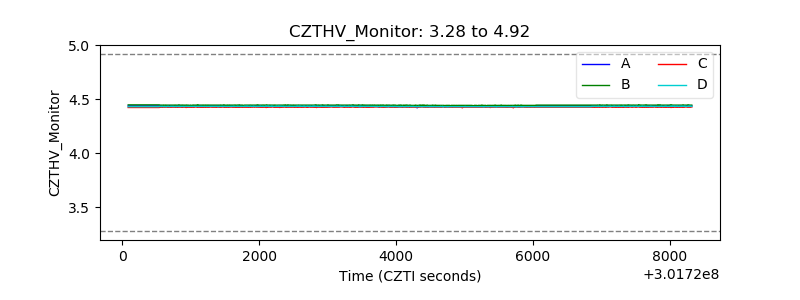 |
| D_VDD | 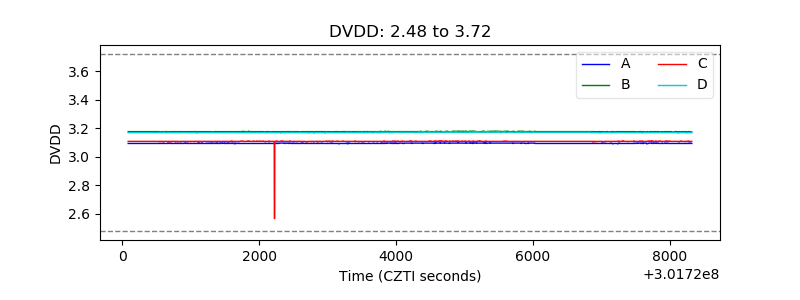 |
| Temperature 1 |  |
| Veto HV Monitor | 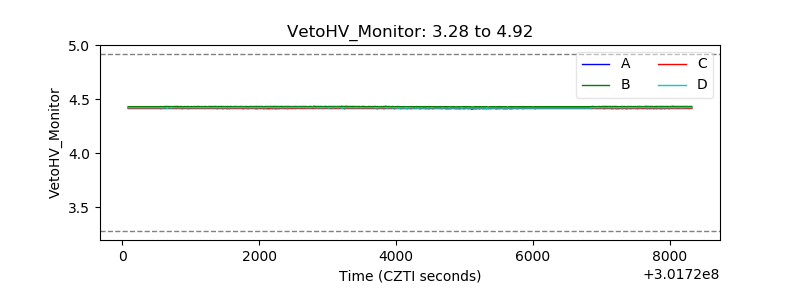 |
| Veto LLD | 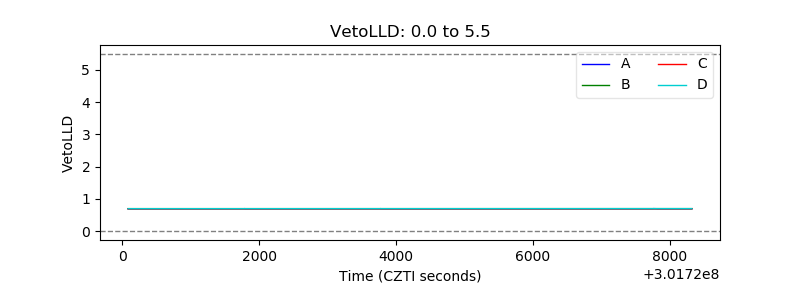 |
| Alpha Counter | 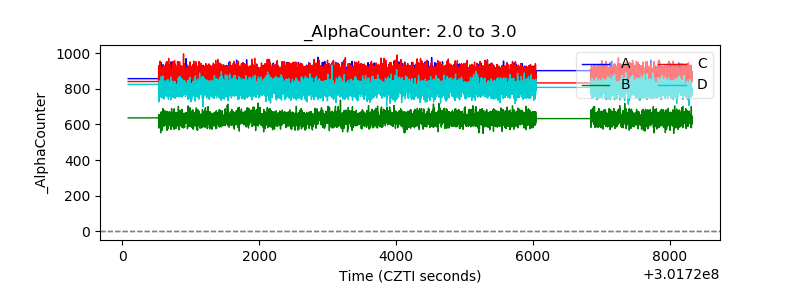 |
| _CPM_Rate | 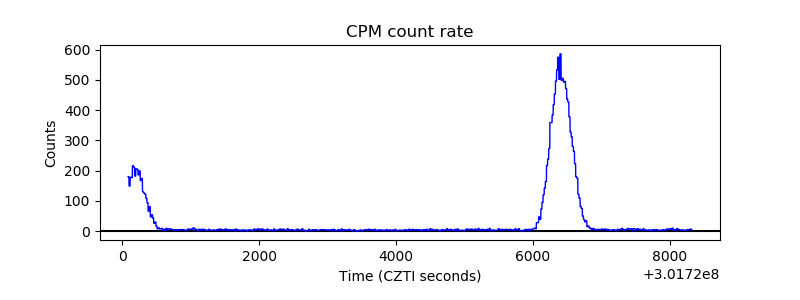 |
| CZT Counter | 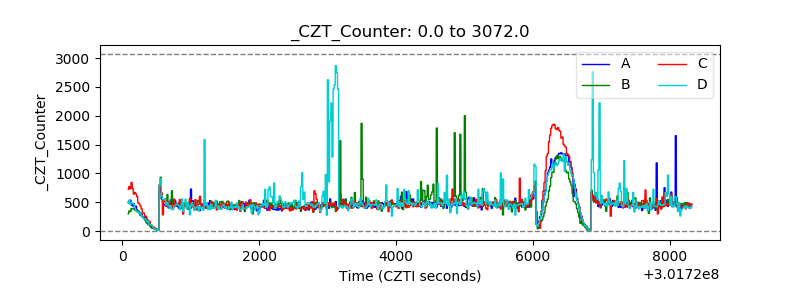 |
| +2.5 Volts monitor |  |
| +5 Volts monitor |  |
| _ROLL_ROT | 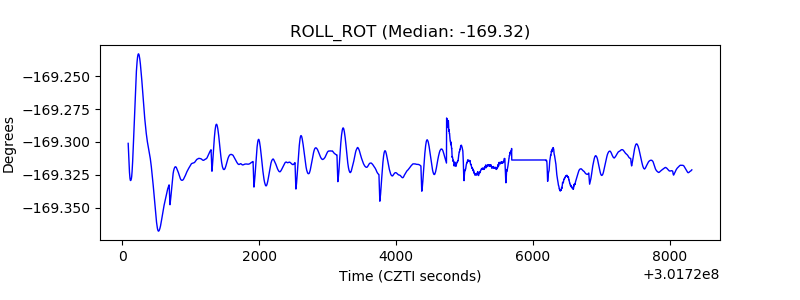 |
| _Roll_DEC |  |
| _Roll_RA | 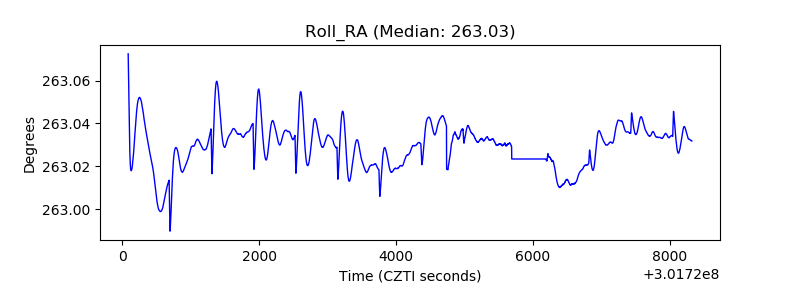 |
| Veto Counter | 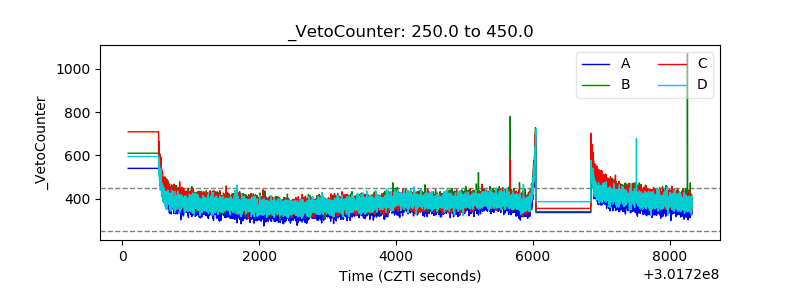 |