| Param | Original file | Final file |
|---|---|---|
| Filename | modeM0/AS1A05_229T02_9000003060_20665cztM0_level2.evt | modeM0/AS1A05_229T02_9000003060_20665cztM0_level2_quad_clean.evt |
| Size (bytes) | 467,536,320 | 72,866,880 |
| Size | 445.9 MB | 69.5 MB |
| Events in quadrant A | 3,502,217 | 441,452 |
| Events in quadrant B | 3,544,591 | 441,887 |
| Events in quadrant C | 3,358,061 | 433,071 |
| Events in quadrant D | 3,300,085 | 423,682 |
| Mode M0 | |||
|---|---|---|---|
| Quadrant | BADHDUFLAG | Total packets | Discarded packets |
| A | 0 | 14619 | 1 |
| B | 0 | 14691 | 1 |
| C | 0 | 14168 | 2 |
| D | 0 | 14080 | 1 |
| Mode SS | |||
|---|---|---|---|
| Quadrant | BADHDUFLAG | Total packets | Discarded packets |
| A | 0 | 134 | 0 |
| B | 0 | 134 | 0 |
| C | 0 | 134 | 0 |
| D | 0 | 134 | 0 |
| Mode M9 | |||
|---|---|---|---|
| Quadrant | BADHDUFLAG | Total packets | Discarded packets |
| A | 0 | 21 | 0 |
| B | 0 | 21 | 0 |
| C | 0 | 21 | 0 |
| D | 0 | 21 | 0 |
| Quadrant | Total seconds | Saturated seconds | Saturation percentage |
|---|---|---|---|
| A | 6699 | 155 | 2.313778% |
| B | 6700 | 110 | 1.641791% |
| C | 6699 | 117 | 1.746529% |
| D | 6699 | 66 | 0.985222% |
Noise dominated data is calculated using 1-second bins in cleaned event files. If a bin has >2000 counts, and if more than 50% of those come from <1% of pixels, then it is considered to be noise-dominated and hence unusable.
| Quadrant | # 1 sec bins | Bins with >0 counts | Bins with >2000 counts | High rate bins dominated by noise | Noise dominated (total time) | Noise dominated (detector-on time) | Marked lightcurve |
|---|---|---|---|---|---|---|---|
| A | 8684 | 6701 | 63 | 63 | 0.73% | 0.94% | 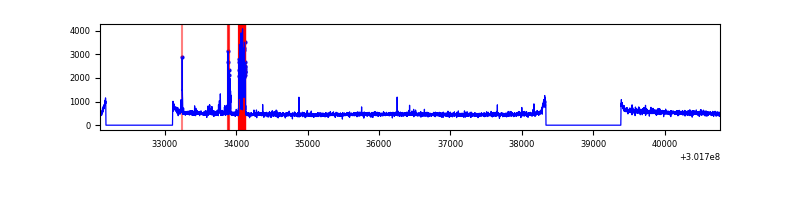 |
| B | 8685 | 6702 | 17 | 17 | 0.20% | 0.25% | 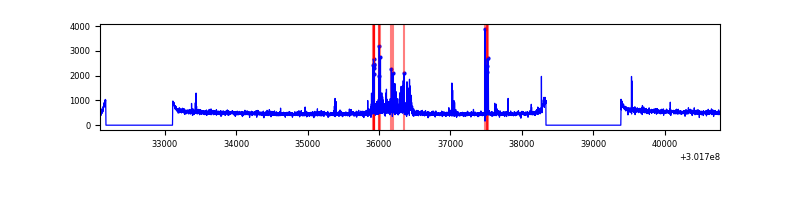 |
| C | 8684 | 6701 | 0 | 0 | 0.00% | 0.00% | 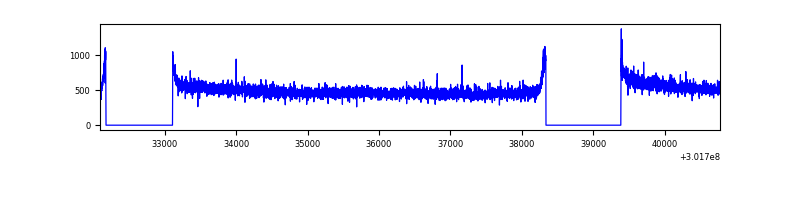 |
| D | 8684 | 6701 | 6 | 6 | 0.07% | 0.09% | 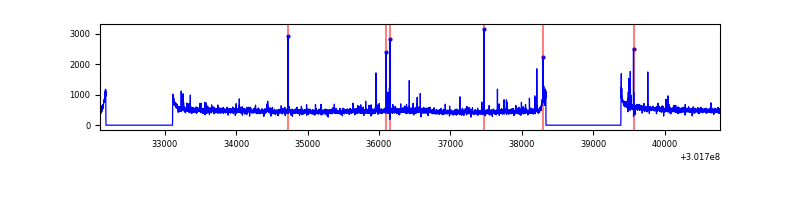 |
Top three noisy pixels from each quadrant. If the there are fewer than three noisy pixels in the level2.evt file, extra rows are filled as -1
| Pixel properties | Quadrant properties | ||||||
|---|---|---|---|---|---|---|---|
| Quadrant | DetID | PixID | Counts | Sigma | Mean | Median | Sigma |
| A | 5 | 16 | 215987 | 1267.8 | 846 | 828 | 169.7 |
| A | 13 | 252 | 31474 | 180.58 | 846 | 828 | 169.7 |
| A | 0 | 226 | 7295 | 38.1 | 846 | 828 | 169.7 |
| B | 7 | 220 | 172000 | 1073.89 | 849 | 829 | 159.4 |
| B | 12 | 111 | 18986 | 113.91 | 849 | 829 | 159.4 |
| B | 11 | 111 | 16851 | 100.52 | 849 | 829 | 159.4 |
| C | 14 | 238 | 129705 | 670.89 | 820 | 824 | 192.1 |
| C | 8 | 208 | 24812 | 124.87 | 820 | 824 | 192.1 |
| C | 3 | 233 | 6303 | 28.52 | 820 | 824 | 192.1 |
| D | 1 | 52 | 49477 | 243.7 | 828 | 806 | 199.7 |
| D | 7 | 238 | 36031 | 176.37 | 828 | 806 | 199.7 |
| D | 2 | 234 | 29694 | 144.64 | 828 | 806 | 199.7 |
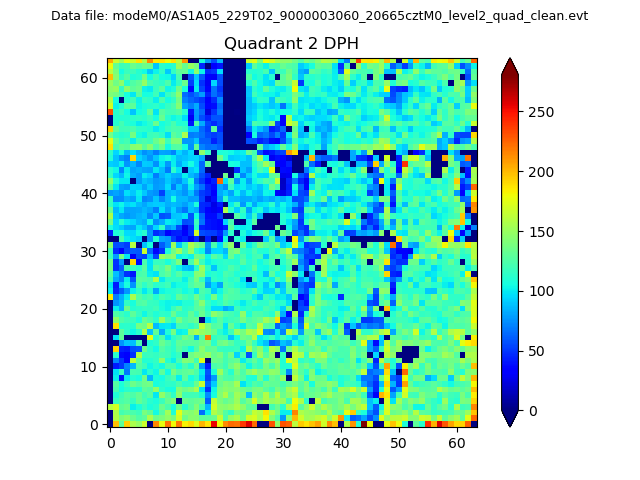
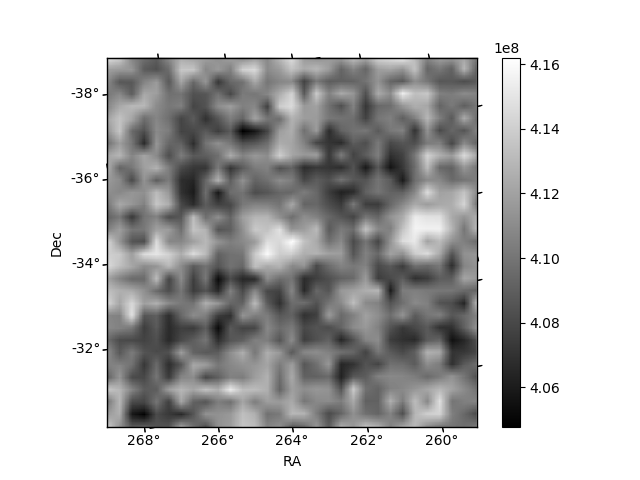
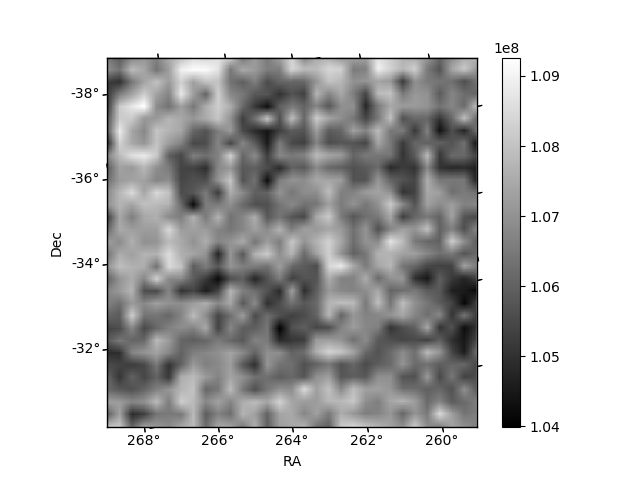
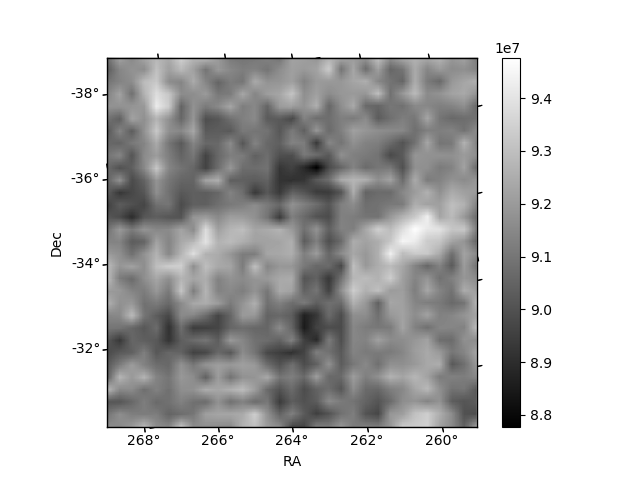
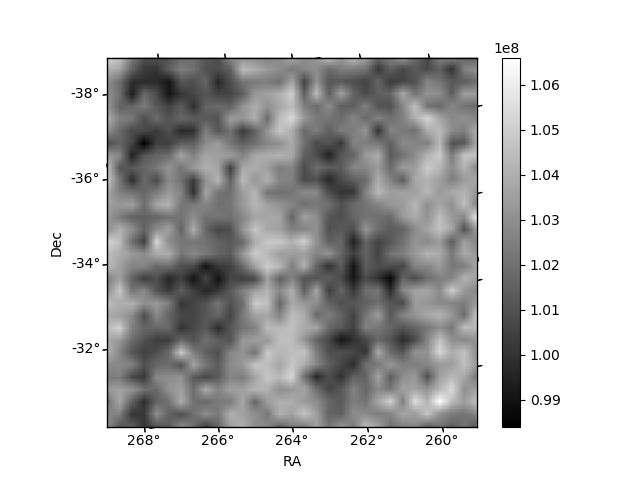
Histogram calculated using DETX and DETY for each event in the final _common_clean file
| Quadrant A | 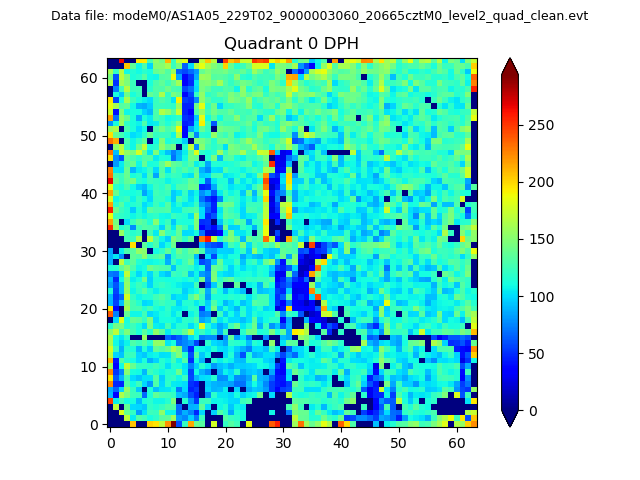 |
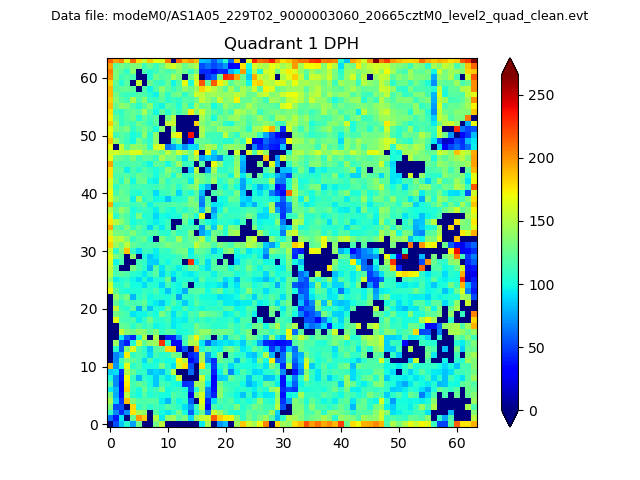 |
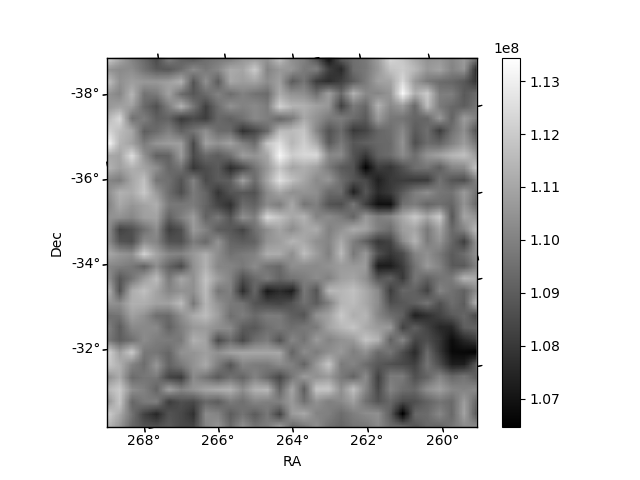
Quadrant B |
|---|---|---|---|
| Quadrant D | 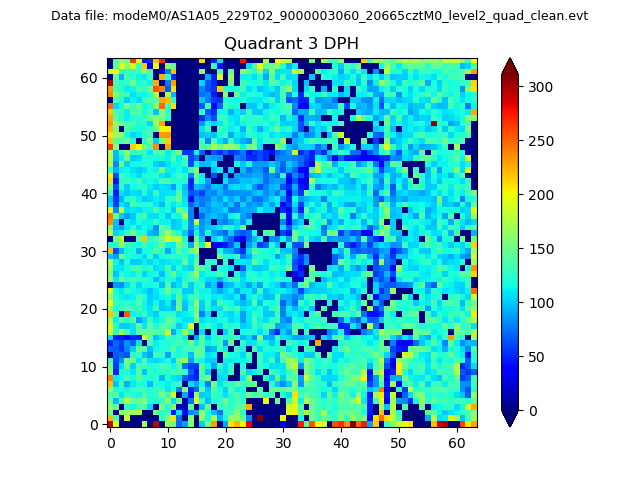 |
 |
Quadrant C |
| Plot type | Count rate plots | Images |
|---|---|---|
| Comparison with Poisson distribution Blue bars denote a histogram of data divided into 1 sec bins. Red curve is a Poisson curve with rate = median count rate of data. |
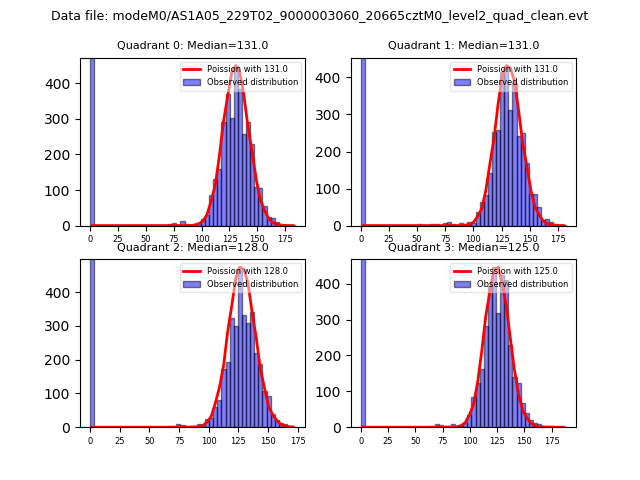 |
 |
| Quadrant-wise count rates Data is divided into 100 sec bins |
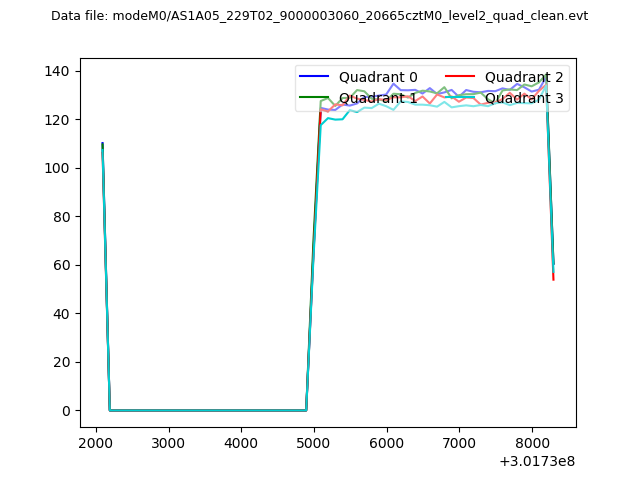 |
|
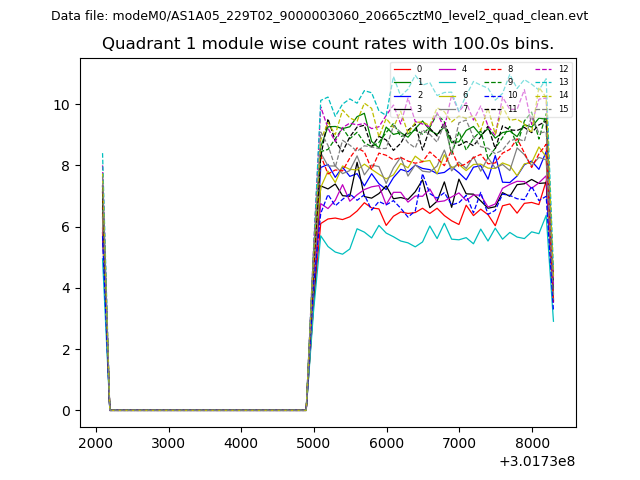
| Module-wise count rates for Quadrant A Data is divided into 100 sec bins |
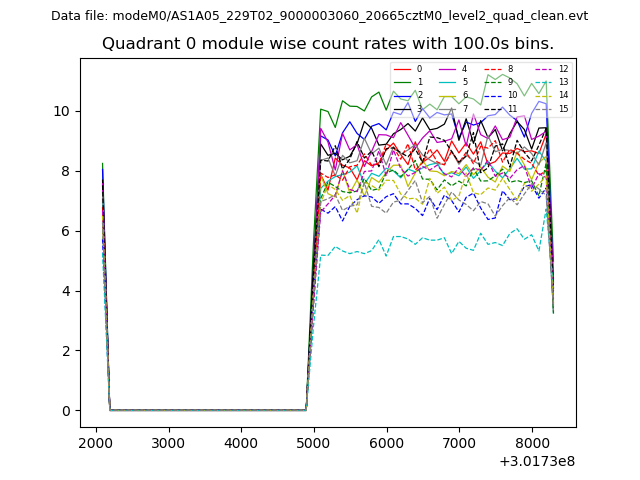 |
 |
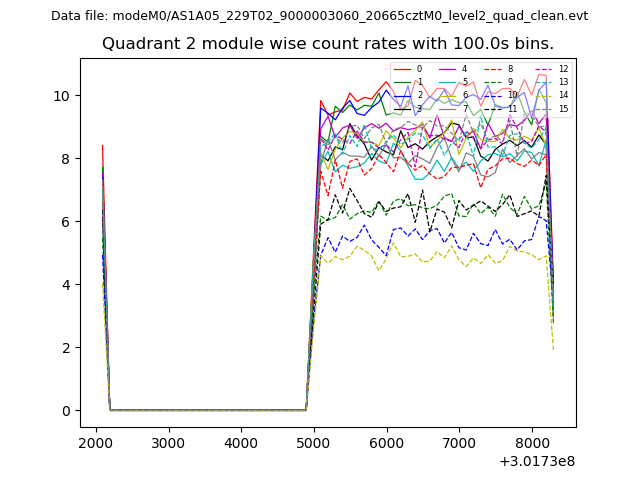
| Module-wise count rates for Quadrant B Data is divided into 100 sec bins |
 |
 |
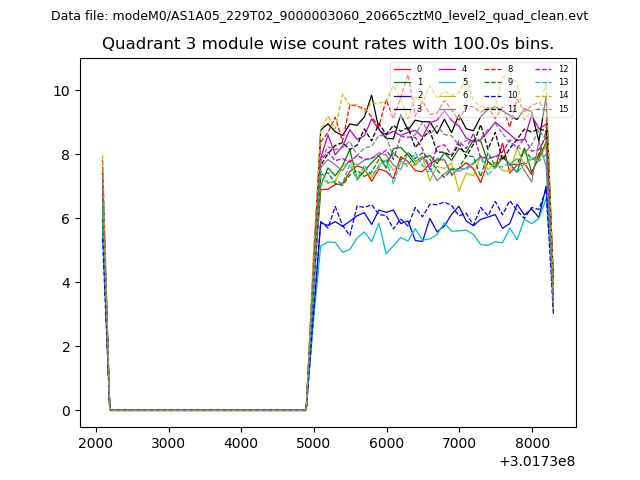
| Module-wise count rates for Quadrant C Data is divided into 100 sec bins |
 |
 |
| Module-wise count rates for Quadrant D Data is divided into 100 sec bins |
 |
 |
| Parameter | Plot |
|---|---|
| CZT HV Monitor | 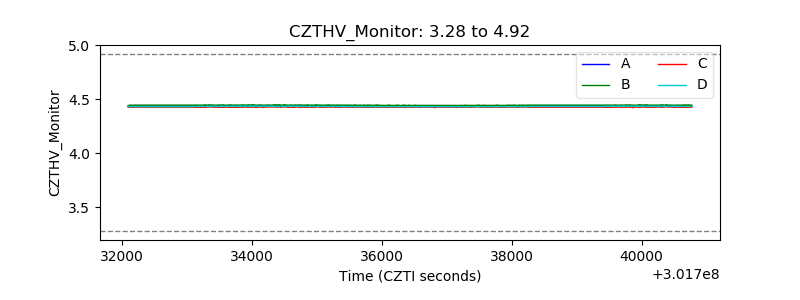 |
| D_VDD | 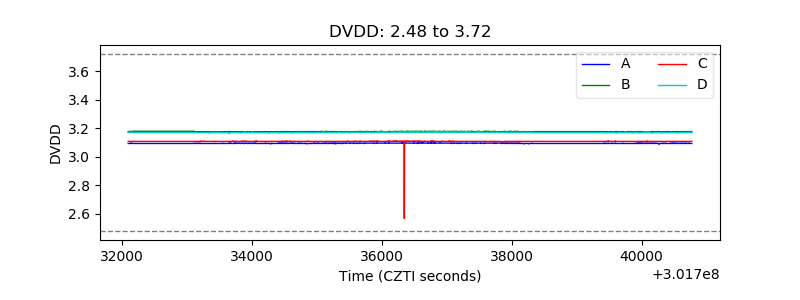 |
| Temperature 1 | 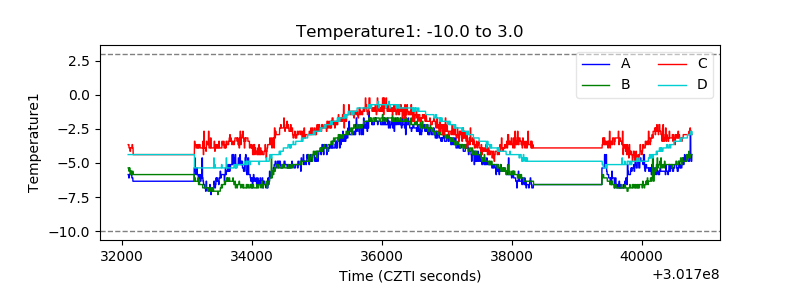 |
| Veto HV Monitor | 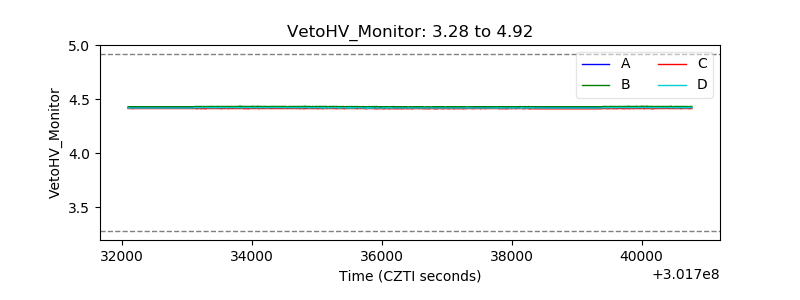 |
| Veto LLD | 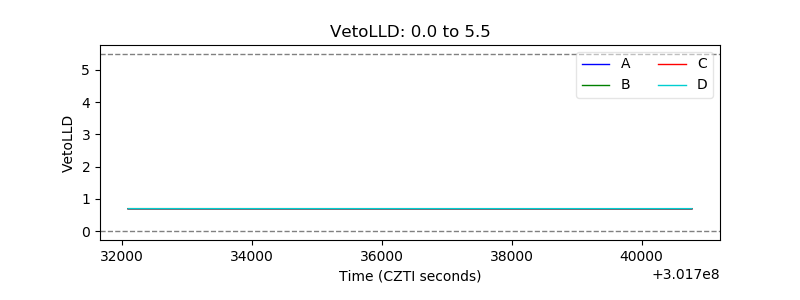 |
| Alpha Counter | 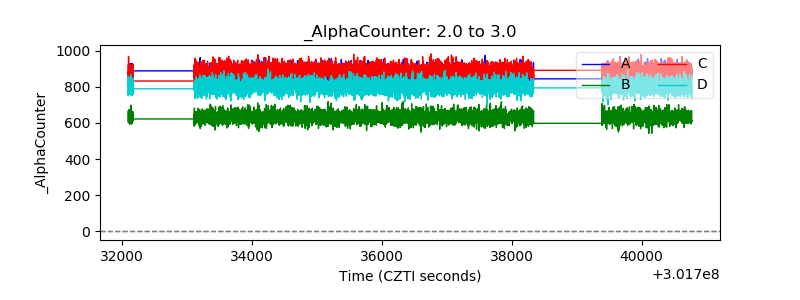 |
| _CPM_Rate | 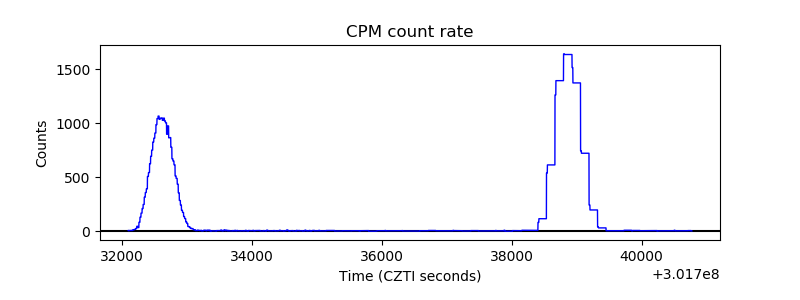 |
| CZT Counter | 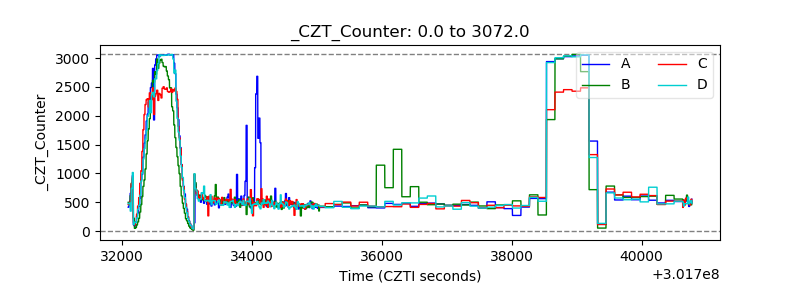 |
| +2.5 Volts monitor |  |
| +5 Volts monitor | 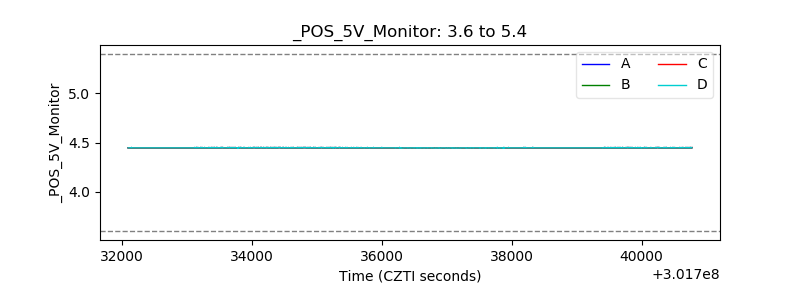 |
| _ROLL_ROT | 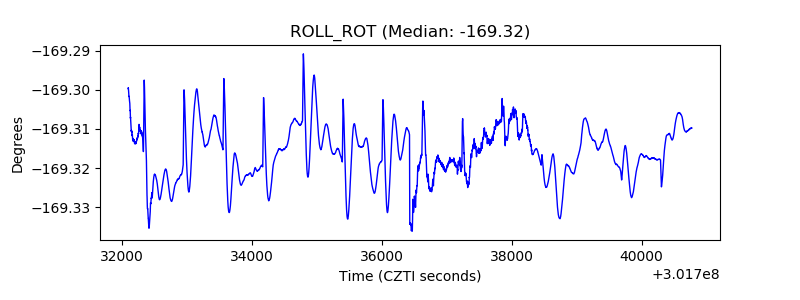 |
| _Roll_DEC | 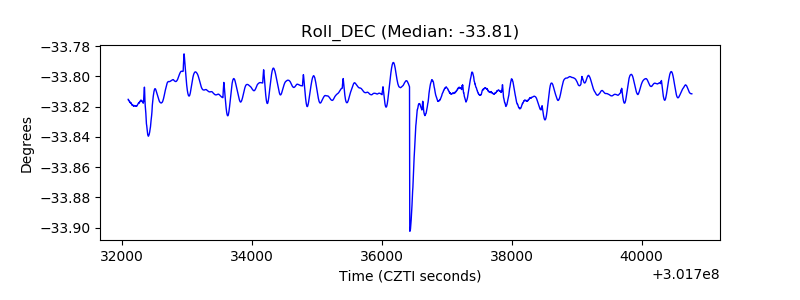 |
| _Roll_RA | 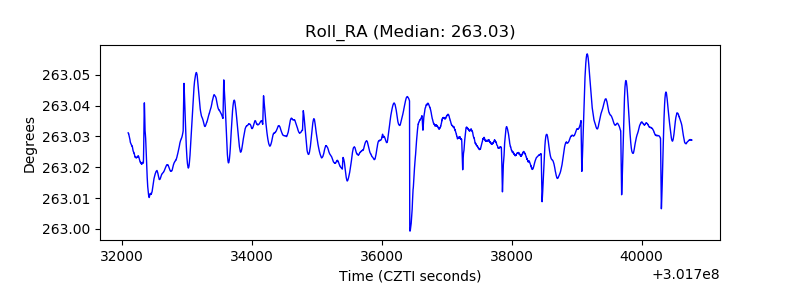 |
| Veto Counter | 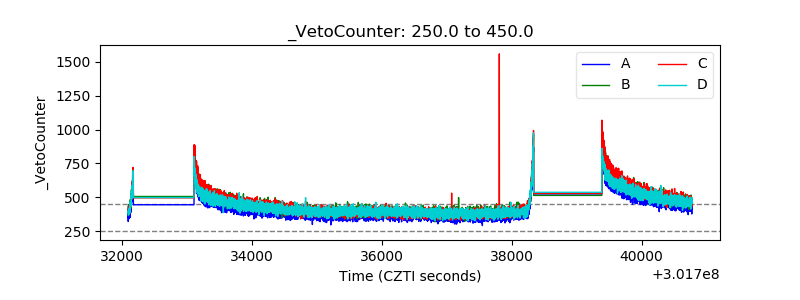 |