| Param | Original file | Final file |
|---|---|---|
| Filename | modeM0/AS1A05_229T02_9000003060_20668cztM0_level2.evt | modeM0/AS1A05_229T02_9000003060_20668cztM0_level2_quad_clean.evt |
| Size (bytes) | 489,386,880 | 100,788,480 |
| Size | 466.7 MB | 96.1 MB |
| Events in quadrant A | 3,543,822 | 663,221 |
| Events in quadrant B | 3,712,629 | 666,719 |
| Events in quadrant C | 3,494,993 | 643,741 |
| Events in quadrant D | 3,638,594 | 635,475 |
| Mode M0 | |||
|---|---|---|---|
| Quadrant | BADHDUFLAG | Total packets | Discarded packets |
| A | 0 | 14669 | 3 |
| B | 0 | 15188 | 2 |
| C | 0 | 14591 | 2 |
| D | 0 | 14911 | 2 |
| Mode SS | |||
|---|---|---|---|
| Quadrant | BADHDUFLAG | Total packets | Discarded packets |
| A | 0 | 128 | 0 |
| B | 0 | 128 | 0 |
| C | 0 | 128 | 0 |
| D | 0 | 128 | 0 |
| Mode M9 | |||
|---|---|---|---|
| Quadrant | BADHDUFLAG | Total packets | Discarded packets |
| A | 0 | 17 | 0 |
| B | 0 | 18 | 0 |
| C | 0 | 18 | 0 |
| D | 0 | 18 | 0 |
| Quadrant | Total seconds | Saturated seconds | Saturation percentage |
|---|---|---|---|
| A | 6355 | 93 | 1.463415% |
| B | 6355 | 134 | 2.108576% |
| C | 6355 | 134 | 2.108576% |
| D | 6355 | 99 | 1.557828% |
Noise dominated data is calculated using 1-second bins in cleaned event files. If a bin has >2000 counts, and if more than 50% of those come from <1% of pixels, then it is considered to be noise-dominated and hence unusable.
| Quadrant | # 1 sec bins | Bins with >0 counts | Bins with >2000 counts | High rate bins dominated by noise | Noise dominated (total time) | Noise dominated (detector-on time) | Marked lightcurve |
|---|---|---|---|---|---|---|---|
| A | 7615 | 6355 | 10 | 10 | 0.13% | 0.16% | 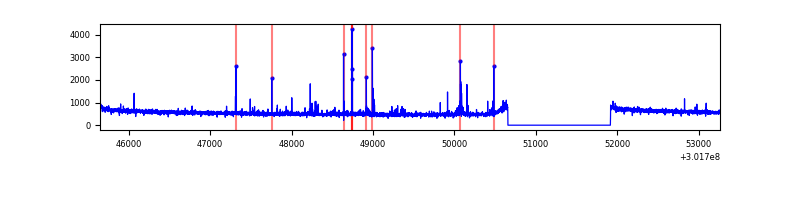 |
| B | 7615 | 6356 | 31 | 31 | 0.41% | 0.49% | 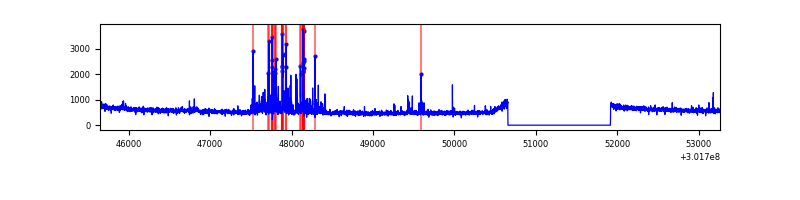 |
| C | 7615 | 6355 | 1 | 1 | 0.01% | 0.02% | 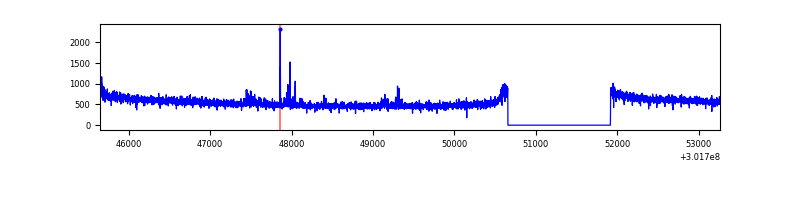 |
| D | 7615 | 6355 | 24 | 24 | 0.32% | 0.38% | 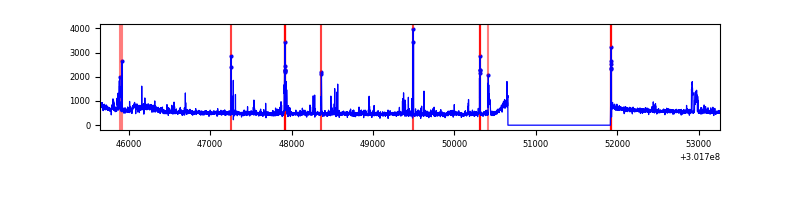 |
Top three noisy pixels from each quadrant. If the there are fewer than three noisy pixels in the level2.evt file, extra rows are filled as -1
| Pixel properties | Quadrant properties | ||||||
|---|---|---|---|---|---|---|---|
| Quadrant | DetID | PixID | Counts | Sigma | Mean | Median | Sigma |
| A | 9 | 143 | 64412 | 356.39 | 890 | 877 | 178.3 |
| A | 5 | 16 | 45513 | 250.38 | 890 | 877 | 178.3 |
| A | 8 | 205 | 15966 | 84.64 | 890 | 877 | 178.3 |
| B | 7 | 220 | 235268 | 1450.74 | 874 | 856 | 161.6 |
| B | 12 | 111 | 18516 | 109.3 | 874 | 856 | 161.6 |
| B | 0 | 189 | 18219 | 107.46 | 874 | 856 | 161.6 |
| C | 14 | 238 | 134335 | 689.12 | 842 | 852 | 193.7 |
| C | 8 | 208 | 47609 | 241.39 | 842 | 852 | 193.7 |
| C | 0 | 207 | 19176 | 94.6 | 842 | 852 | 193.7 |
| D | 1 | 20 | 129734 | 625.76 | 861 | 837 | 206.0 |
| D | 13 | 153 | 103048 | 496.21 | 861 | 837 | 206.0 |
| D | 1 | 52 | 48533 | 231.55 | 861 | 837 | 206.0 |
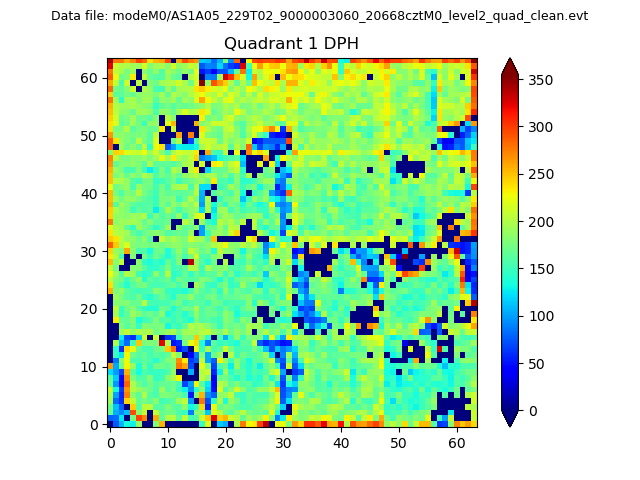
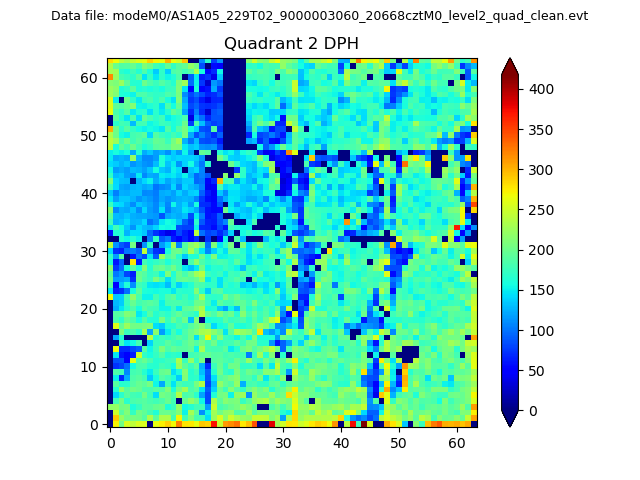
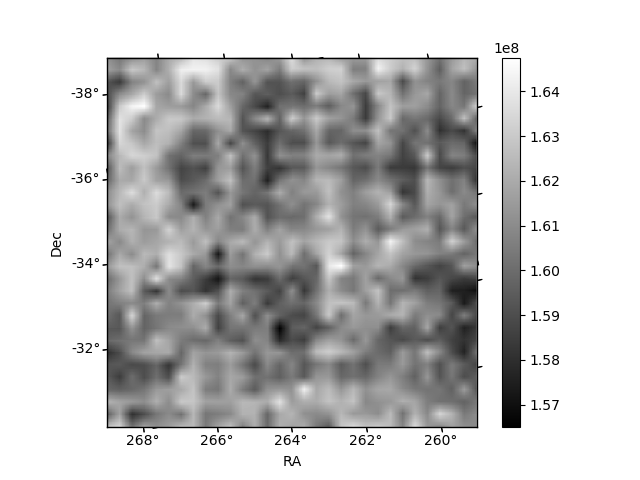
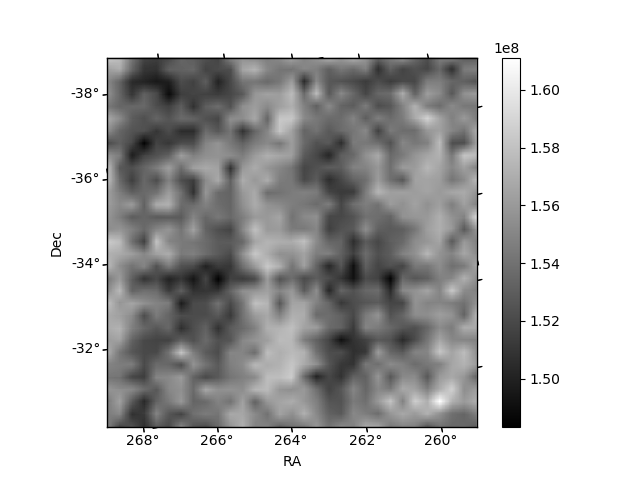
Histogram calculated using DETX and DETY for each event in the final _common_clean file
| Quadrant A |  |
 |
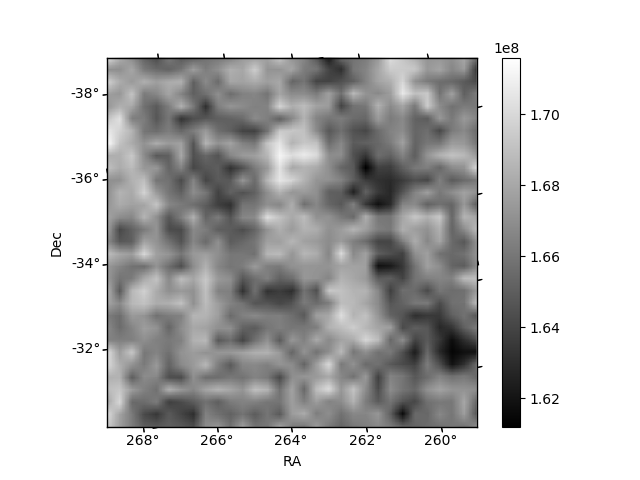
Quadrant B |
|---|---|---|---|
| Quadrant D |  |
 |
Quadrant C |
| Plot type | Count rate plots | Images |
|---|---|---|
| Comparison with Poisson distribution Blue bars denote a histogram of data divided into 1 sec bins. Red curve is a Poisson curve with rate = median count rate of data. |
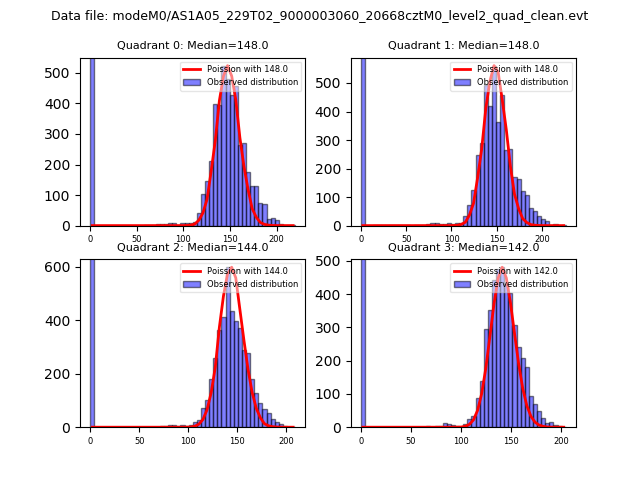 |
 |
| Quadrant-wise count rates Data is divided into 100 sec bins |
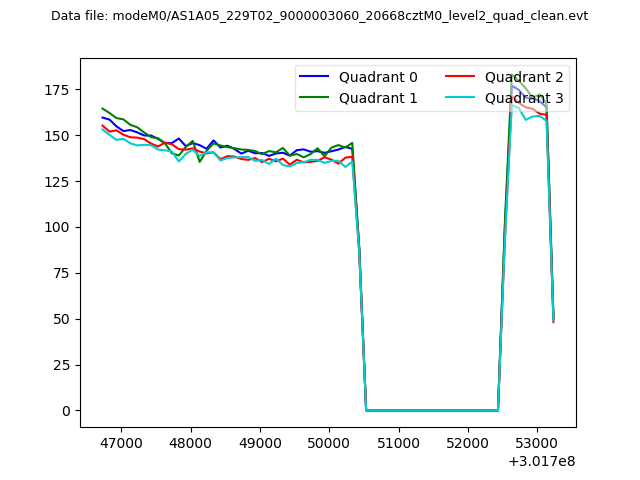 |
|
| Module-wise count rates for Quadrant A Data is divided into 100 sec bins |
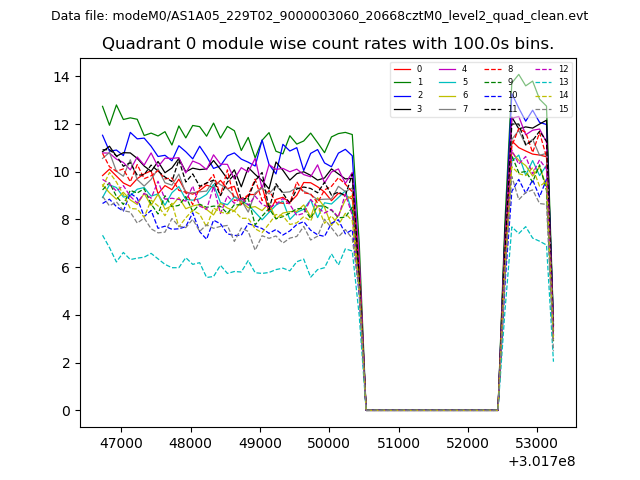 |
 |
| Module-wise count rates for Quadrant B Data is divided into 100 sec bins |
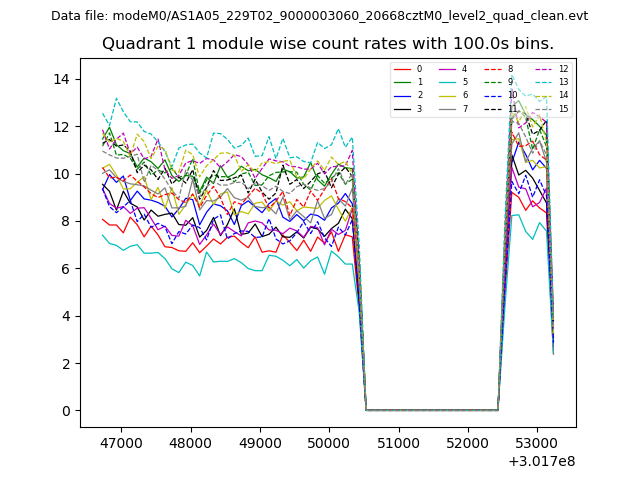 |
 |
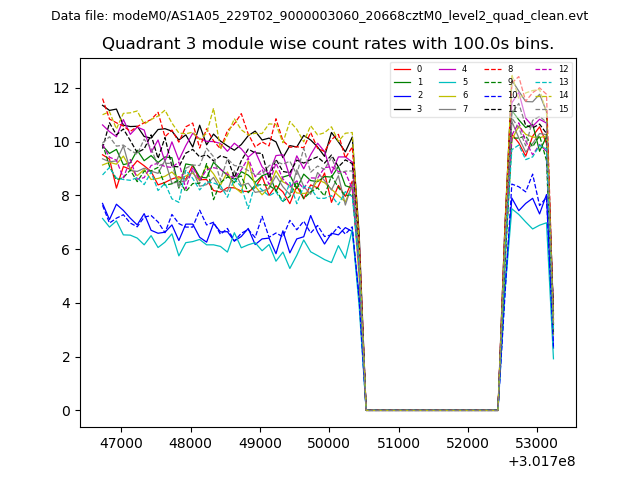
| Module-wise count rates for Quadrant C Data is divided into 100 sec bins |
 |
 |
| Module-wise count rates for Quadrant D Data is divided into 100 sec bins |
 |
 |
| Parameter | Plot |
|---|---|
| CZT HV Monitor |  |
| D_VDD | 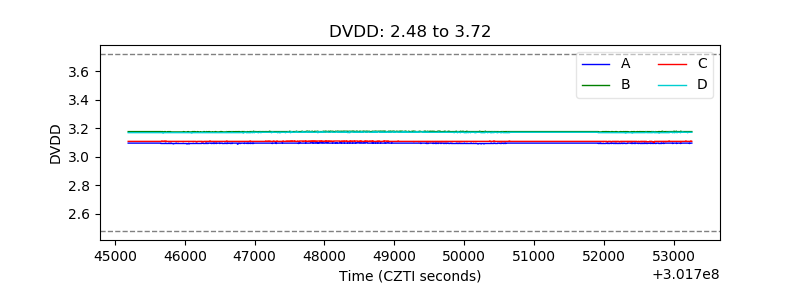 |
| Temperature 1 | 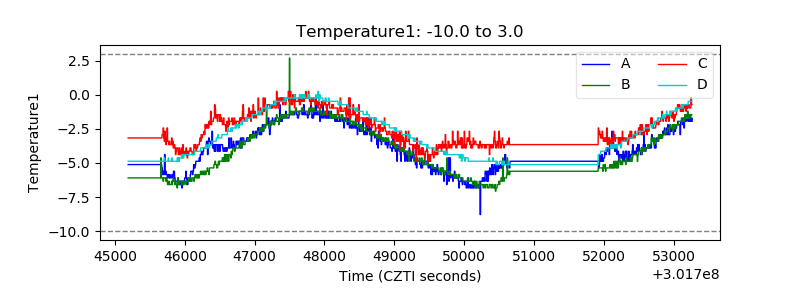 |
| Veto HV Monitor | 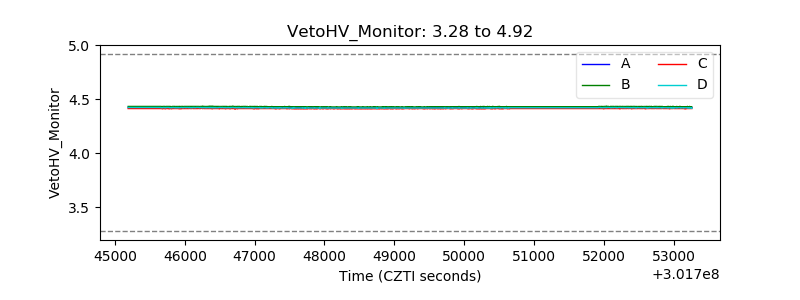 |
| Veto LLD |  |
| Alpha Counter | 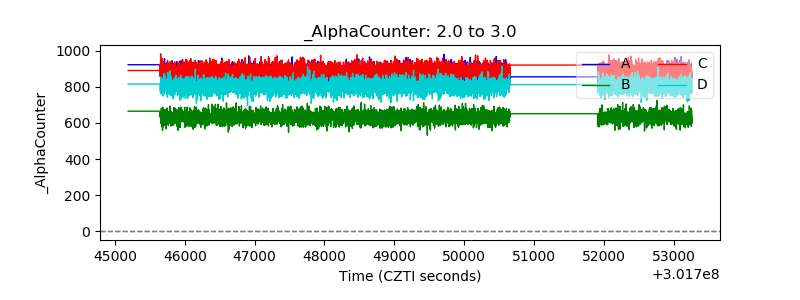 |
| _CPM_Rate | 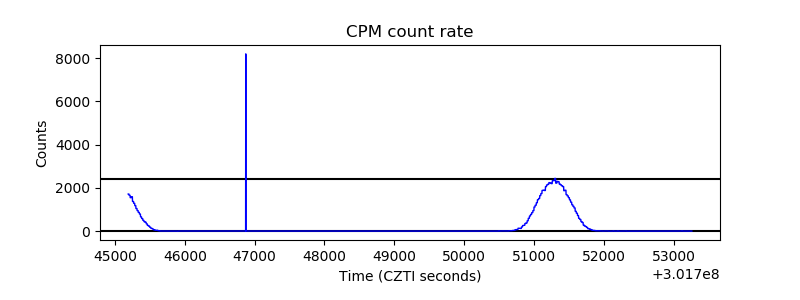 |
| CZT Counter |  |
| +2.5 Volts monitor |  |
| +5 Volts monitor | 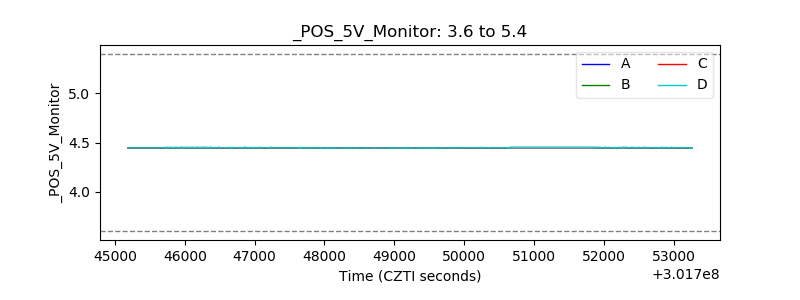 |
| _ROLL_ROT | 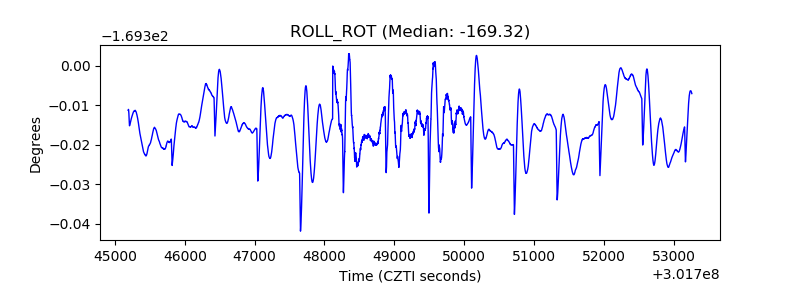 |
| _Roll_DEC | 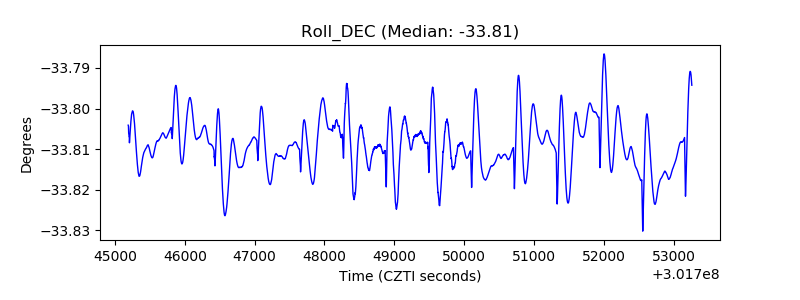 |
| _Roll_RA |  |
| Veto Counter | 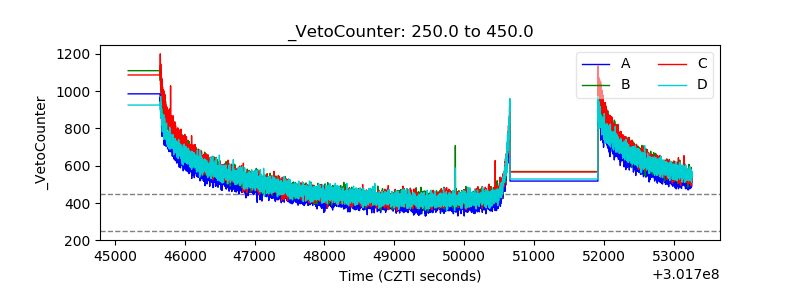 |