| Param | Original file | Final file |
|---|---|---|
| Filename | modeM0/AS1A05_229T02_9000003060_20669cztM0_level2.evt | modeM0/AS1A05_229T02_9000003060_20669cztM0_level2_quad_clean.evt |
| Size (bytes) | 790,427,520 | 192,579,840 |
| Size | 753.8 MB | 183.7 MB |
| Events in quadrant A | 5,541,507 | 1,311,407 |
| Events in quadrant B | 6,014,474 | 1,310,197 |
| Events in quadrant C | 5,447,388 | 1,262,681 |
| Events in quadrant D | 6,245,647 | 1,243,337 |
| Mode M0 | |||
|---|---|---|---|
| Quadrant | BADHDUFLAG | Total packets | Discarded packets |
| A | 0 | 22881 | 2 |
| B | 0 | 24491 | 2 |
| C | 0 | 22679 | 2 |
| D | 0 | 24955 | 3 |
| Mode SS | |||
|---|---|---|---|
| Quadrant | BADHDUFLAG | Total packets | Discarded packets |
| A | 0 | 208 | 0 |
| B | 0 | 208 | 0 |
| C | 0 | 208 | 0 |
| D | 0 | 208 | 0 |
| Mode M9 | |||
|---|---|---|---|
| Quadrant | BADHDUFLAG | Total packets | Discarded packets |
| A | 0 | 26 | 0 |
| B | 0 | 26 | 0 |
| C | 0 | 26 | 0 |
| D | 0 | 26 | 0 |
| Quadrant | Total seconds | Saturated seconds | Saturation percentage |
|---|---|---|---|
| A | 10188 | 162 | 1.590106% |
| B | 10189 | 233 | 2.286780% |
| C | 10189 | 208 | 2.041417% |
| D | 10188 | 286 | 2.807224% |
Noise dominated data is calculated using 1-second bins in cleaned event files. If a bin has >2000 counts, and if more than 50% of those come from <1% of pixels, then it is considered to be noise-dominated and hence unusable.
| Quadrant | # 1 sec bins | Bins with >0 counts | Bins with >2000 counts | High rate bins dominated by noise | Noise dominated (total time) | Noise dominated (detector-on time) | Marked lightcurve |
|---|---|---|---|---|---|---|---|
| A | 12758 | 10189 | 10 | 10 | 0.08% | 0.10% | 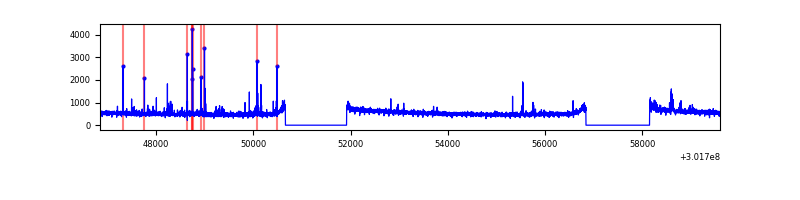 |
| B | 12759 | 10191 | 57 | 57 | 0.45% | 0.56% | 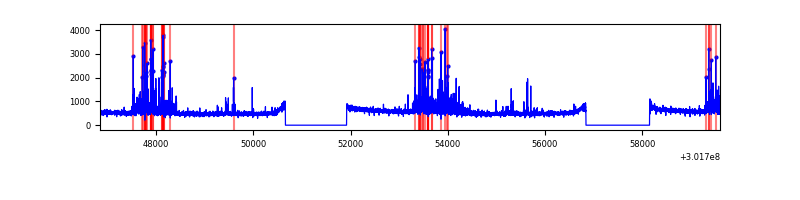 |
| C | 12759 | 10190 | 2 | 2 | 0.02% | 0.02% | 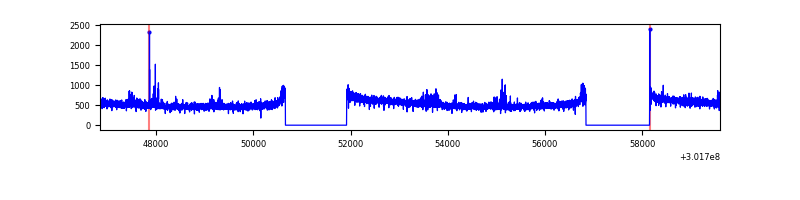 |
| D | 12758 | 10189 | 139 | 139 | 1.09% | 1.36% | 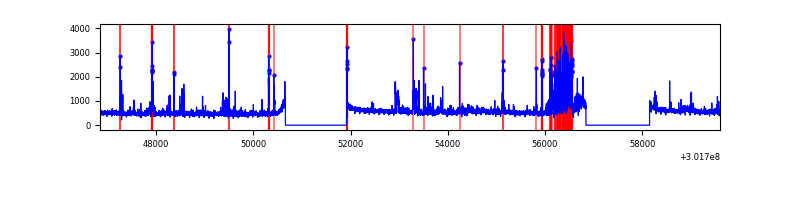 |
Top three noisy pixels from each quadrant. If the there are fewer than three noisy pixels in the level2.evt file, extra rows are filled as -1
| Pixel properties | Quadrant properties | ||||||
|---|---|---|---|---|---|---|---|
| Quadrant | DetID | PixID | Counts | Sigma | Mean | Median | Sigma |
| A | 9 | 143 | 80418 | 286.22 | 1390 | 1369 | 276.2 |
| A | 5 | 16 | 63987 | 226.73 | 1390 | 1369 | 276.2 |
| A | 13 | 252 | 36695 | 127.91 | 1390 | 1369 | 276.2 |
| B | 7 | 220 | 532317 | 2096.05 | 1363 | 1335 | 253.3 |
| B | 3 | 64 | 40680 | 155.31 | 1363 | 1335 | 253.3 |
| B | 12 | 111 | 28530 | 107.35 | 1363 | 1335 | 253.3 |
| C | 14 | 238 | 208541 | 689.76 | 1306 | 1319 | 300.4 |
| C | 8 | 208 | 94648 | 310.65 | 1306 | 1319 | 300.4 |
| C | 7 | 247 | 22361 | 70.04 | 1306 | 1319 | 300.4 |
| D | 1 | 20 | 853032 | 2679.27 | 1337 | 1302 | 317.9 |
| D | 13 | 153 | 120325 | 374.41 | 1337 | 1302 | 317.9 |
| D | 1 | 52 | 75767 | 234.24 | 1337 | 1302 | 317.9 |
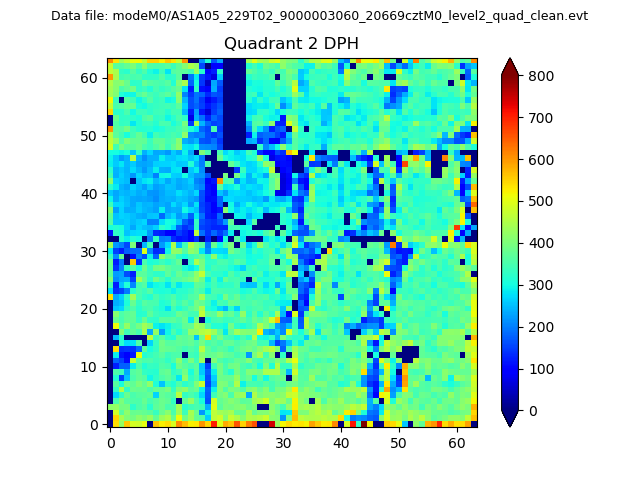
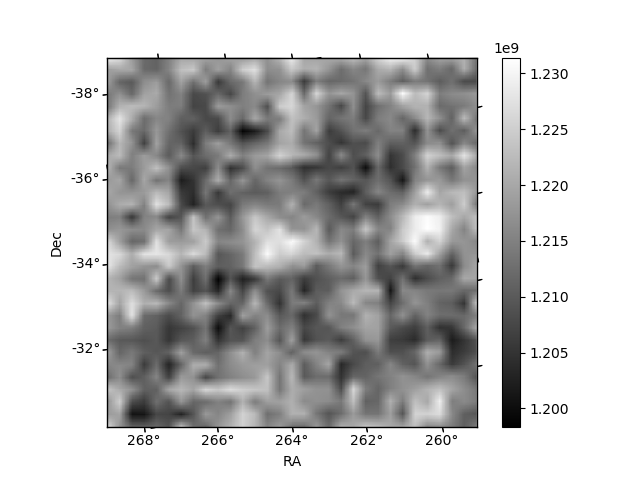
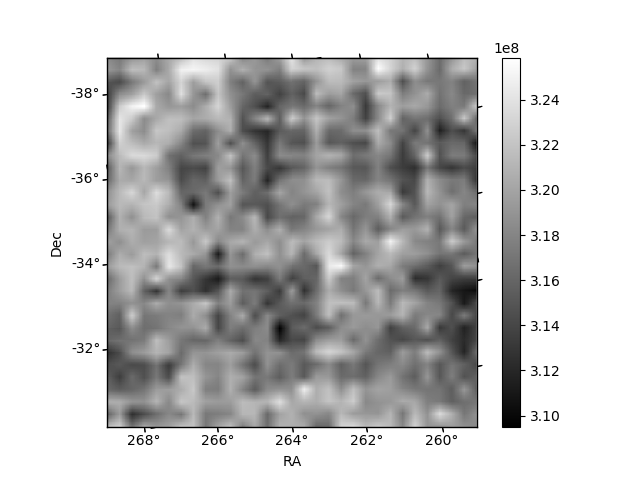
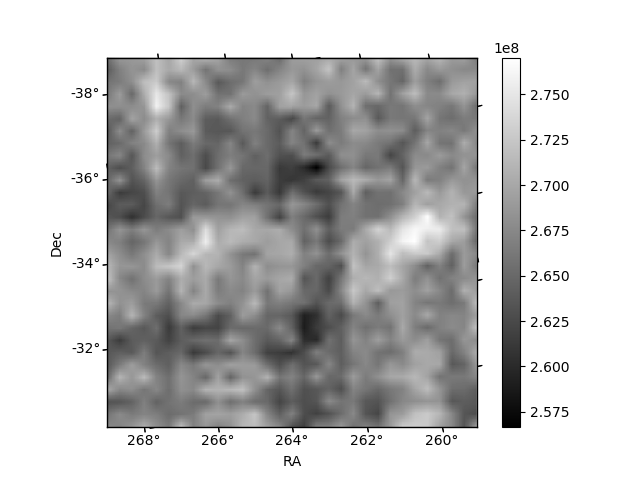
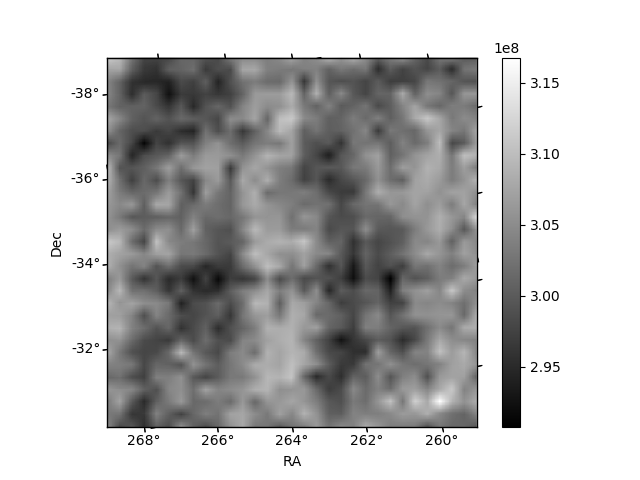
Histogram calculated using DETX and DETY for each event in the final _common_clean file
| Quadrant A | 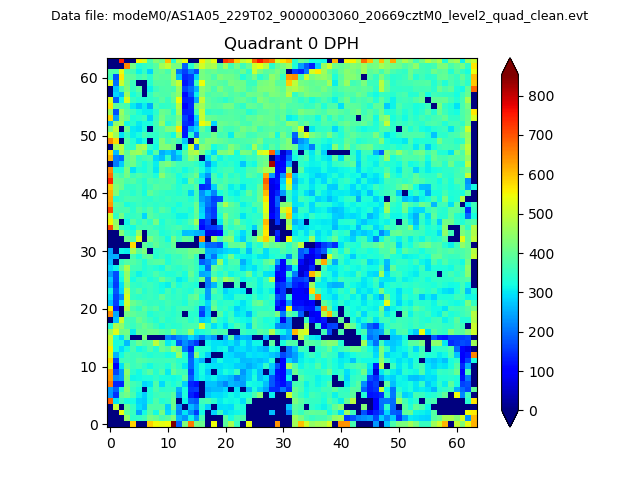 |
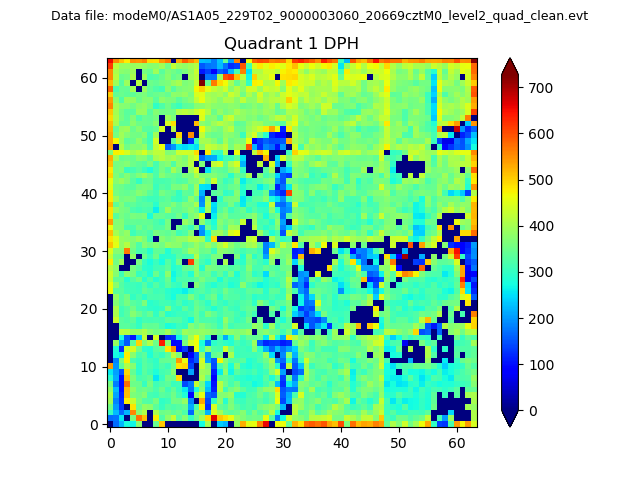 |
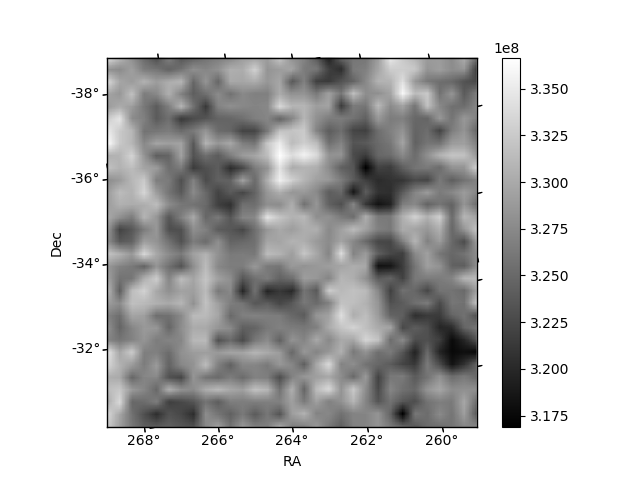
Quadrant B |
|---|---|---|---|
| Quadrant D | 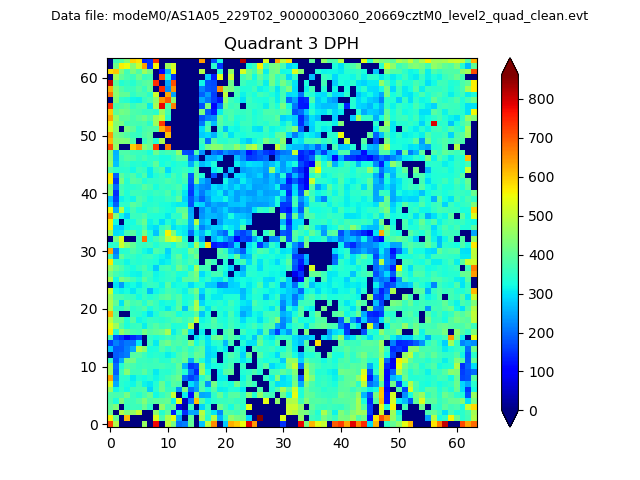 |
 |
Quadrant C |
| Plot type | Count rate plots | Images |
|---|---|---|
| Comparison with Poisson distribution Blue bars denote a histogram of data divided into 1 sec bins. Red curve is a Poisson curve with rate = median count rate of data. |
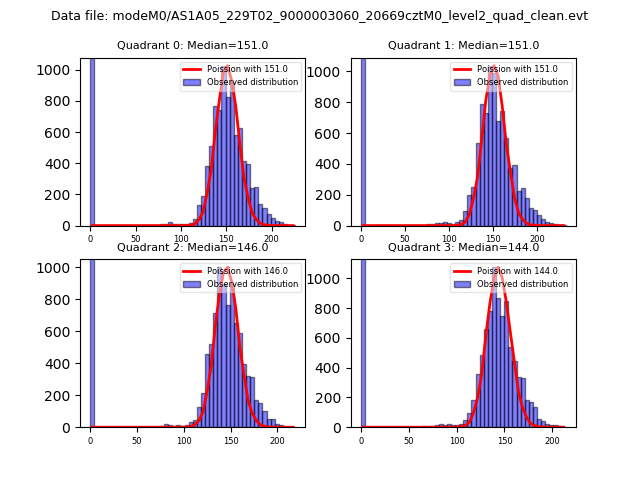 |
 |
| Quadrant-wise count rates Data is divided into 100 sec bins |
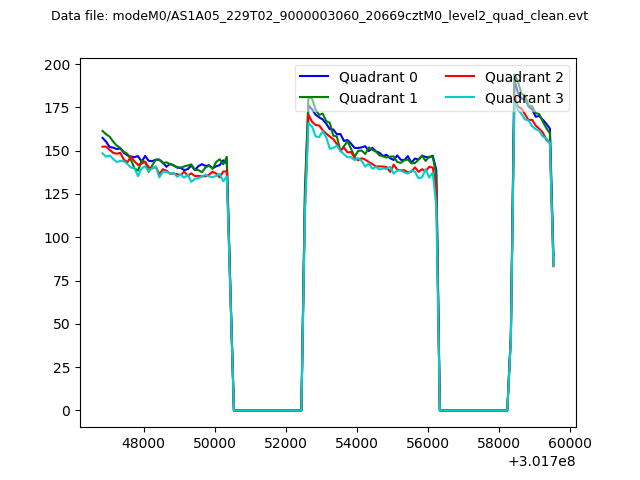 |
|
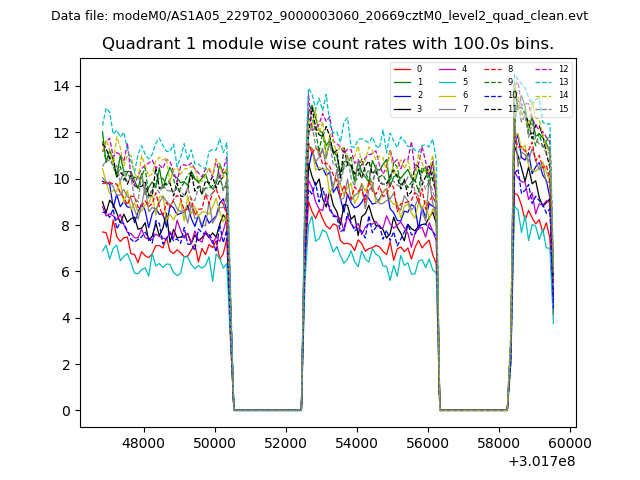
| Module-wise count rates for Quadrant A Data is divided into 100 sec bins |
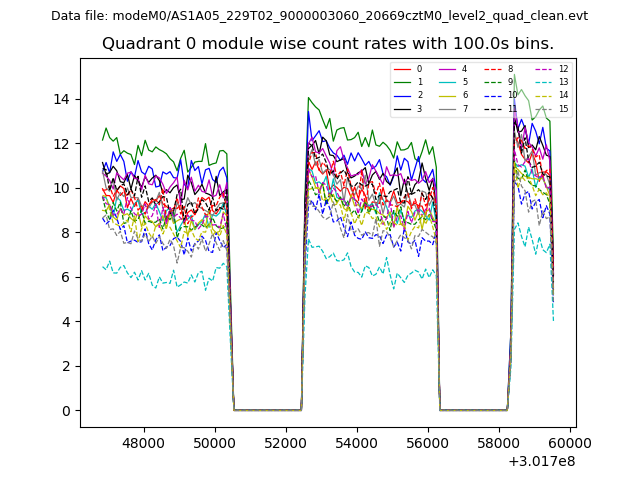 |
 |
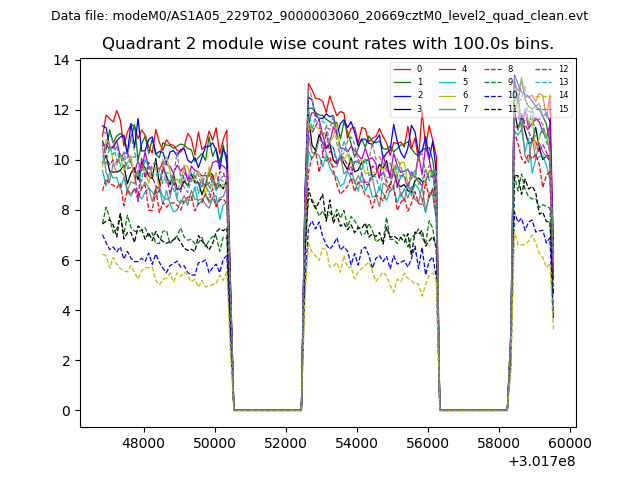
| Module-wise count rates for Quadrant B Data is divided into 100 sec bins |
 |
 |
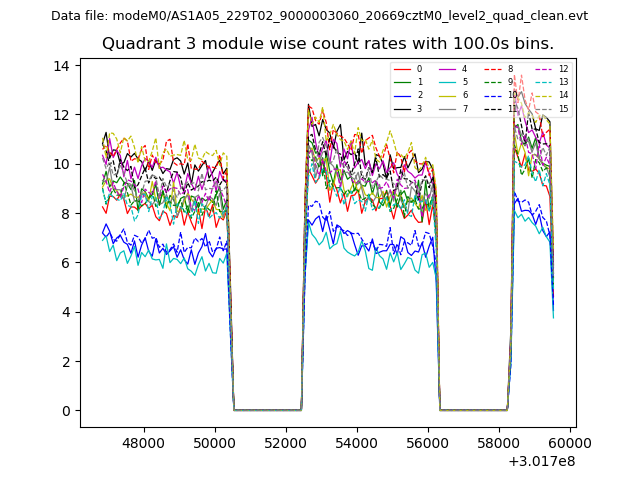
| Module-wise count rates for Quadrant C Data is divided into 100 sec bins |
 |
 |
| Module-wise count rates for Quadrant D Data is divided into 100 sec bins |
 |
 |
| Parameter | Plot |
|---|---|
| CZT HV Monitor | 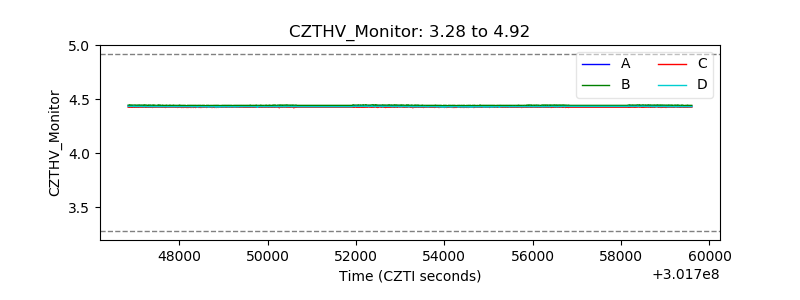 |
| D_VDD | 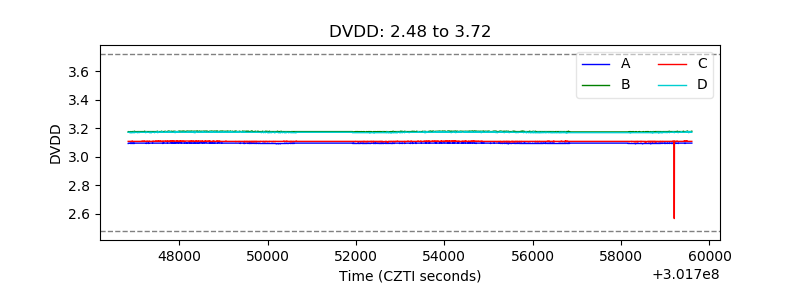 |
| Temperature 1 | 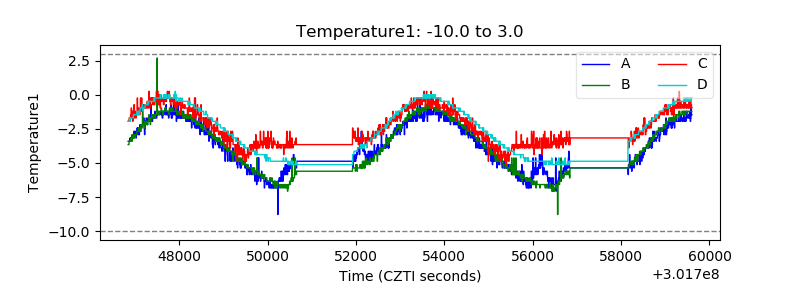 |
| Veto HV Monitor | 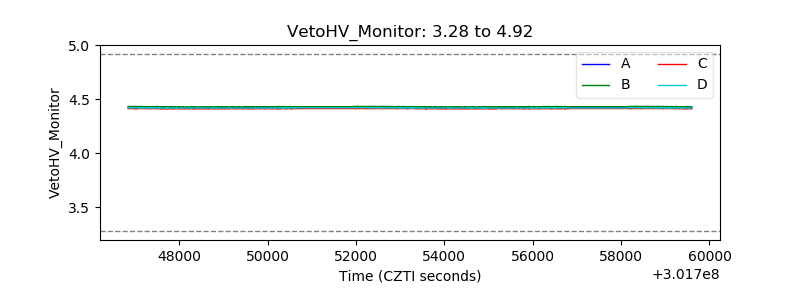 |
| Veto LLD | 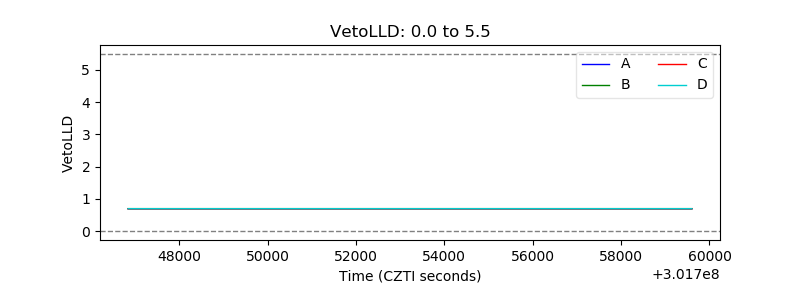 |
| Alpha Counter | 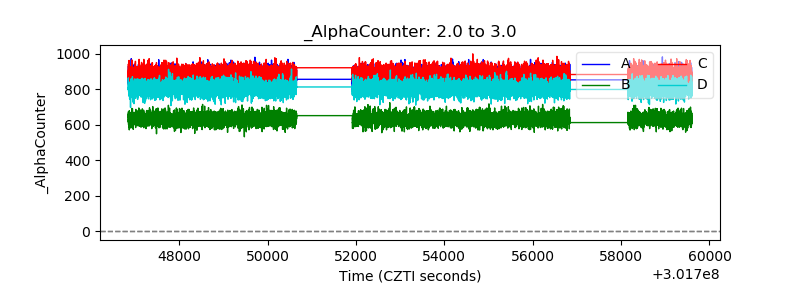 |
| _CPM_Rate | 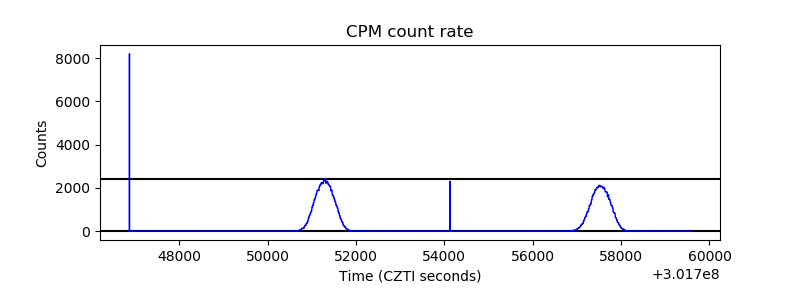 |
| CZT Counter | 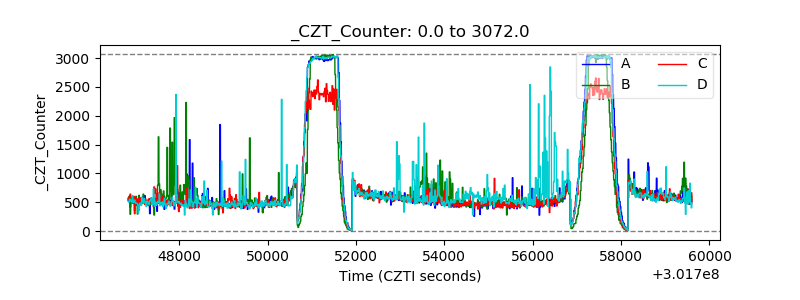 |
| +2.5 Volts monitor |  |
| +5 Volts monitor |  |
| _ROLL_ROT | 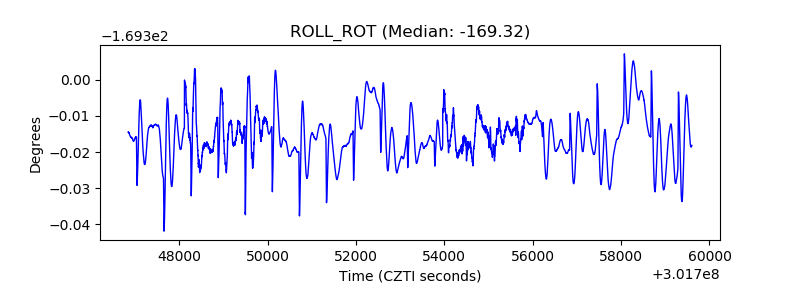 |
| _Roll_DEC | 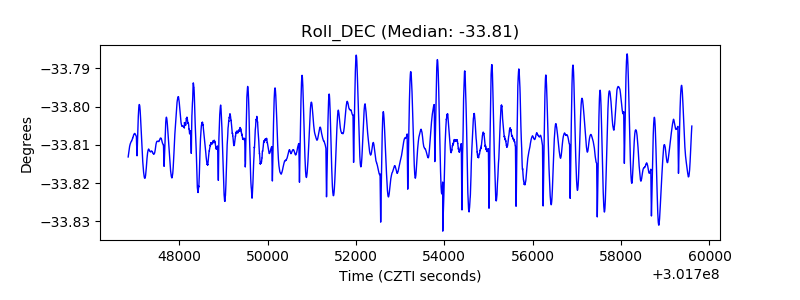 |
| _Roll_RA | 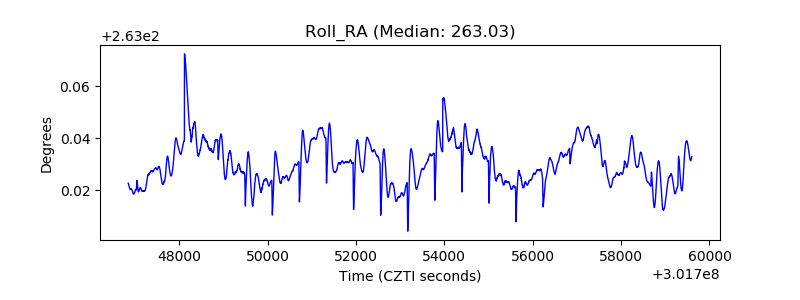 |
| Veto Counter | 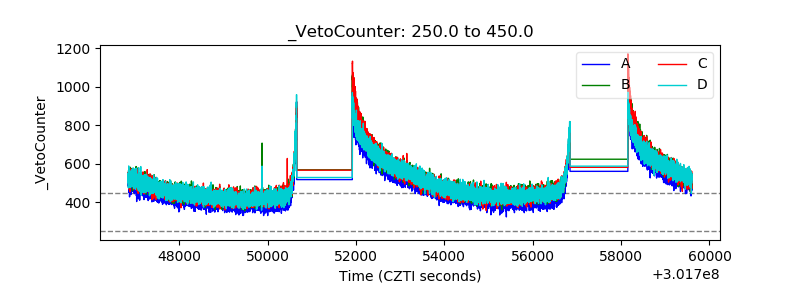 |