| Param | Original file | Final file |
|---|---|---|
| Filename | modeM0/AS1A05_229T02_9000003060_20671cztM0_level2.evt | modeM0/AS1A05_229T02_9000003060_20671cztM0_level2_quad_clean.evt |
| Size (bytes) | 533,954,880 | 113,921,280 |
| Size | 509.2 MB | 108.6 MB |
| Events in quadrant A | 3,520,773 | 779,640 |
| Events in quadrant B | 3,715,947 | 775,445 |
| Events in quadrant C | 3,390,190 | 743,101 |
| Events in quadrant D | 5,096,637 | 692,089 |
| Mode M0 | |||
|---|---|---|---|
| Quadrant | BADHDUFLAG | Total packets | Discarded packets |
| A | 0 | 14654 | 2 |
| B | 0 | 15381 | 2 |
| C | 0 | 14271 | 2 |
| D | 0 | 19581 | 2 |
| Mode SS | |||
|---|---|---|---|
| Quadrant | BADHDUFLAG | Total packets | Discarded packets |
| A | 0 | 134 | 0 |
| B | 0 | 134 | 0 |
| C | 0 | 134 | 0 |
| D | 0 | 134 | 0 |
| Mode M9 | |||
|---|---|---|---|
| Quadrant | BADHDUFLAG | Total packets | Discarded packets |
| A | 0 | 13 | 0 |
| B | 0 | 14 | 0 |
| C | 0 | 14 | 0 |
| D | 0 | 14 | 0 |
| Quadrant | Total seconds | Saturated seconds | Saturation percentage |
|---|---|---|---|
| A | 6592 | 94 | 1.425971% |
| B | 6592 | 121 | 1.835558% |
| C | 6592 | 98 | 1.486650% |
| D | 6592 | 729 | 11.058859% |
Noise dominated data is calculated using 1-second bins in cleaned event files. If a bin has >2000 counts, and if more than 50% of those come from <1% of pixels, then it is considered to be noise-dominated and hence unusable.
| Quadrant | # 1 sec bins | Bins with >0 counts | Bins with >2000 counts | High rate bins dominated by noise | Noise dominated (total time) | Noise dominated (detector-on time) | Marked lightcurve |
|---|---|---|---|---|---|---|---|
| A | 7802 | 6593 | 24 | 24 | 0.31% | 0.36% | 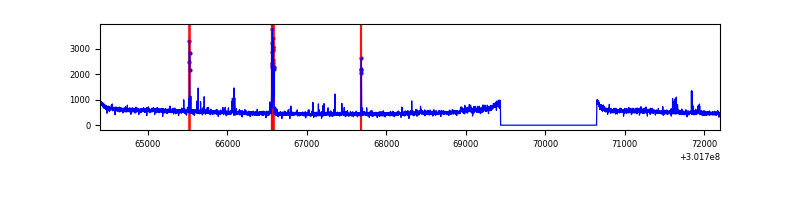 |
| B | 7802 | 6593 | 35 | 35 | 0.45% | 0.53% | 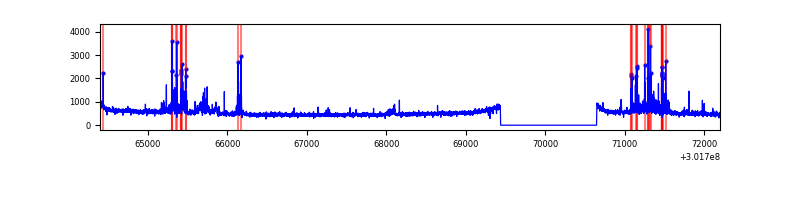 |
| C | 7802 | 6593 | 0 | 0 | 0.00% | 0.00% | 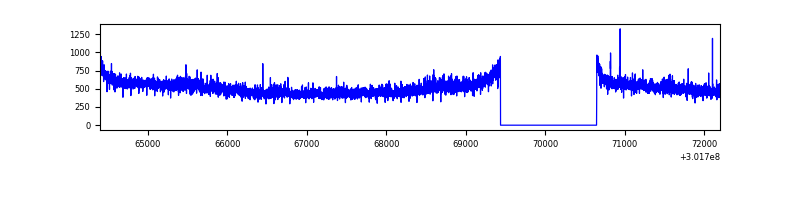 |
| D | 7802 | 6593 | 573 | 573 | 7.34% | 8.69% | 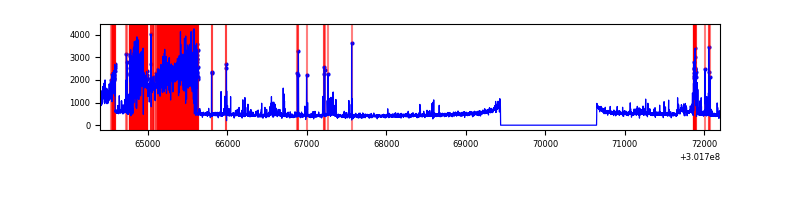 |
Top three noisy pixels from each quadrant. If the there are fewer than three noisy pixels in the level2.evt file, extra rows are filled as -1
| Pixel properties | Quadrant properties | ||||||
|---|---|---|---|---|---|---|---|
| Quadrant | DetID | PixID | Counts | Sigma | Mean | Median | Sigma |
| A | 5 | 16 | 111063 | 628.71 | 867 | 854 | 175.3 |
| A | 12 | 16 | 42937 | 240.07 | 867 | 854 | 175.3 |
| A | 9 | 143 | 18099 | 98.38 | 867 | 854 | 175.3 |
| B | 7 | 220 | 226222 | 1389.21 | 852 | 834 | 162.2 |
| B | 0 | 190 | 58124 | 353.11 | 852 | 834 | 162.2 |
| B | 4 | 216 | 43277 | 261.6 | 852 | 834 | 162.2 |
| C | 14 | 238 | 130144 | 687.64 | 813 | 819 | 188.1 |
| C | 8 | 208 | 56187 | 294.4 | 813 | 819 | 188.1 |
| C | 7 | 247 | 30389 | 157.23 | 813 | 819 | 188.1 |
| D | 1 | 20 | 1663235 | 8493.51 | 806 | 787 | 195.7 |
| D | 7 | 38 | 130851 | 664.5 | 806 | 787 | 195.7 |
| D | 13 | 153 | 110564 | 560.85 | 806 | 787 | 195.7 |
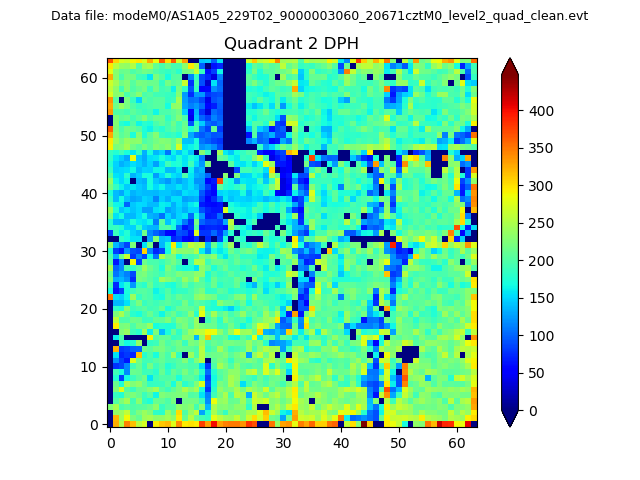
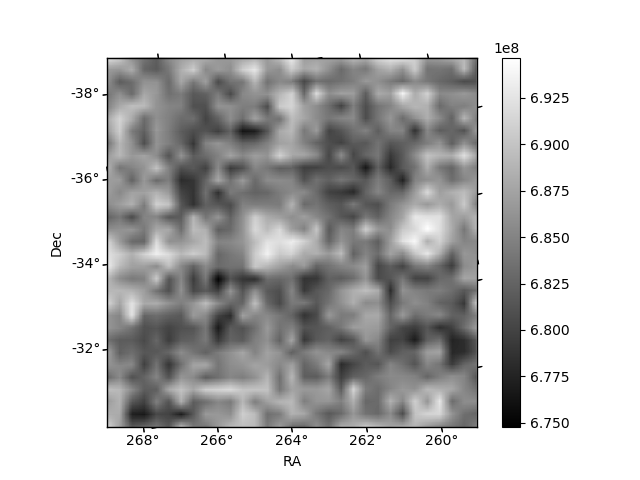
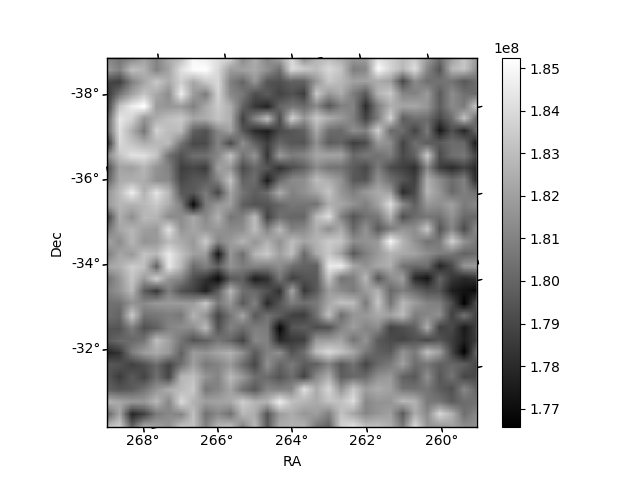
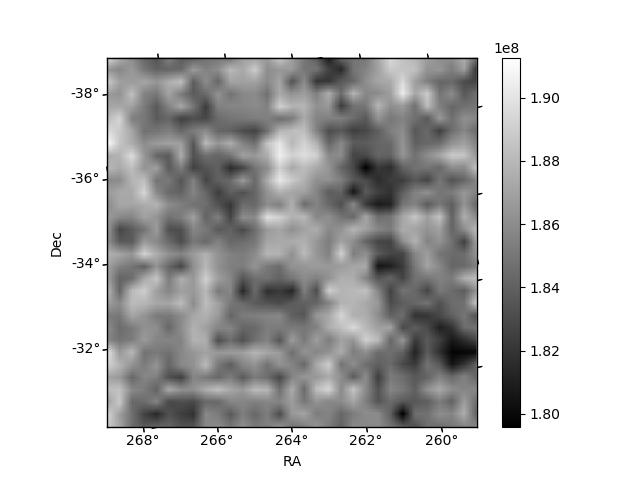
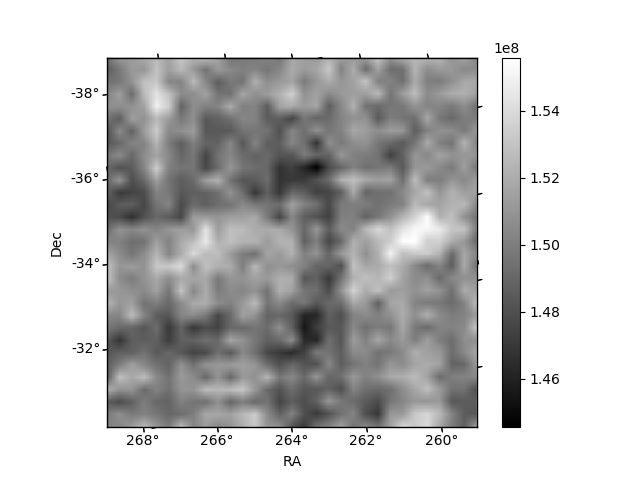
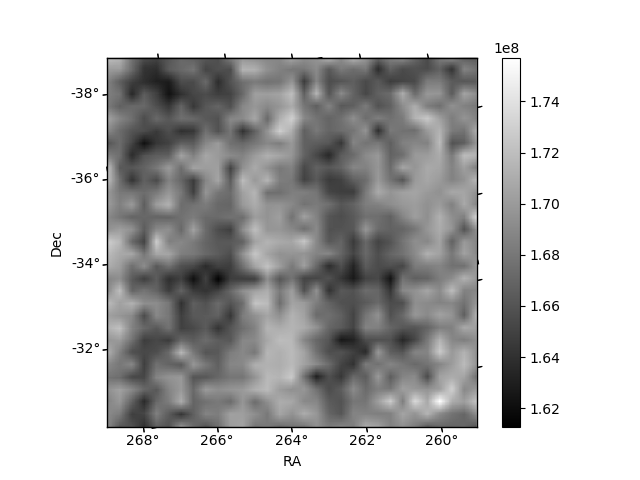
Histogram calculated using DETX and DETY for each event in the final _common_clean file
| Quadrant A | 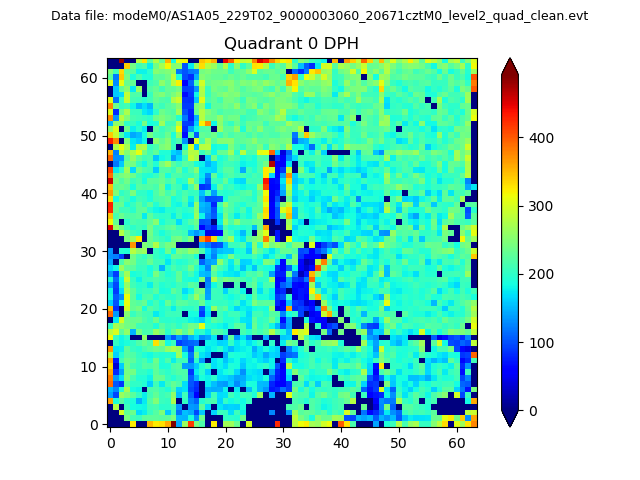 |
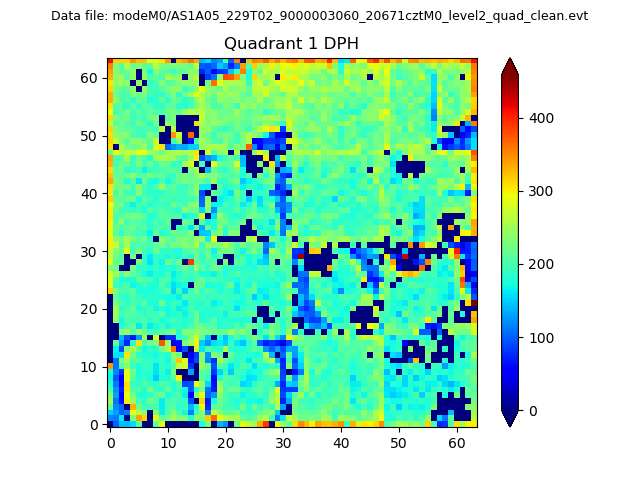 |
Quadrant B |
|---|---|---|---|
| Quadrant D | 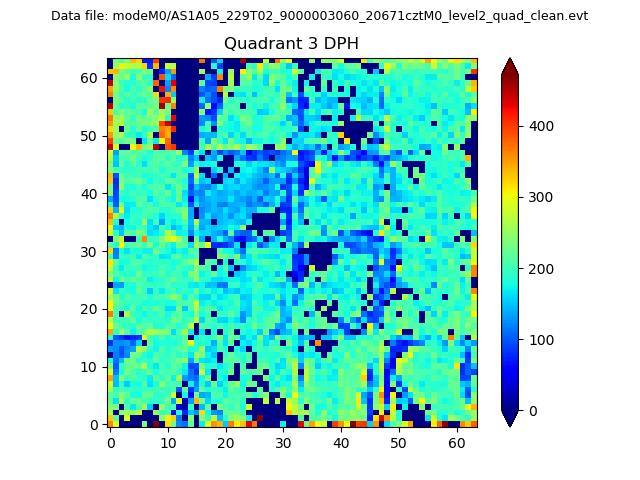 |
 |
Quadrant C |
| Plot type | Count rate plots | Images |
|---|---|---|
| Comparison with Poisson distribution Blue bars denote a histogram of data divided into 1 sec bins. Red curve is a Poisson curve with rate = median count rate of data. |
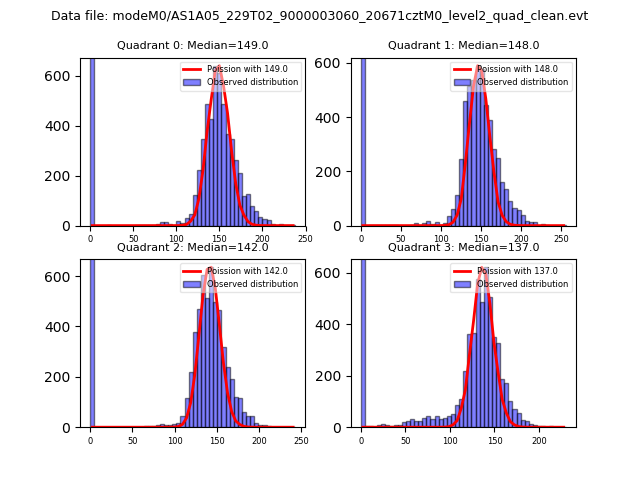 |
 |
| Quadrant-wise count rates Data is divided into 100 sec bins |
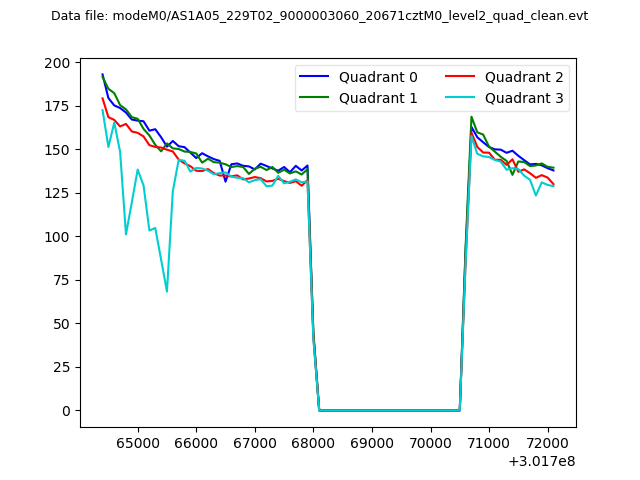 |
|
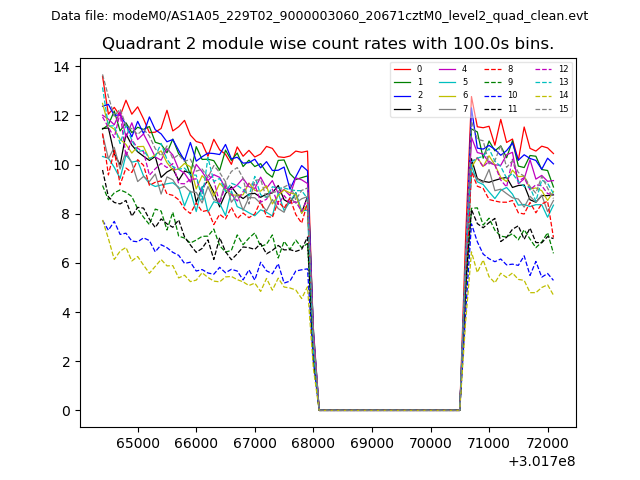
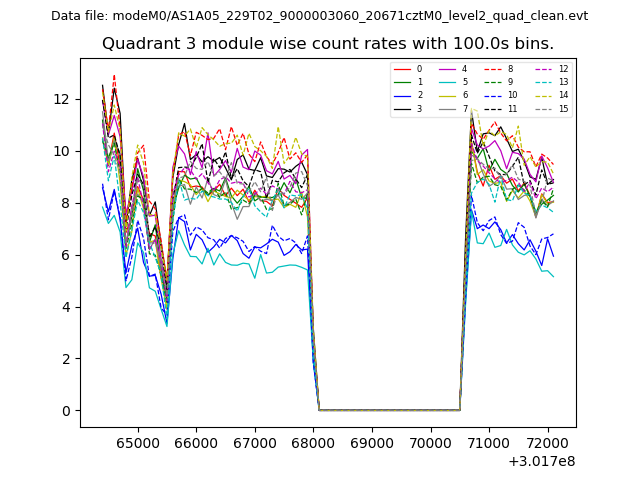
| Module-wise count rates for Quadrant A Data is divided into 100 sec bins |
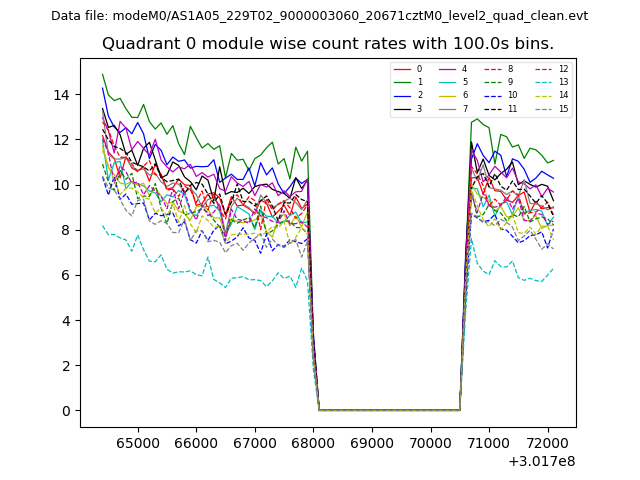 |
 |
| Module-wise count rates for Quadrant B Data is divided into 100 sec bins |
 |
 |
| Module-wise count rates for Quadrant C Data is divided into 100 sec bins |
 |
 |
| Module-wise count rates for Quadrant D Data is divided into 100 sec bins |
 |
 |
| Parameter | Plot |
|---|---|
| CZT HV Monitor | 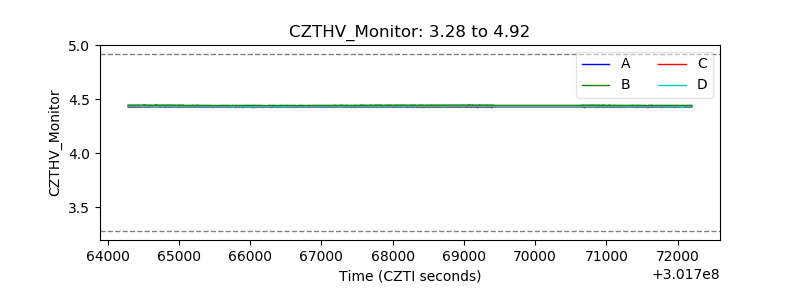 |
| D_VDD | 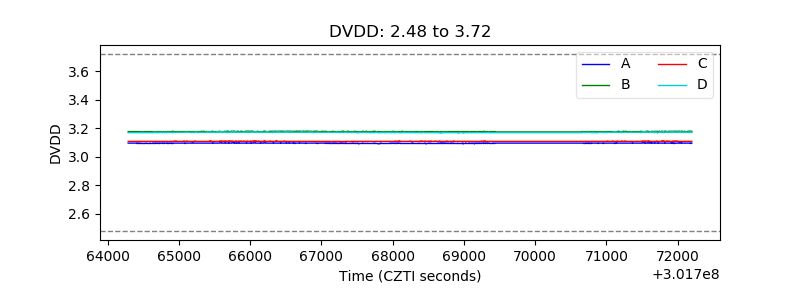 |
| Temperature 1 |  |
| Veto HV Monitor | 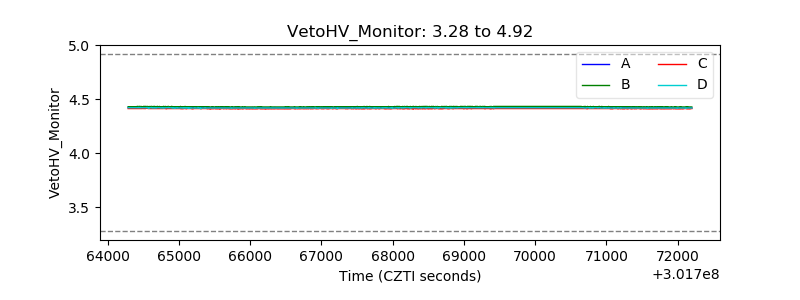 |
| Veto LLD | 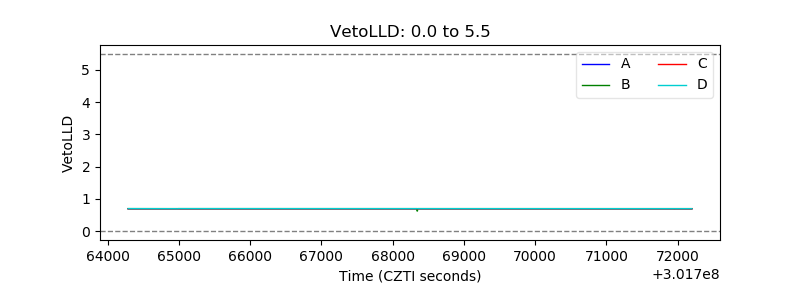 |
| Alpha Counter | 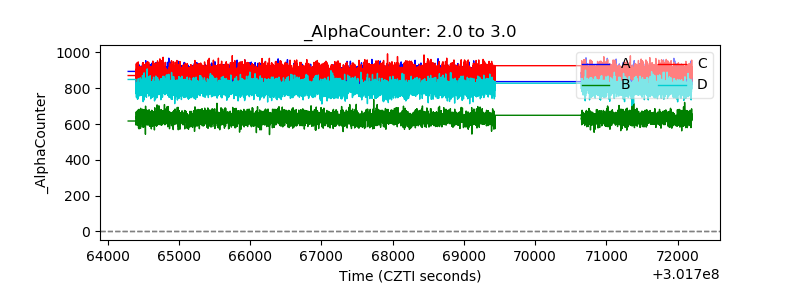 |
| _CPM_Rate | 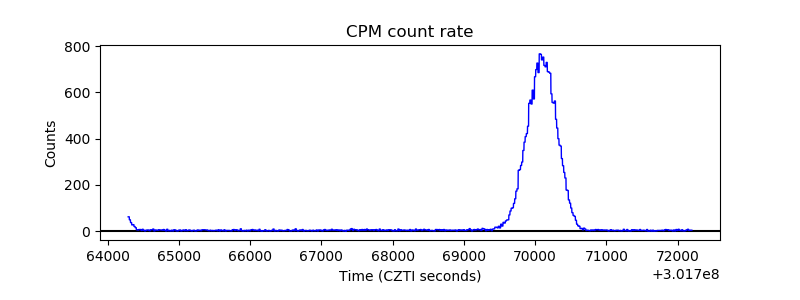 |
| CZT Counter | 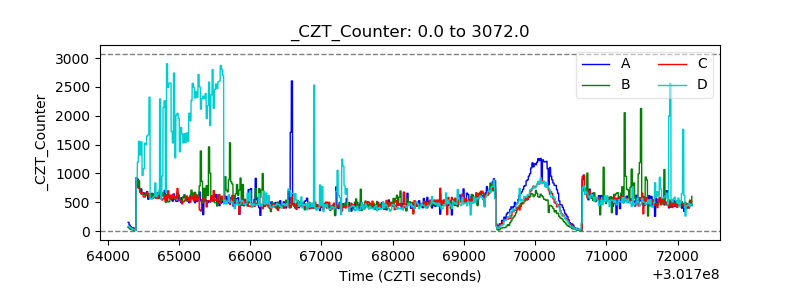 |
| +2.5 Volts monitor |  |
| +5 Volts monitor | 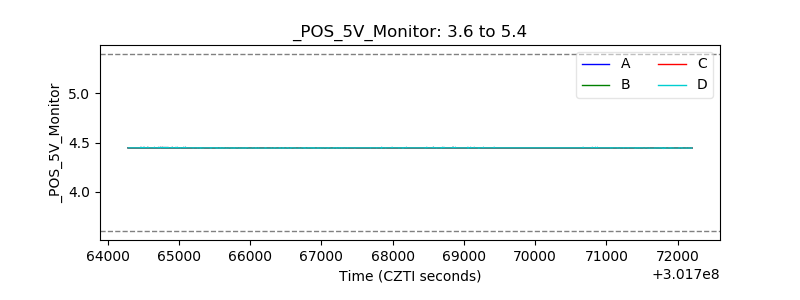 |
| _ROLL_ROT |  |
| _Roll_DEC | 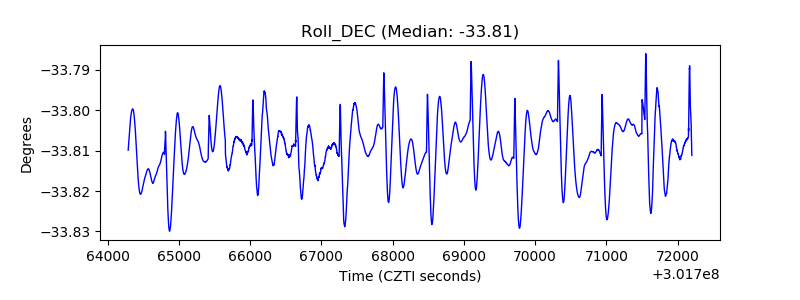 |
| _Roll_RA | 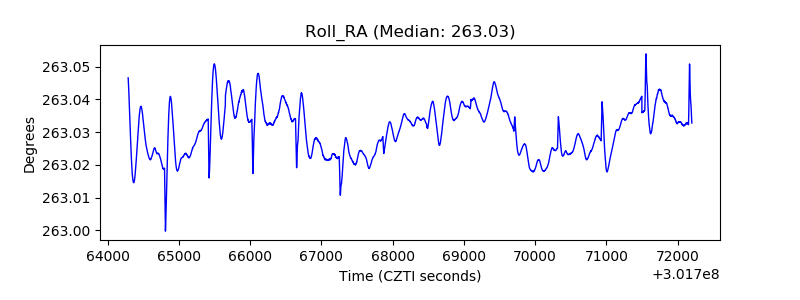 |
| Veto Counter | 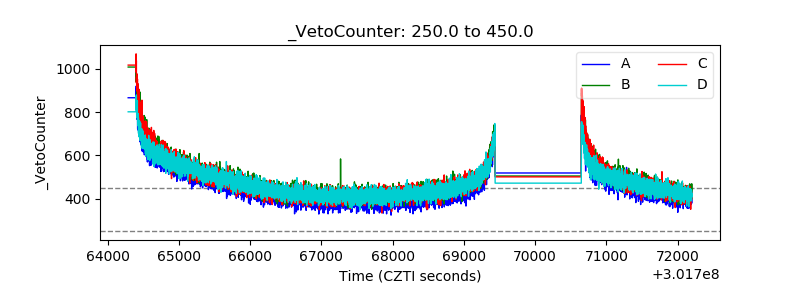 |