| Param | Original file | Final file |
|---|---|---|
| Filename | modeM0/AS1A05_229T02_9000003060_20672cztM0_level2.evt | modeM0/AS1A05_229T02_9000003060_20672cztM0_level2_quad_clean.evt |
| Size (bytes) | 505,788,480 | 100,500,480 |
| Size | 482.4 MB | 95.8 MB |
| Events in quadrant A | 3,406,638 | 666,643 |
| Events in quadrant B | 3,782,879 | 661,923 |
| Events in quadrant C | 3,405,283 | 639,995 |
| Events in quadrant D | 4,256,990 | 596,715 |
| Mode M0 | |||
|---|---|---|---|
| Quadrant | BADHDUFLAG | Total packets | Discarded packets |
| A | 0 | 14555 | 2 |
| B | 0 | 15789 | 2 |
| C | 0 | 14464 | 2 |
| D | 0 | 17254 | 2 |
| Mode SS | |||
|---|---|---|---|
| Quadrant | BADHDUFLAG | Total packets | Discarded packets |
| A | 0 | 138 | 0 |
| B | 0 | 138 | 0 |
| C | 0 | 138 | 0 |
| D | 0 | 138 | 0 |
| Mode M9 | |||
|---|---|---|---|
| Quadrant | BADHDUFLAG | Total packets | Discarded packets |
| A | 0 | 11 | 0 |
| B | 0 | 12 | 0 |
| C | 0 | 12 | 0 |
| D | 0 | 12 | 0 |
| Quadrant | Total seconds | Saturated seconds | Saturation percentage |
|---|---|---|---|
| A | 6868 | 40 | 0.582411% |
| B | 6867 | 116 | 1.689238% |
| C | 6867 | 54 | 0.786370% |
| D | 6867 | 397 | 5.781273% |
Noise dominated data is calculated using 1-second bins in cleaned event files. If a bin has >2000 counts, and if more than 50% of those come from <1% of pixels, then it is considered to be noise-dominated and hence unusable.
| Quadrant | # 1 sec bins | Bins with >0 counts | Bins with >2000 counts | High rate bins dominated by noise | Noise dominated (total time) | Noise dominated (detector-on time) | Marked lightcurve |
|---|---|---|---|---|---|---|---|
| A | 7819 | 6869 | 3 | 3 | 0.04% | 0.04% | 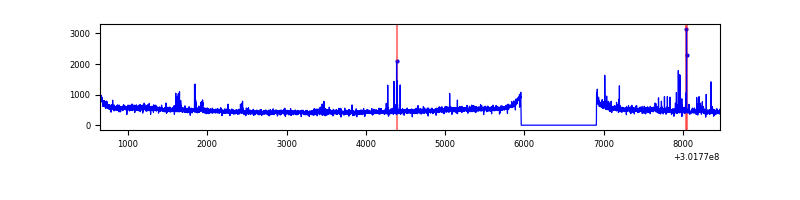 |
| B | 7818 | 6868 | 42 | 42 | 0.54% | 0.61% | 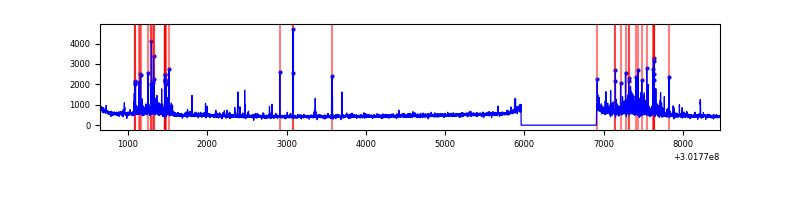 |
| C | 7818 | 6868 | 0 | 0 | 0.00% | 0.00% | 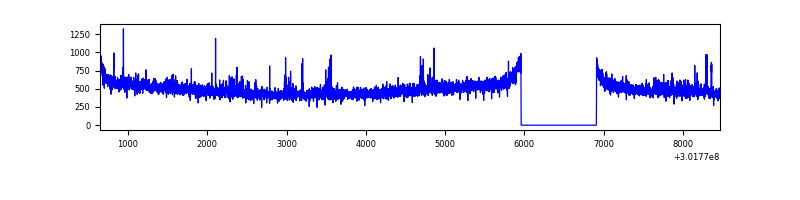 |
| D | 7818 | 6868 | 271 | 271 | 3.47% | 3.95% | 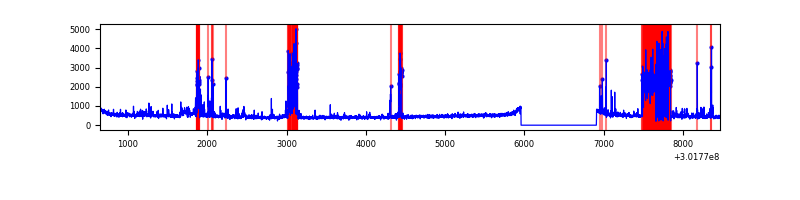 |
Top three noisy pixels from each quadrant. If the there are fewer than three noisy pixels in the level2.evt file, extra rows are filled as -1
| Pixel properties | Quadrant properties | ||||||
|---|---|---|---|---|---|---|---|
| Quadrant | DetID | PixID | Counts | Sigma | Mean | Median | Sigma |
| A | 9 | 143 | 57516 | 324.54 | 859 | 843 | 174.6 |
| A | 5 | 16 | 28901 | 160.67 | 859 | 843 | 174.6 |
| A | 8 | 205 | 9655 | 50.46 | 859 | 843 | 174.6 |
| B | 7 | 220 | 338703 | 2084.61 | 849 | 830 | 162.1 |
| B | 0 | 190 | 42747 | 258.62 | 849 | 830 | 162.1 |
| B | 0 | 197 | 26933 | 161.05 | 849 | 830 | 162.1 |
| C | 14 | 238 | 127625 | 674.12 | 808 | 813 | 188.1 |
| C | 8 | 208 | 74350 | 390.91 | 808 | 813 | 188.1 |
| C | 7 | 247 | 46369 | 242.17 | 808 | 813 | 188.1 |
| D | 1 | 20 | 662404 | 3425.62 | 796 | 775 | 193.1 |
| D | 13 | 153 | 295008 | 1523.41 | 796 | 775 | 193.1 |
| D | 7 | 38 | 117874 | 606.29 | 796 | 775 | 193.1 |
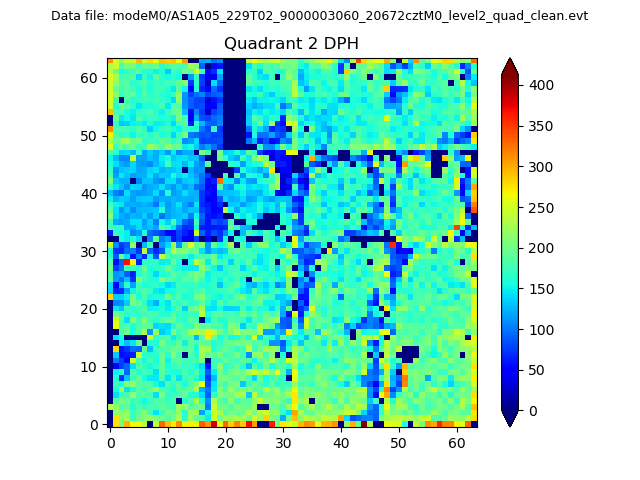
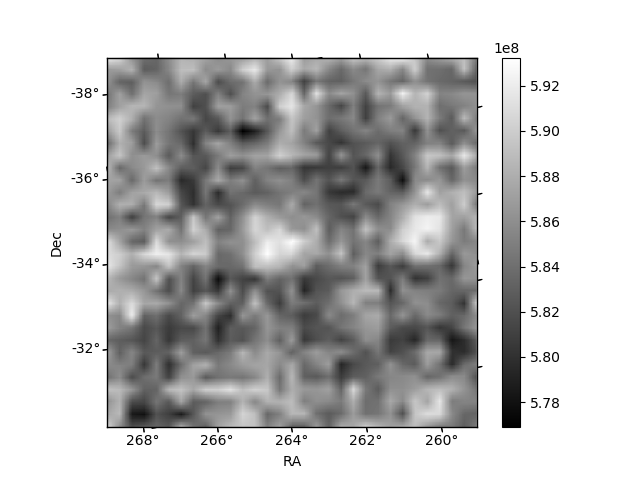
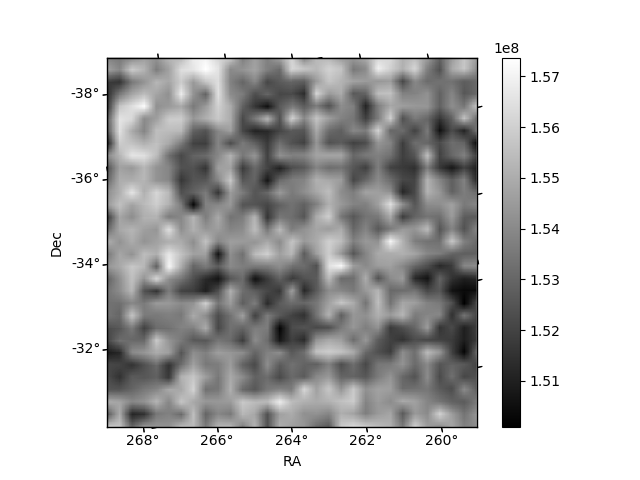
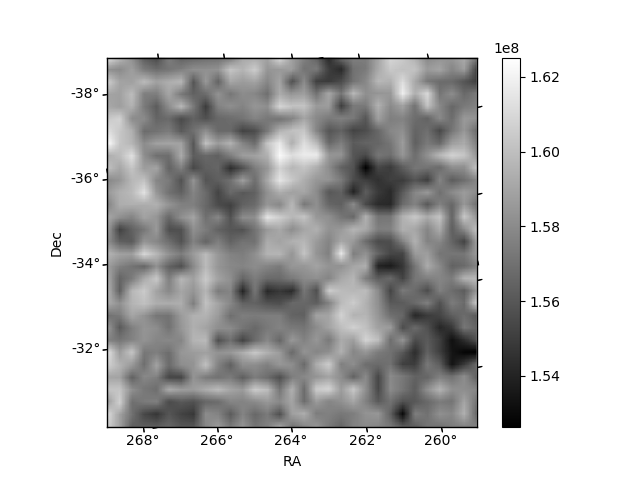
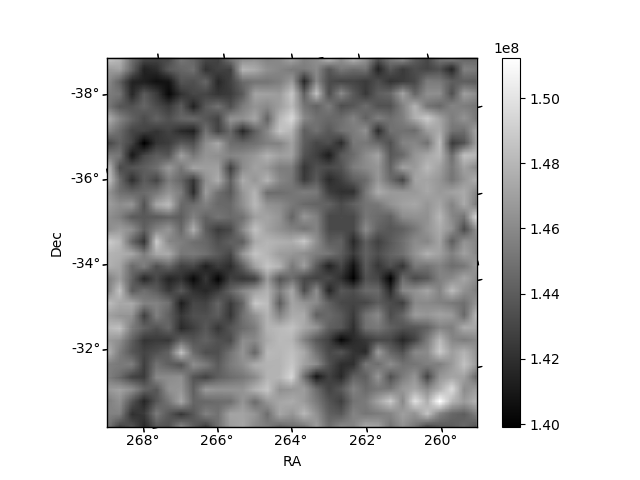
Histogram calculated using DETX and DETY for each event in the final _common_clean file
| Quadrant A | 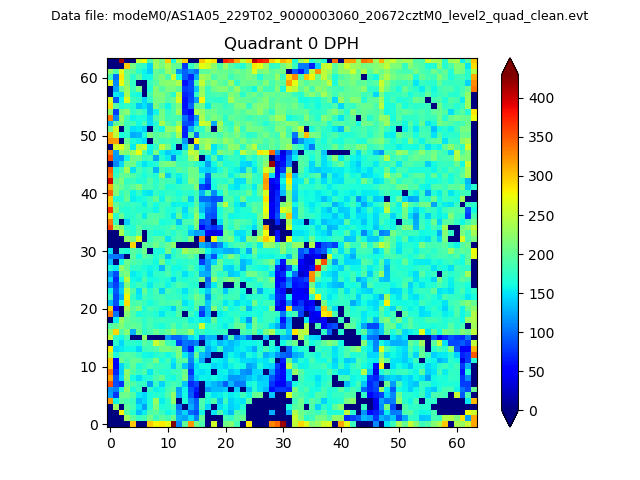 |
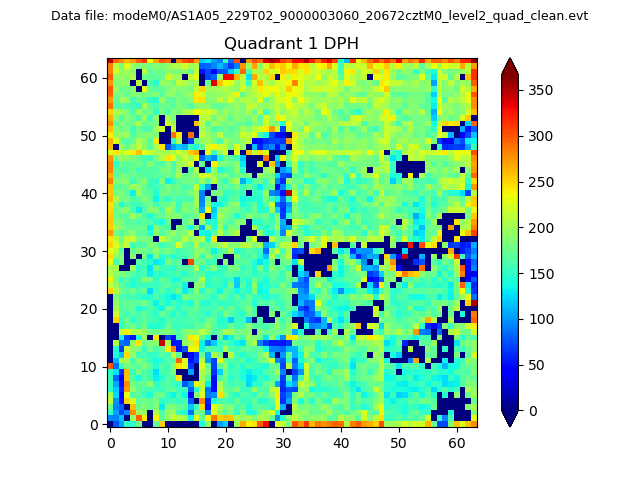 |
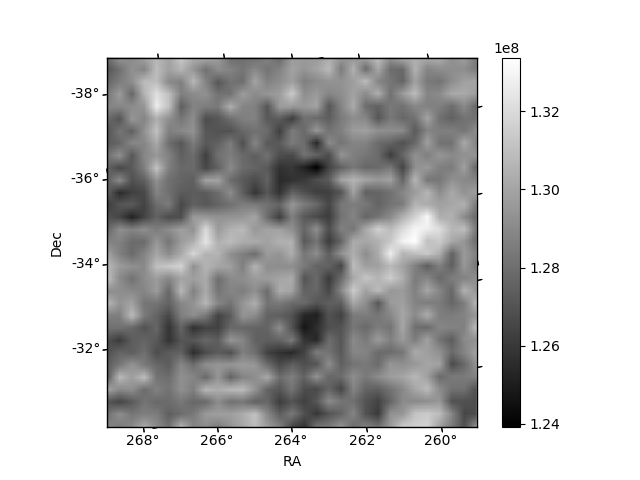
Quadrant B |
|---|---|---|---|
| Quadrant D | 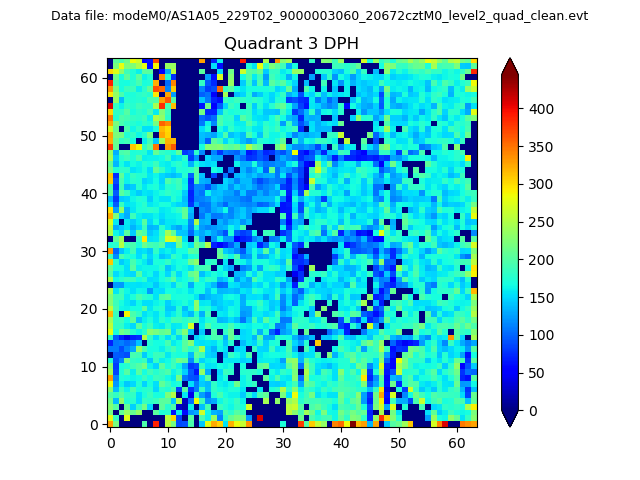 |
 |
Quadrant C |
| Plot type | Count rate plots | Images |
|---|---|---|
| Comparison with Poisson distribution Blue bars denote a histogram of data divided into 1 sec bins. Red curve is a Poisson curve with rate = median count rate of data. |
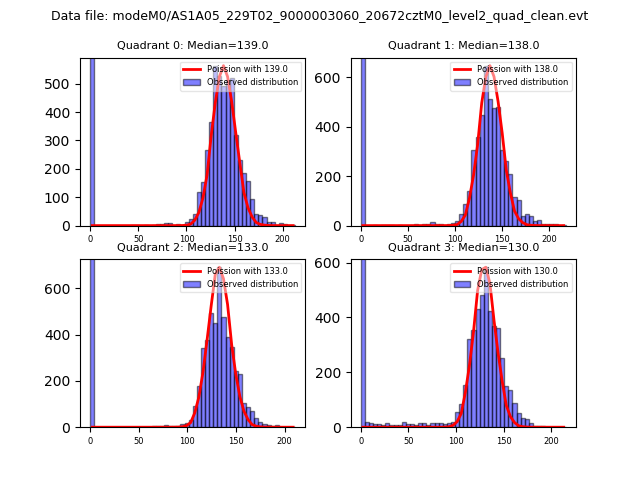 |
 |
| Quadrant-wise count rates Data is divided into 100 sec bins |
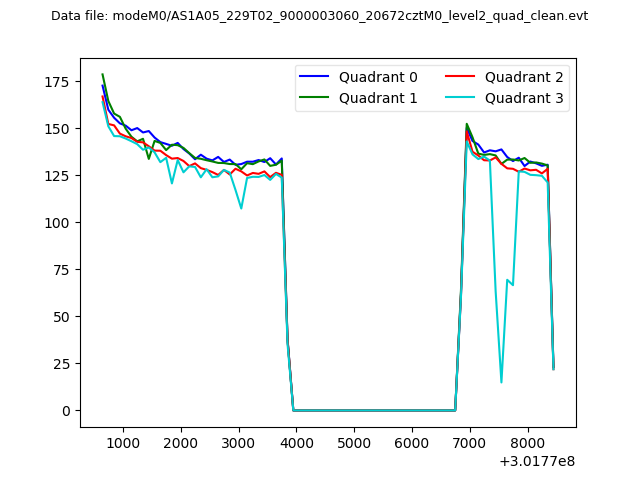 |
|
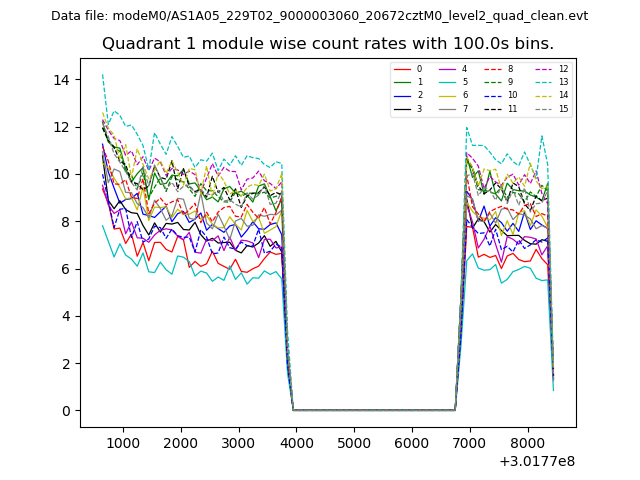
| Module-wise count rates for Quadrant A Data is divided into 100 sec bins |
 |
 |
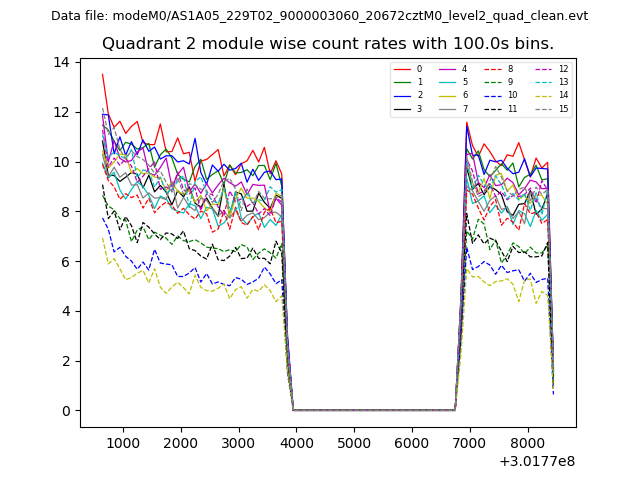
| Module-wise count rates for Quadrant B Data is divided into 100 sec bins |
 |
 |
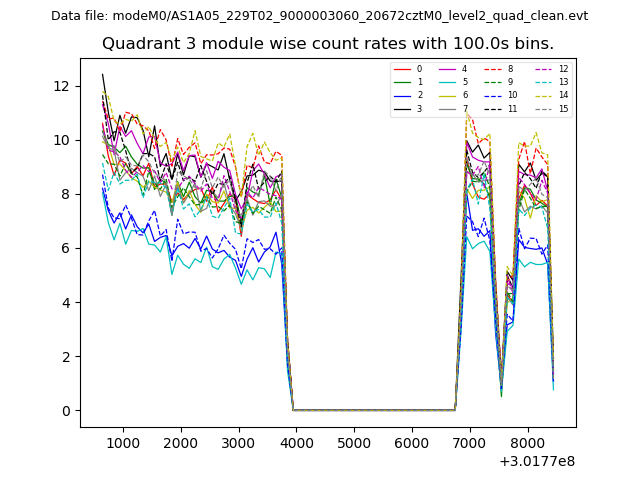
| Module-wise count rates for Quadrant C Data is divided into 100 sec bins |
 |
 |
| Module-wise count rates for Quadrant D Data is divided into 100 sec bins |
 |
 |
| Parameter | Plot |
|---|---|
| CZT HV Monitor | 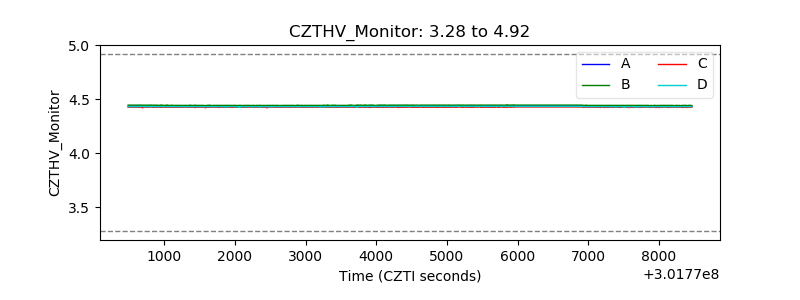 |
| D_VDD |  |
| Temperature 1 | 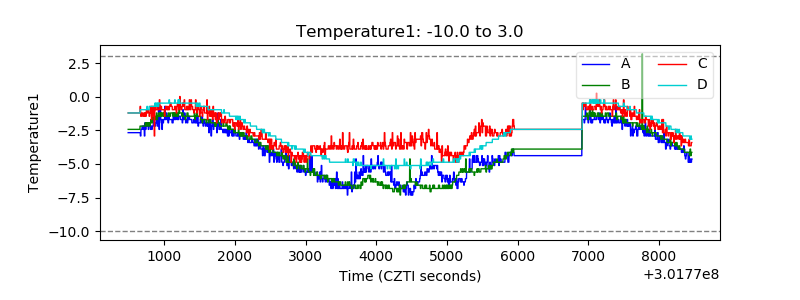 |
| Veto HV Monitor | 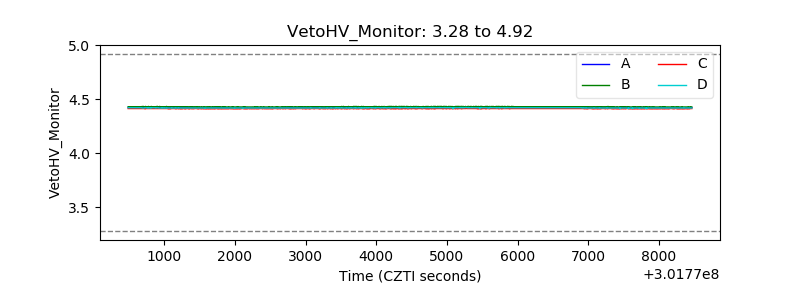 |
| Veto LLD |  |
| Alpha Counter | 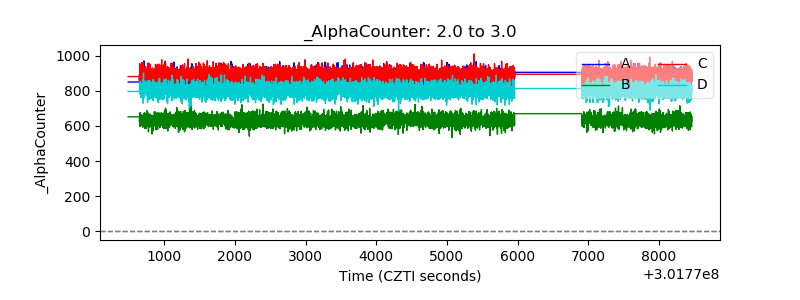 |
| _CPM_Rate | 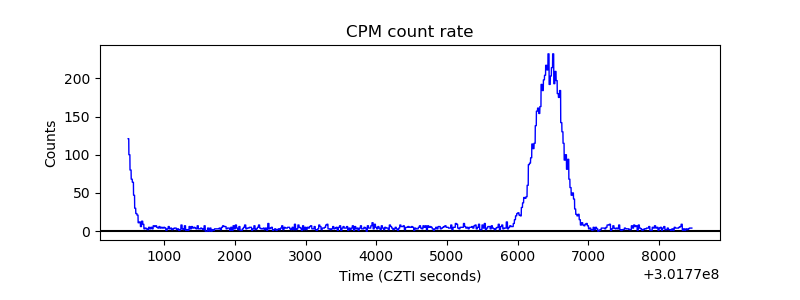 |
| CZT Counter | 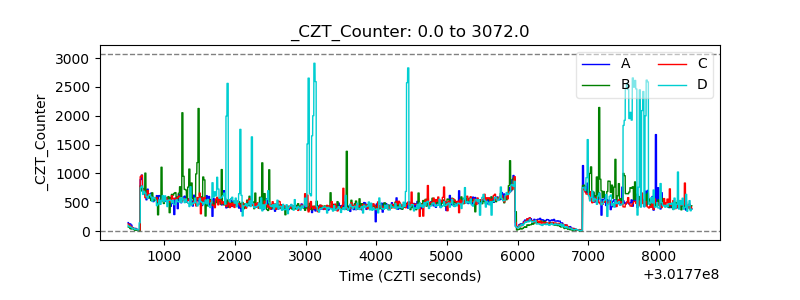 |
| +2.5 Volts monitor |  |
| +5 Volts monitor | 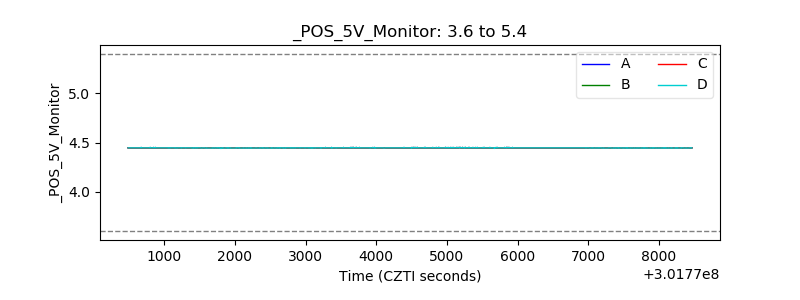 |
| _ROLL_ROT |  |
| _Roll_DEC | 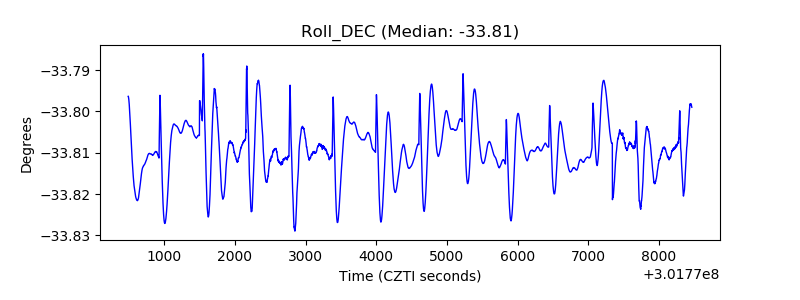 |
| _Roll_RA | 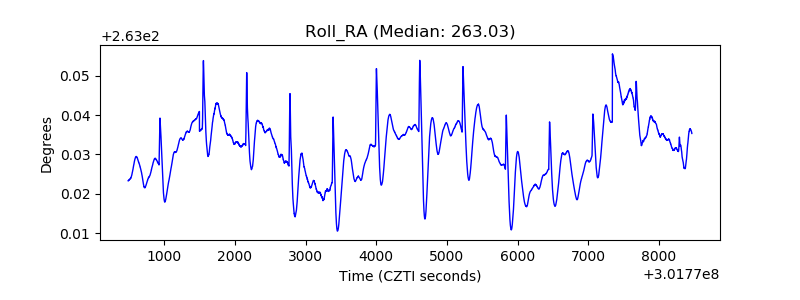 |
| Veto Counter | 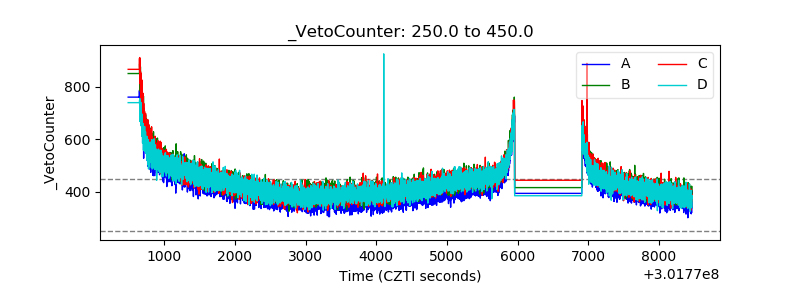 |