| Param | Original file | Final file |
|---|---|---|
| Filename | modeM0/AS1A05_229T02_9000003060_20673cztM0_level2.evt | modeM0/AS1A05_229T02_9000003060_20673cztM0_level2_quad_clean.evt |
| Size (bytes) | 233,490,240 | 46,376,640 |
| Size | 222.7 MB | 44.2 MB |
| Events in quadrant A | 1,608,983 | 299,281 |
| Events in quadrant B | 1,617,992 | 303,140 |
| Events in quadrant C | 1,666,183 | 289,234 |
| Events in quadrant D | 1,950,601 | 276,705 |
| Mode M0 | |||
|---|---|---|---|
| Quadrant | BADHDUFLAG | Total packets | Discarded packets |
| A | 0 | 9110 | 2236 |
| B | 0 | 8979 | 2106 |
| C | 0 | 9183 | 2142 |
| D | 0 | 10650 | 2587 |
| Mode SS | |||
|---|---|---|---|
| Quadrant | BADHDUFLAG | Total packets | Discarded packets |
| A | 0 | 90 | 24 |
| B | 0 | 92 | 22 |
| C | 0 | 91 | 25 |
| D | 0 | 87 | 17 |
| Mode M9 | |||
|---|---|---|---|
| Quadrant | BADHDUFLAG | Total packets | Discarded packets |
| A | 0 | 6 | 4 |
| B | 0 | 5 | 4 |
| C | 0 | 4 | 3 |
| D | 0 | 5 | 4 |
| Quadrant | Total seconds | Saturated seconds | Saturation percentage |
|---|---|---|---|
| A | 3308 | 12 | 0.362757% |
| B | 3319 | 5 | 0.150648% |
| C | 3319 | 20 | 0.602591% |
| D | 3309 | 112 | 3.384708% |
Noise dominated data is calculated using 1-second bins in cleaned event files. If a bin has >2000 counts, and if more than 50% of those come from <1% of pixels, then it is considered to be noise-dominated and hence unusable.
| Quadrant | # 1 sec bins | Bins with >0 counts | Bins with >2000 counts | High rate bins dominated by noise | Noise dominated (total time) | Noise dominated (detector-on time) | Marked lightcurve |
|---|---|---|---|---|---|---|---|
| A | 5333 | 3416 | 4 | 4 | 0.08% | 0.12% | 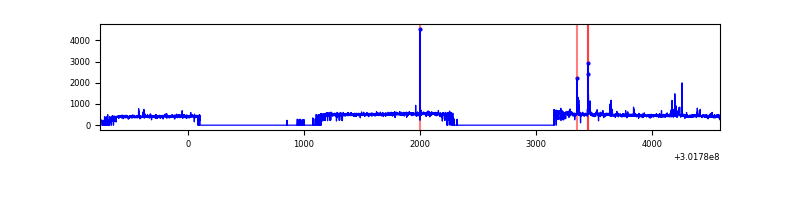 |
| B | 5328 | 3410 | 2 | 2 | 0.04% | 0.06% | 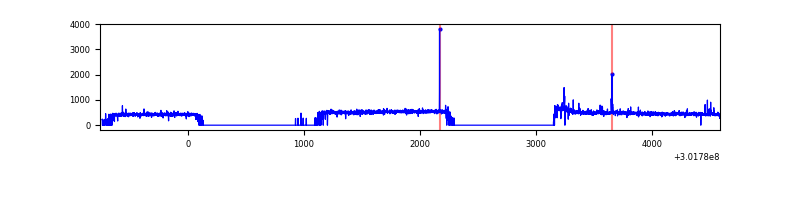 |
| C | 5346 | 3406 | 0 | 0 | 0.00% | 0.00% | 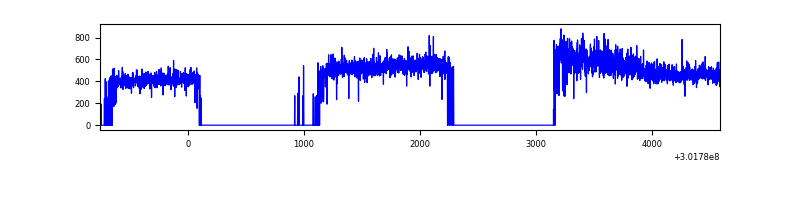 |
| D | 5314 | 3405 | 60 | 60 | 1.13% | 1.76% | 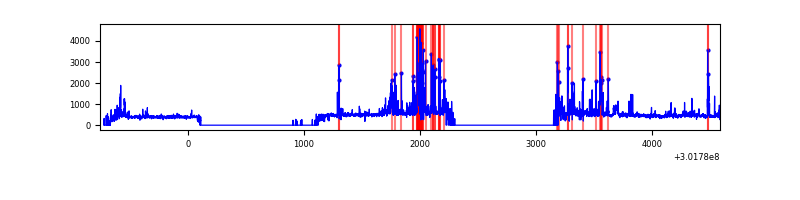 |
Top three noisy pixels from each quadrant. If the there are fewer than three noisy pixels in the level2.evt file, extra rows are filled as -1
| Pixel properties | Quadrant properties | ||||||
|---|---|---|---|---|---|---|---|
| Quadrant | DetID | PixID | Counts | Sigma | Mean | Median | Sigma |
| A | 9 | 143 | 43546 | 523.06 | 404 | 395 | 82.5 |
| A | 5 | 16 | 10077 | 117.36 | 404 | 395 | 82.5 |
| A | 0 | 226 | 3445 | 36.97 | 404 | 395 | 82.5 |
| B | 0 | 190 | 13782 | 168.33 | 404 | 394 | 79.5 |
| B | 0 | 197 | 11341 | 137.64 | 404 | 394 | 79.5 |
| B | 12 | 111 | 9374 | 112.91 | 404 | 394 | 79.5 |
| C | 14 | 238 | 59837 | 649.27 | 385 | 388 | 91.6 |
| C | 3 | 233 | 50337 | 545.51 | 385 | 388 | 91.6 |
| C | 8 | 208 | 47417 | 513.62 | 385 | 388 | 91.6 |
| D | 1 | 52 | 380652 | 4004.49 | 383 | 370 | 95.0 |
| D | 13 | 153 | 68142 | 713.66 | 383 | 370 | 95.0 |
| D | 7 | 38 | 19671 | 203.25 | 383 | 370 | 95.0 |
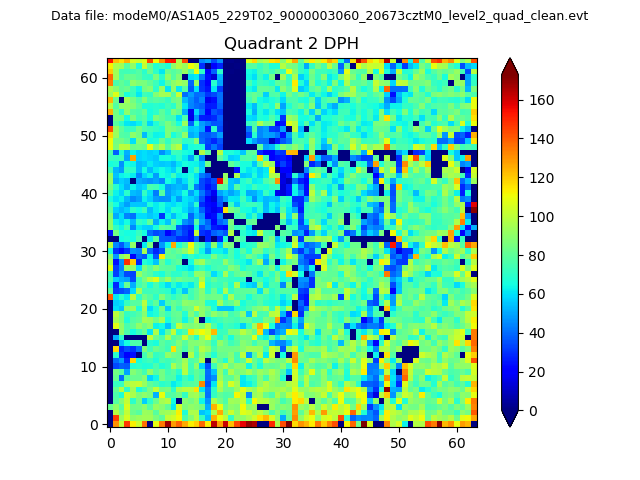
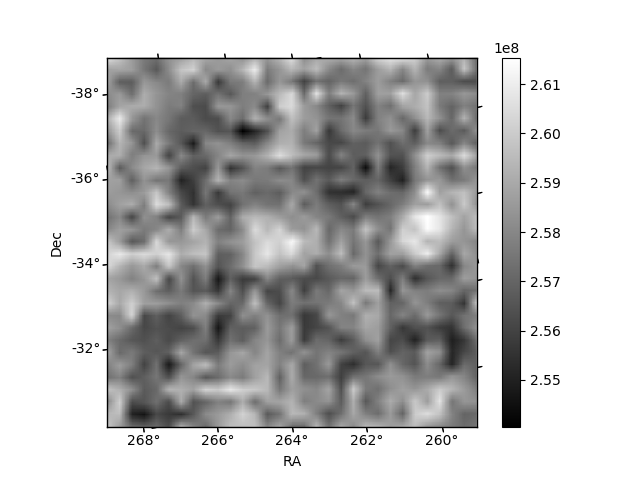
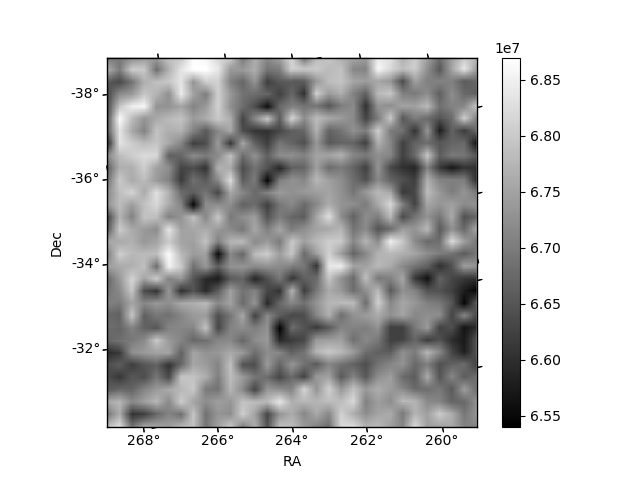
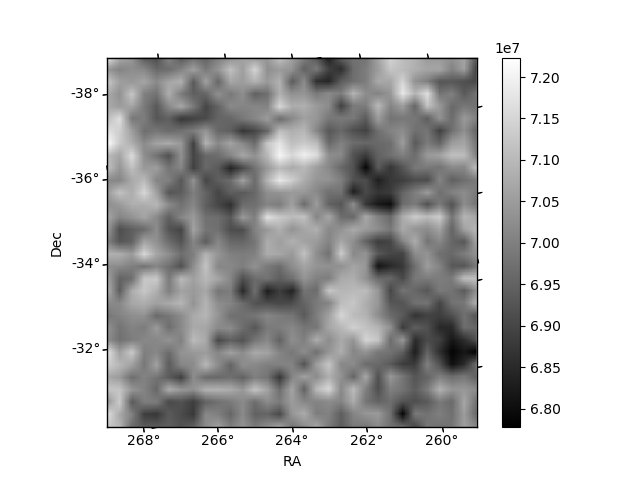
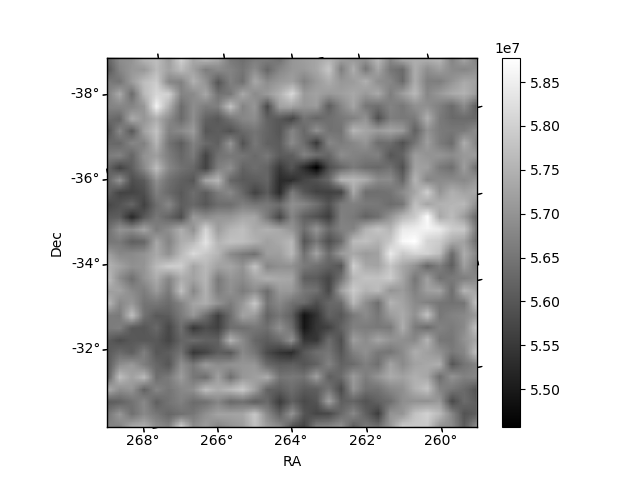
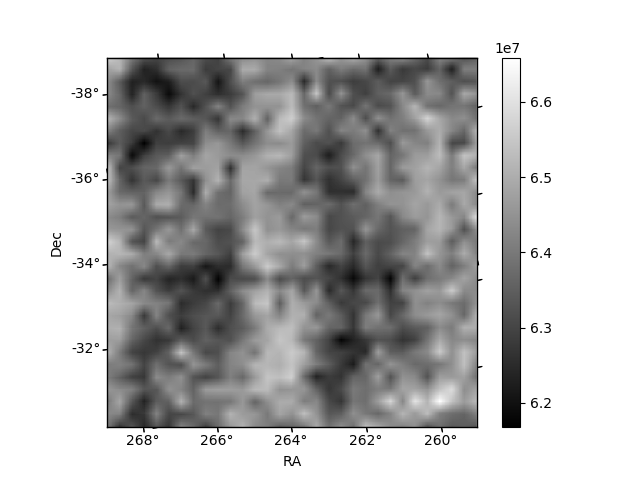
Histogram calculated using DETX and DETY for each event in the final _common_clean file
| Quadrant A | 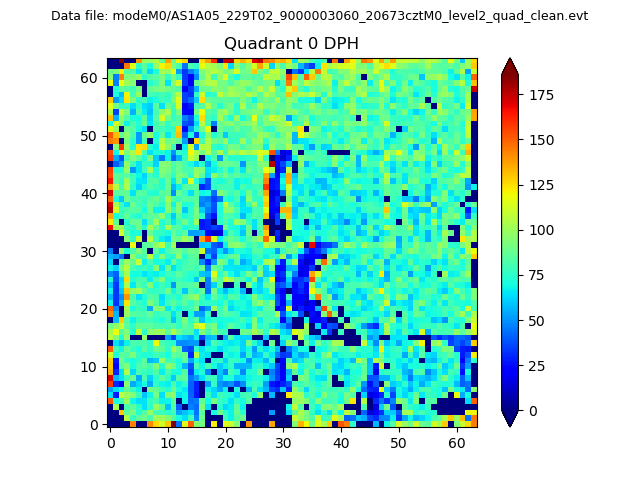 |
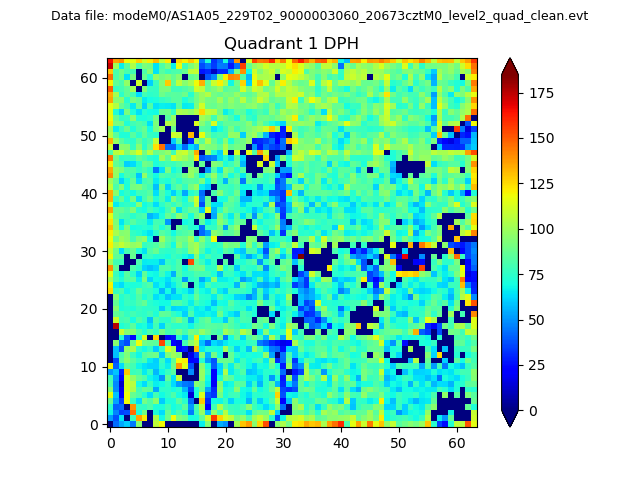 |
Quadrant B |
|---|---|---|---|
| Quadrant D | 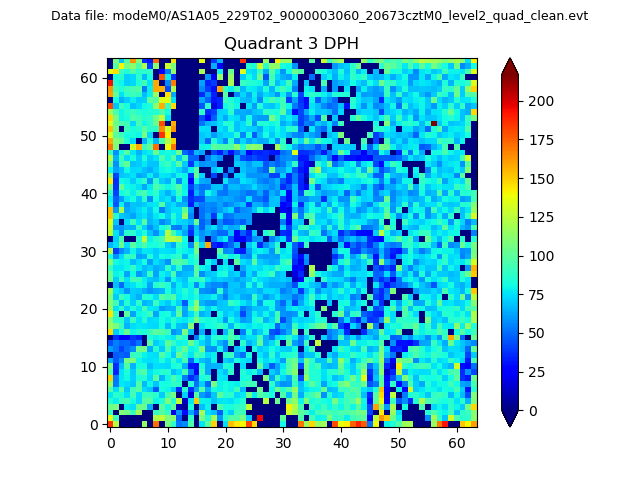 |
 |
Quadrant C |
| Plot type | Count rate plots | Images |
|---|---|---|
| Comparison with Poisson distribution Blue bars denote a histogram of data divided into 1 sec bins. Red curve is a Poisson curve with rate = median count rate of data. |
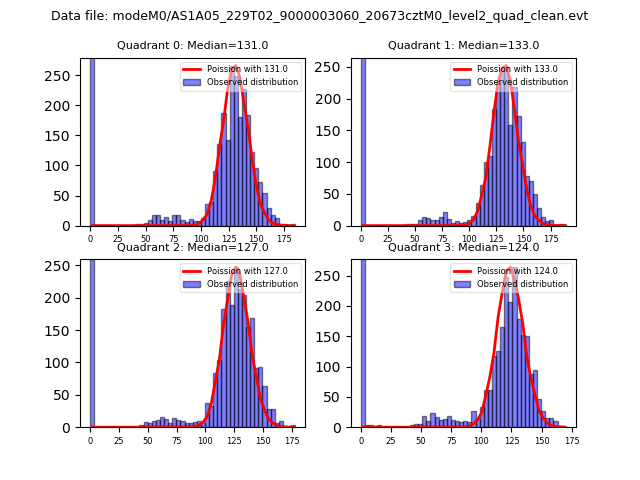 |
 |
| Quadrant-wise count rates Data is divided into 100 sec bins |
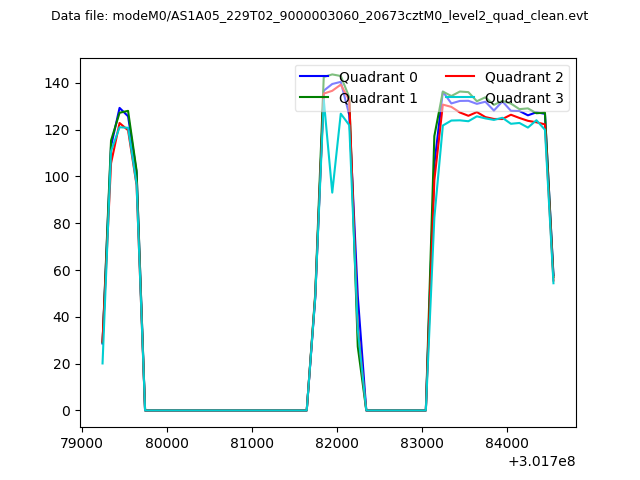 |
|
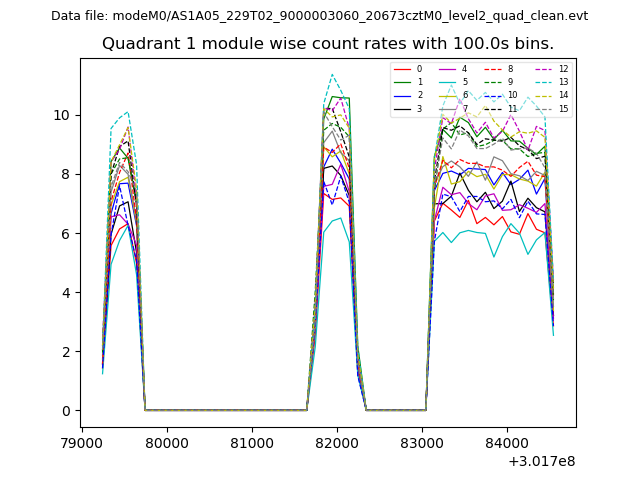
| Module-wise count rates for Quadrant A Data is divided into 100 sec bins |
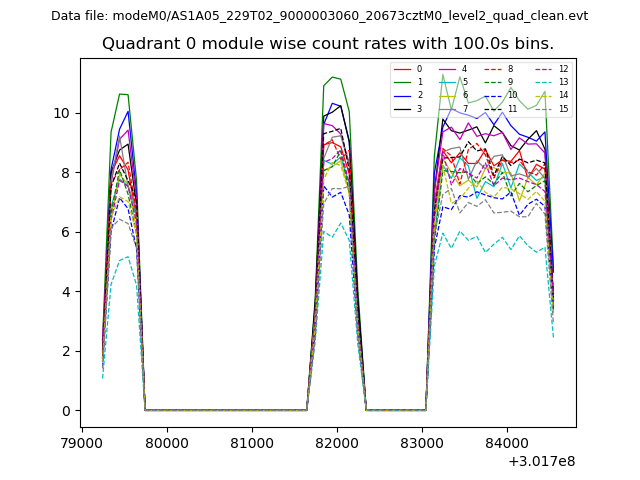 |
 |
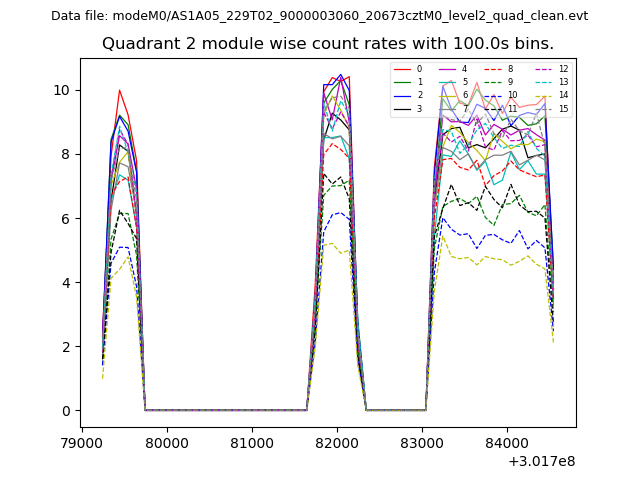
| Module-wise count rates for Quadrant B Data is divided into 100 sec bins |
 |
 |
| Module-wise count rates for Quadrant C Data is divided into 100 sec bins |
 |
 |
| Module-wise count rates for Quadrant D Data is divided into 100 sec bins |
 |
 |
| Parameter | Plot |
|---|---|
| CZT HV Monitor | 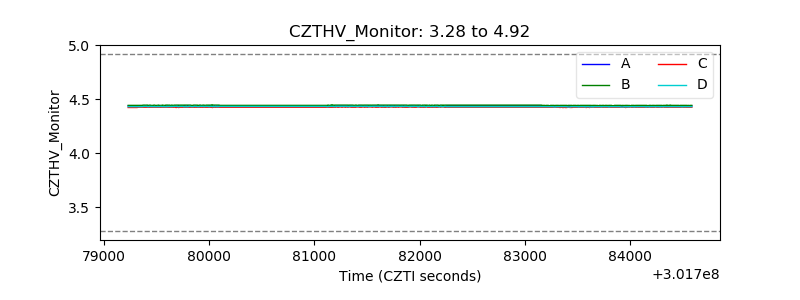 |
| D_VDD | 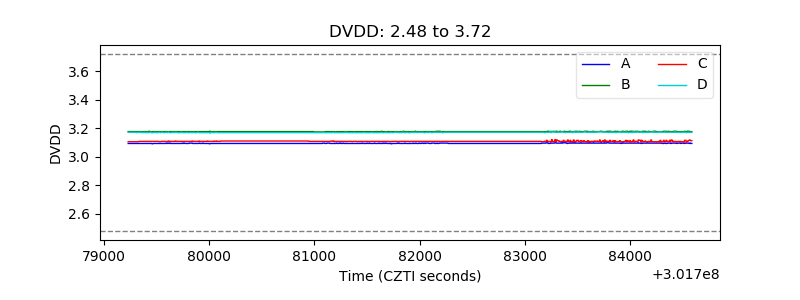 |
| Temperature 1 |  |
| Veto HV Monitor | 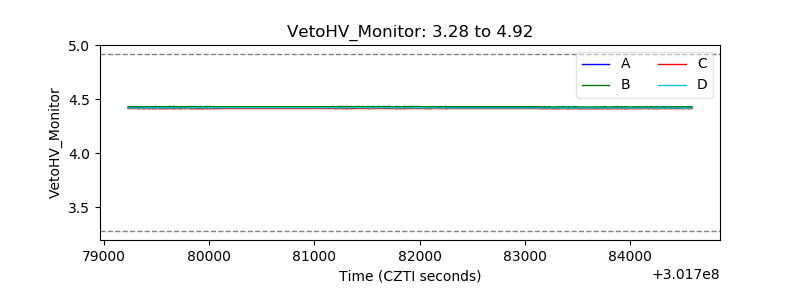 |
| Veto LLD | 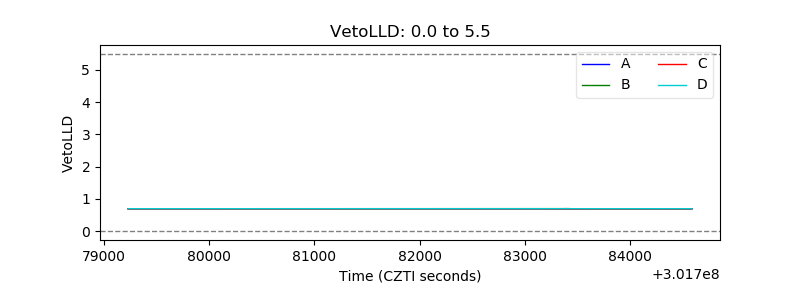 |
| Alpha Counter | 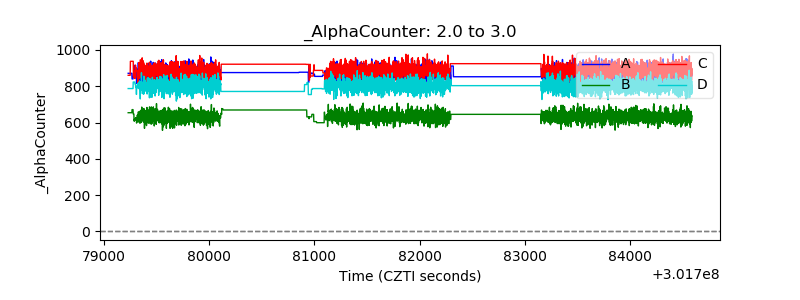 |
| _CPM_Rate | 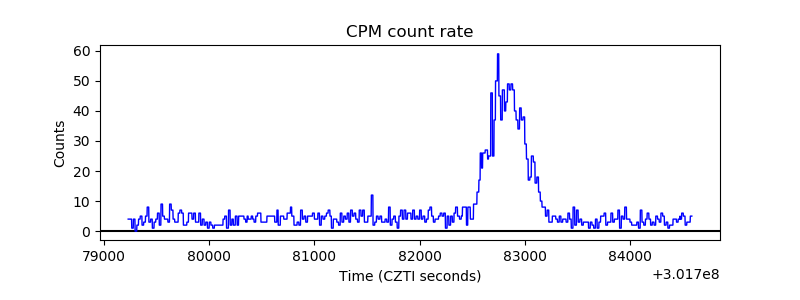 |
| CZT Counter | 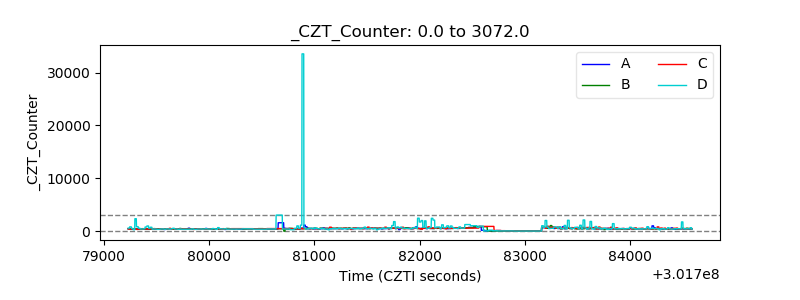 |
| +2.5 Volts monitor |  |
| +5 Volts monitor | 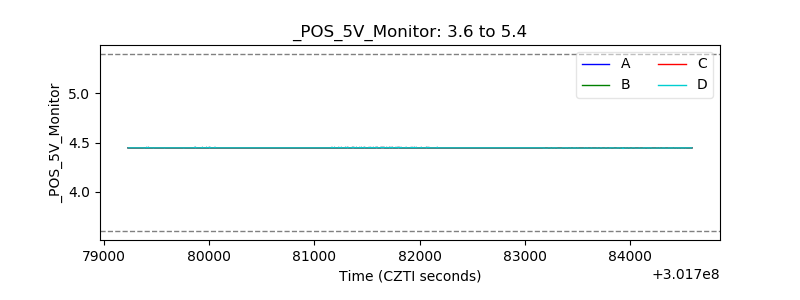 |
| _ROLL_ROT |  |
| _Roll_DEC | 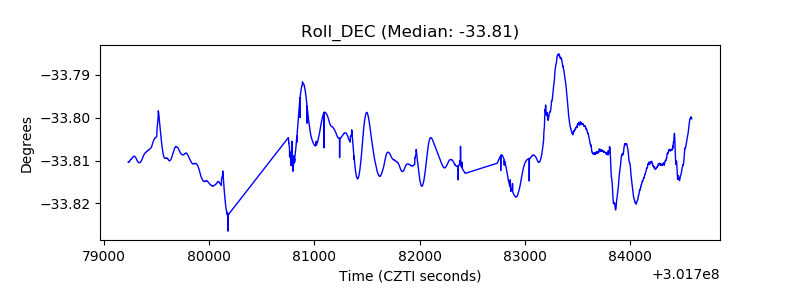 |
| _Roll_RA | 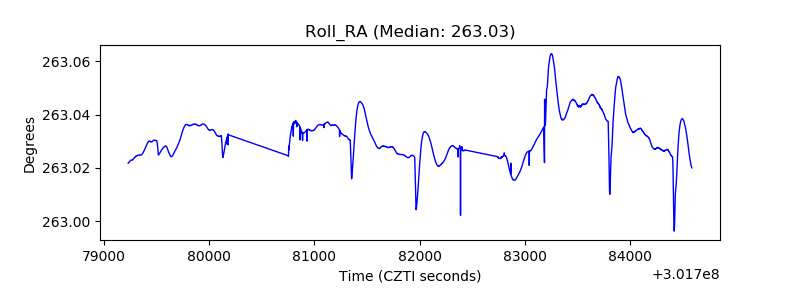 |
| Veto Counter | 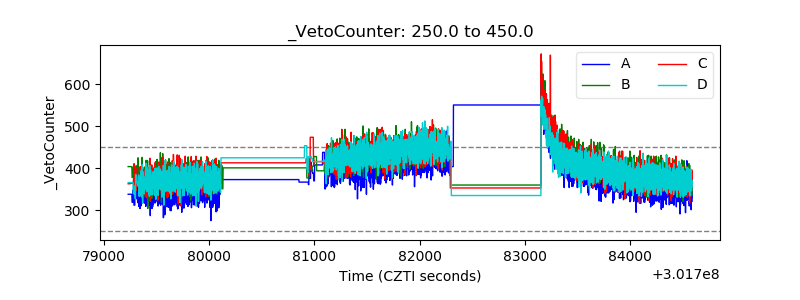 |