| Param | Original file | Final file |
|---|---|---|
| Filename | modeM0/AS1A05_229T02_9000003060_20674cztM0_level2.evt | modeM0/AS1A05_229T02_9000003060_20674cztM0_level2_quad_clean.evt |
| Size (bytes) | 734,296,320 | 141,992,640 |
| Size | 700.3 MB | 135.4 MB |
| Events in quadrant A | 5,201,877 | 912,352 |
| Events in quadrant B | 5,154,392 | 921,155 |
| Events in quadrant C | 5,223,149 | 883,084 |
| Events in quadrant D | 5,947,925 | 856,953 |
| Mode M0 | |||
|---|---|---|---|
| Quadrant | BADHDUFLAG | Total packets | Discarded packets |
| A | 0 | 25567 | 3115 |
| B | 0 | 25360 | 3087 |
| C | 0 | 25575 | 3097 |
| D | 0 | 28688 | 3645 |
| Mode SS | |||
|---|---|---|---|
| Quadrant | BADHDUFLAG | Total packets | Discarded packets |
| A | 0 | 244 | 30 |
| B | 0 | 244 | 28 |
| C | 0 | 244 | 32 |
| D | 0 | 244 | 32 |
| Mode M9 | |||
|---|---|---|---|
| Quadrant | BADHDUFLAG | Total packets | Discarded packets |
| A | 0 | 10 | 0 |
| B | 0 | 10 | 0 |
| C | 0 | 10 | 0 |
| D | 0 | 10 | 0 |
| Quadrant | Total seconds | Saturated seconds | Saturation percentage |
|---|---|---|---|
| A | 10498 | 90 | 0.857306% |
| B | 10505 | 104 | 0.990005% |
| C | 10499 | 113 | 1.076293% |
| D | 10498 | 266 | 2.533816% |
Noise dominated data is calculated using 1-second bins in cleaned event files. If a bin has >2000 counts, and if more than 50% of those come from <1% of pixels, then it is considered to be noise-dominated and hence unusable.
| Quadrant | # 1 sec bins | Bins with >0 counts | Bins with >2000 counts | High rate bins dominated by noise | Noise dominated (total time) | Noise dominated (detector-on time) | Marked lightcurve |
|---|---|---|---|---|---|---|---|
| A | 12959 | 10623 | 30 | 30 | 0.23% | 0.28% | 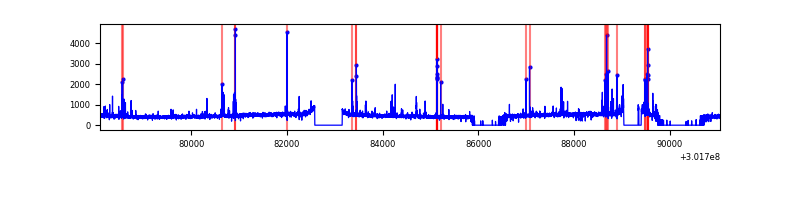 |
| B | 12959 | 10626 | 15 | 15 | 0.12% | 0.14% | 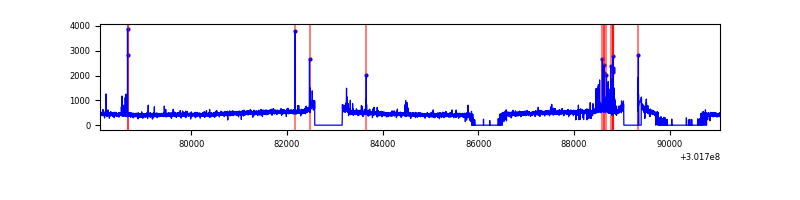 |
| C | 12960 | 10616 | 0 | 0 | 0.00% | 0.00% | 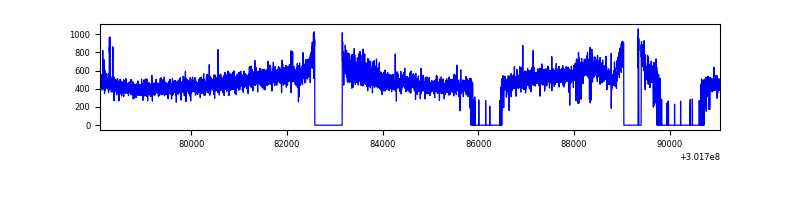 |
| D | 12959 | 10616 | 154 | 154 | 1.19% | 1.45% | 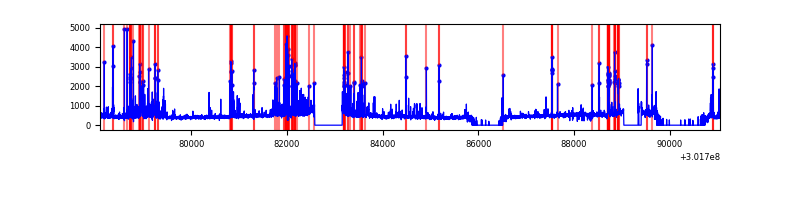 |
Top three noisy pixels from each quadrant. If the there are fewer than three noisy pixels in the level2.evt file, extra rows are filled as -1
| Pixel properties | Quadrant properties | ||||||
|---|---|---|---|---|---|---|---|
| Quadrant | DetID | PixID | Counts | Sigma | Mean | Median | Sigma |
| A | 9 | 143 | 226432 | 881.69 | 1264 | 1235 | 255.4 |
| A | 5 | 16 | 110455 | 427.62 | 1264 | 1235 | 255.4 |
| A | 0 | 226 | 10737 | 37.2 | 1264 | 1235 | 255.4 |
| B | 7 | 220 | 128795 | 529.74 | 1263 | 1230 | 240.8 |
| B | 12 | 111 | 29116 | 115.8 | 1263 | 1230 | 240.8 |
| B | 0 | 190 | 27074 | 107.32 | 1263 | 1230 | 240.8 |
| C | 3 | 233 | 230369 | 811.71 | 1208 | 1216 | 282.3 |
| C | 14 | 238 | 187469 | 659.75 | 1208 | 1216 | 282.3 |
| C | 8 | 208 | 68261 | 237.49 | 1208 | 1216 | 282.3 |
| D | 1 | 52 | 867547 | 2978.32 | 1212 | 1175 | 290.9 |
| D | 13 | 153 | 217983 | 745.32 | 1212 | 1175 | 290.9 |
| D | 12 | 227 | 79031 | 267.65 | 1212 | 1175 | 290.9 |
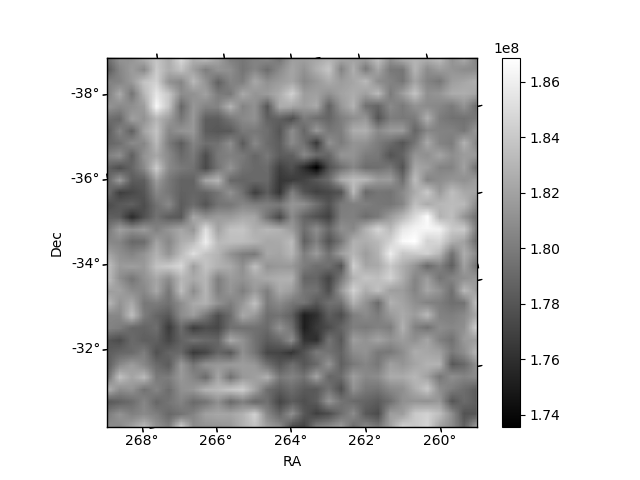
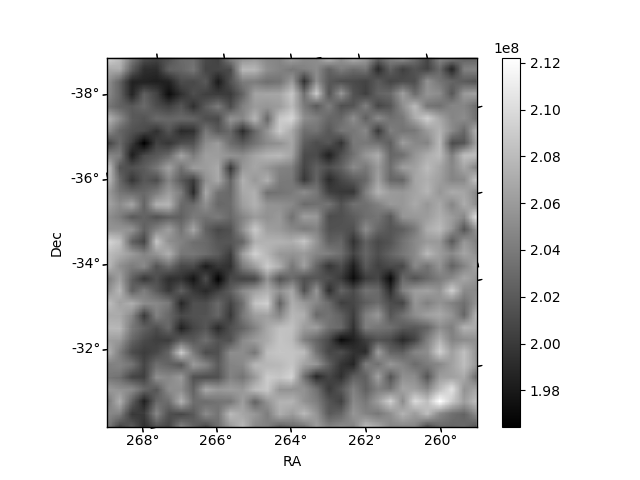
Histogram calculated using DETX and DETY for each event in the final _common_clean file
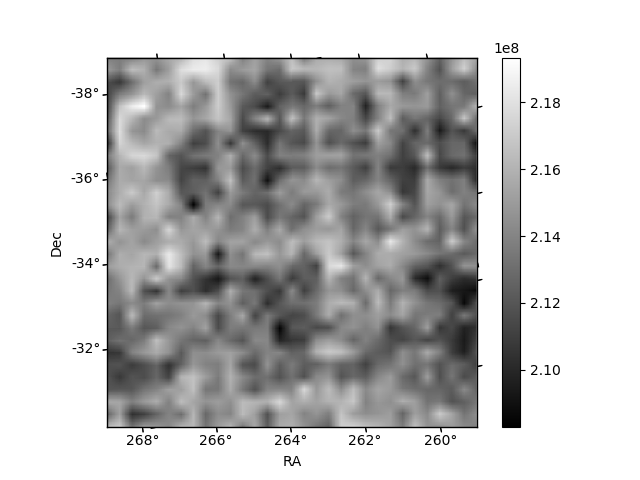
| Quadrant A | 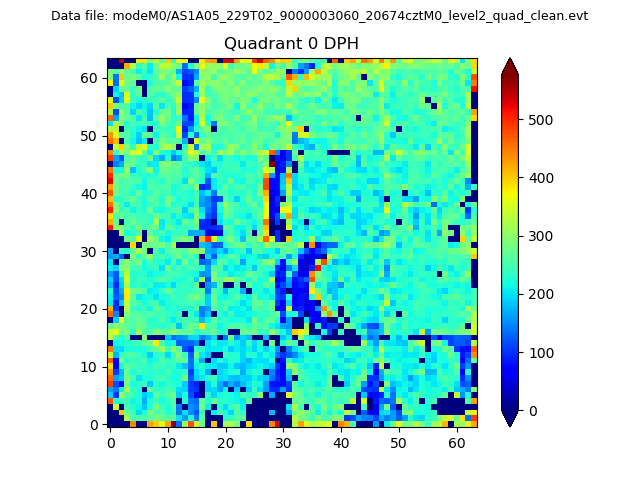 |
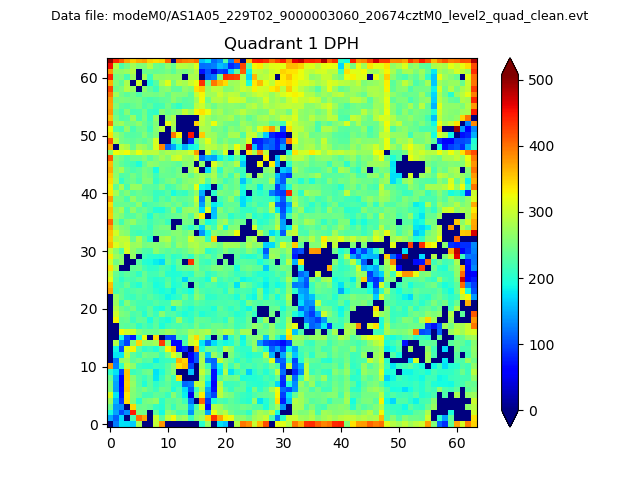 |
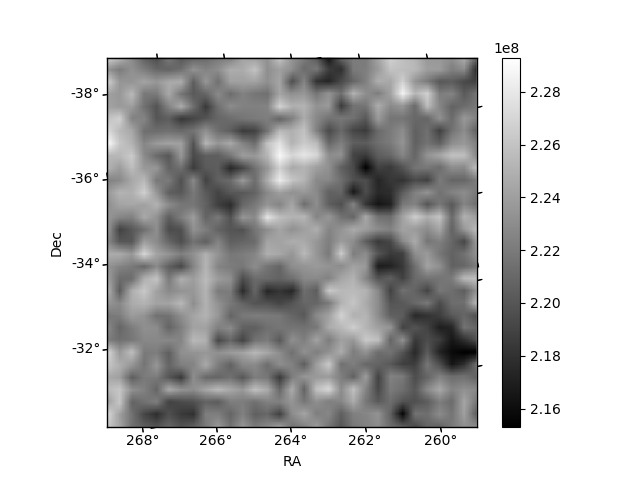
Quadrant B |
|---|---|---|---|
| Quadrant D |  |
 |
Quadrant C |
| Plot type | Count rate plots | Images |
|---|---|---|
| Comparison with Poisson distribution Blue bars denote a histogram of data divided into 1 sec bins. Red curve is a Poisson curve with rate = median count rate of data. |
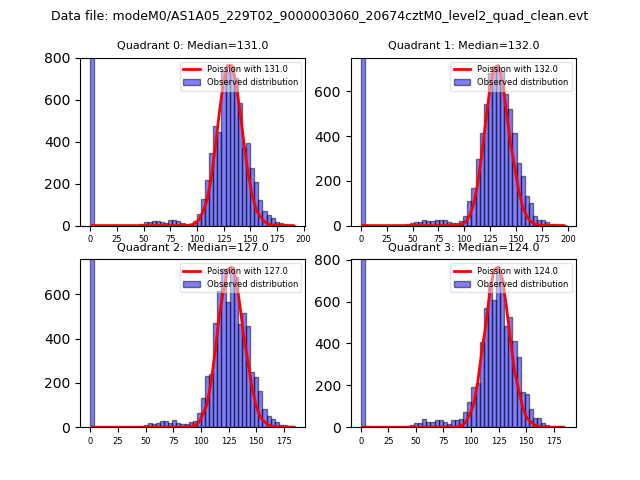 |
 |
| Quadrant-wise count rates Data is divided into 100 sec bins |
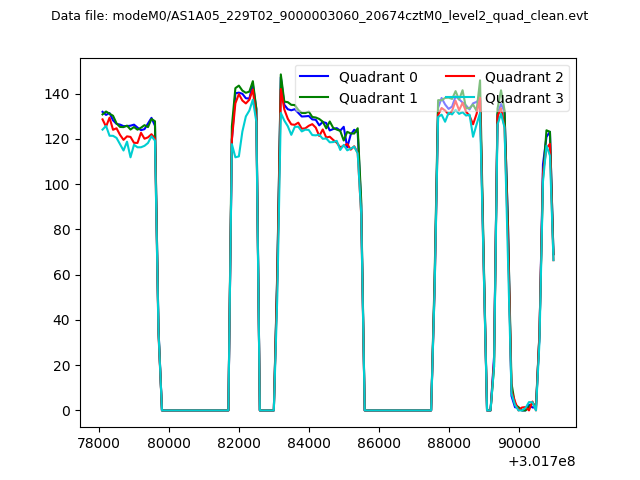 |
|
| Module-wise count rates for Quadrant A Data is divided into 100 sec bins |
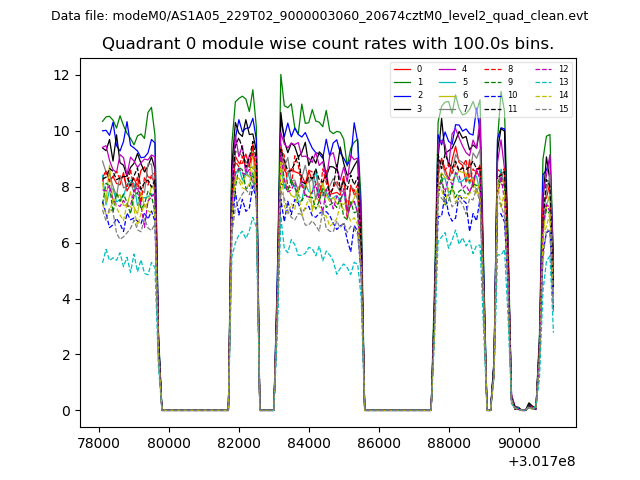 |
 |
| Module-wise count rates for Quadrant B Data is divided into 100 sec bins |
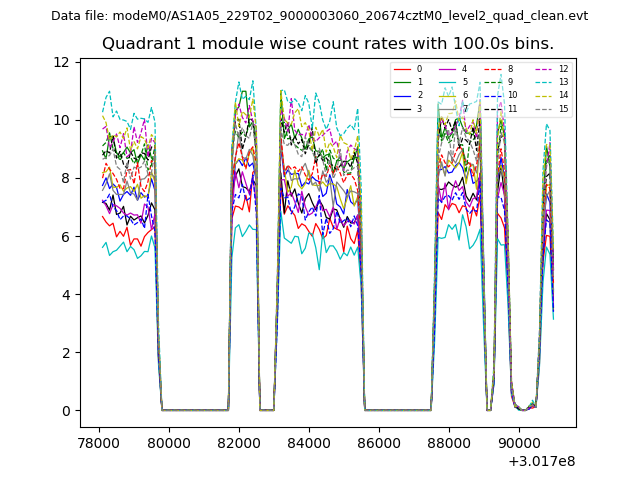 |
 |
| Module-wise count rates for Quadrant C Data is divided into 100 sec bins |
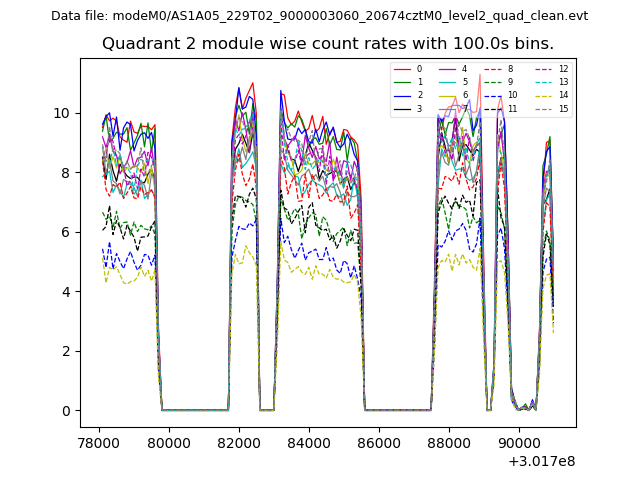 |
 |
| Module-wise count rates for Quadrant D Data is divided into 100 sec bins |
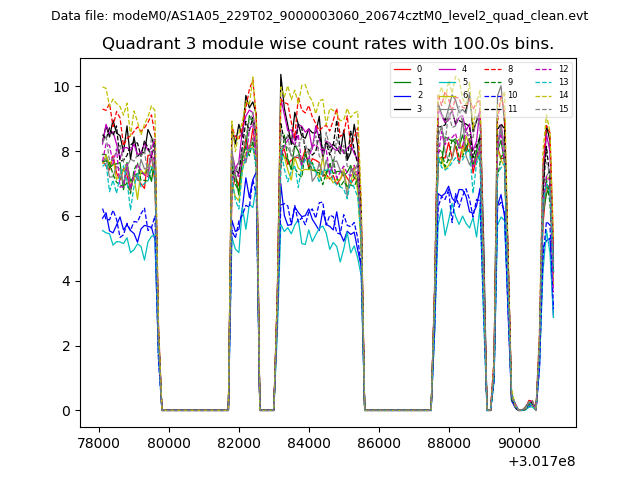 |
 |
| Parameter | Plot |
|---|---|
| CZT HV Monitor | 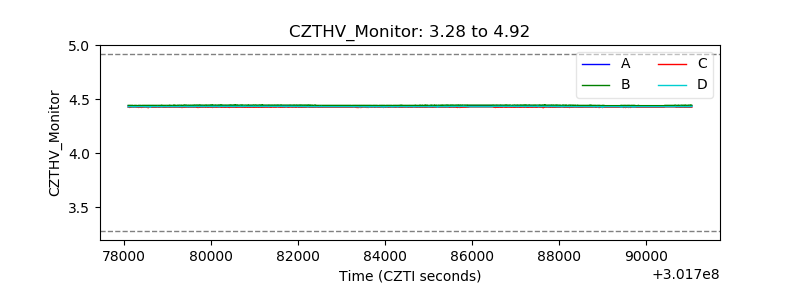 |
| D_VDD | 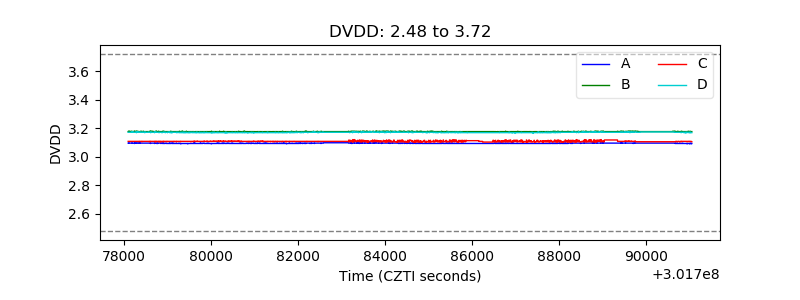 |
| Temperature 1 | 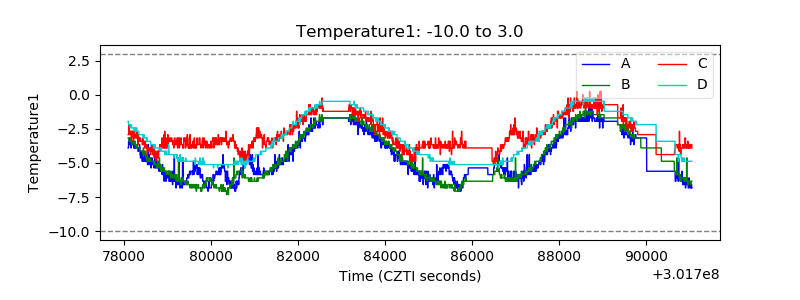 |
| Veto HV Monitor | 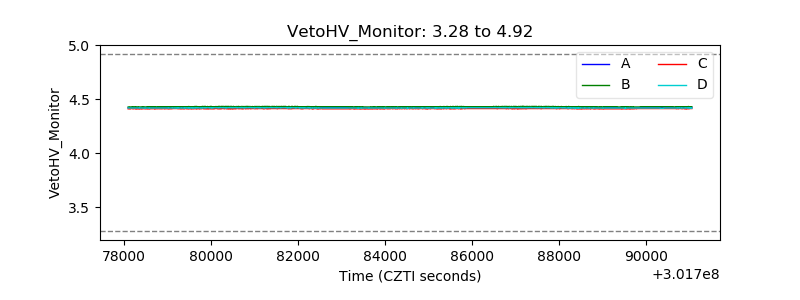 |
| Veto LLD | 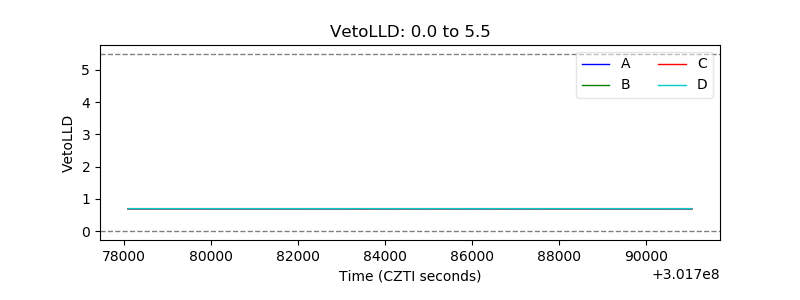 |
| Alpha Counter | 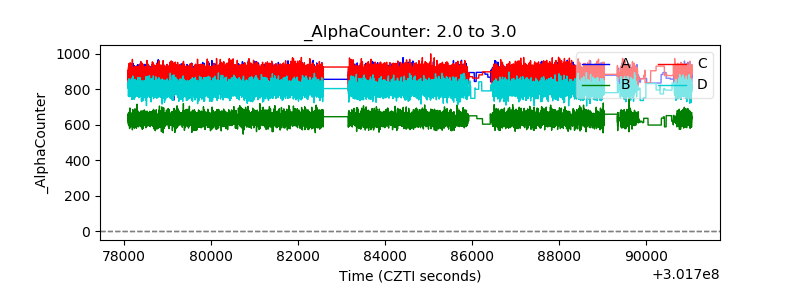 |
| _CPM_Rate | 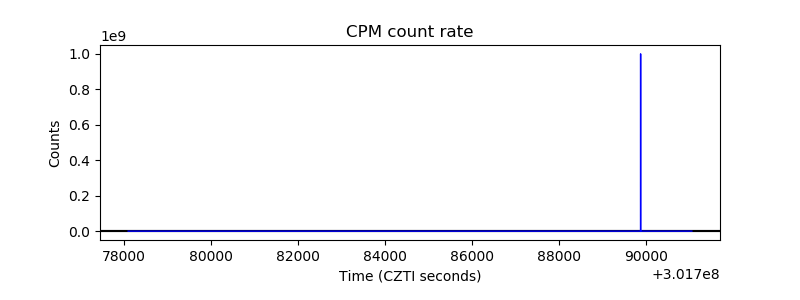 |
| CZT Counter |  |
| +2.5 Volts monitor |  |
| +5 Volts monitor | 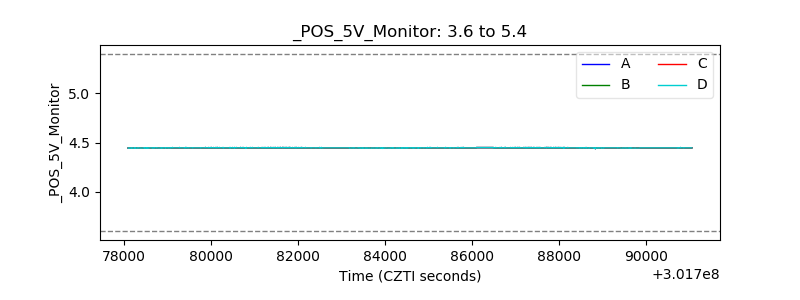 |
| _ROLL_ROT | 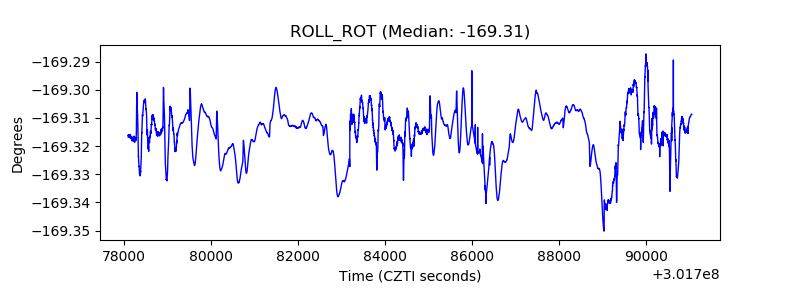 |
| _Roll_DEC | 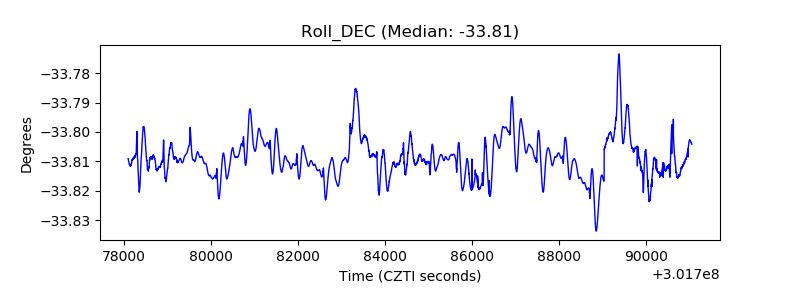 |
| _Roll_RA | 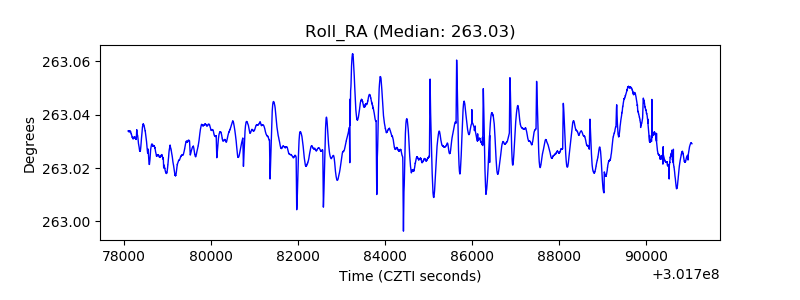 |
| Veto Counter | 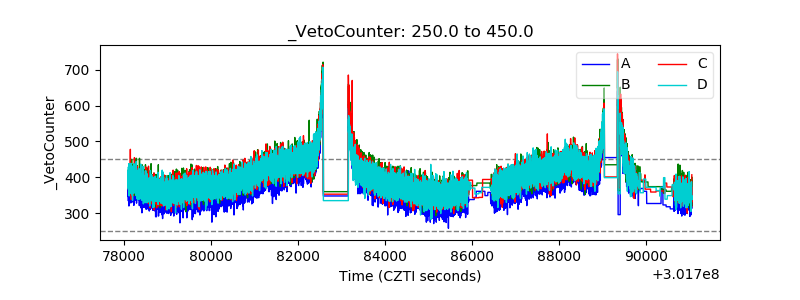 |