| Param | Original file | Final file |
|---|---|---|
| Filename | modeM0/AS1A05_229T02_9000003060_20675cztM0_level2.evt | modeM0/AS1A05_229T02_9000003060_20675cztM0_level2_quad_clean.evt |
| Size (bytes) | 593,475,840 | 115,827,840 |
| Size | 566.0 MB | 110.5 MB |
| Events in quadrant A | 3,904,081 | 756,649 |
| Events in quadrant B | 4,046,443 | 762,013 |
| Events in quadrant C | 4,056,922 | 734,102 |
| Events in quadrant D | 5,431,525 | 706,939 |
| Mode M0 | |||
|---|---|---|---|
| Quadrant | BADHDUFLAG | Total packets | Discarded packets |
| A | 0 | 16860 | 43 |
| B | 0 | 17366 | 60 |
| C | 0 | 17316 | 39 |
| D | 0 | 21697 | 84 |
| Mode SS | |||
|---|---|---|---|
| Quadrant | BADHDUFLAG | Total packets | Discarded packets |
| A | 0 | 164 | 0 |
| B | 0 | 164 | 2 |
| C | 0 | 164 | 0 |
| D | 0 | 164 | 0 |
| Mode M9 | |||
|---|---|---|---|
| Quadrant | BADHDUFLAG | Total packets | Discarded packets |
| A | 0 | 8 | 0 |
| B | 0 | 8 | 0 |
| C | 0 | 8 | 0 |
| D | 0 | 8 | 0 |
| Quadrant | Total seconds | Saturated seconds | Saturation percentage |
|---|---|---|---|
| A | 7887 | 60 | 0.760746% |
| B | 7883 | 113 | 1.433464% |
| C | 7890 | 74 | 0.937896% |
| D | 7883 | 289 | 3.666117% |
Noise dominated data is calculated using 1-second bins in cleaned event files. If a bin has >2000 counts, and if more than 50% of those come from <1% of pixels, then it is considered to be noise-dominated and hence unusable.
| Quadrant | # 1 sec bins | Bins with >0 counts | Bins with >2000 counts | High rate bins dominated by noise | Noise dominated (total time) | Noise dominated (detector-on time) | Marked lightcurve |
|---|---|---|---|---|---|---|---|
| A | 8691 | 7908 | 24 | 24 | 0.28% | 0.30% | 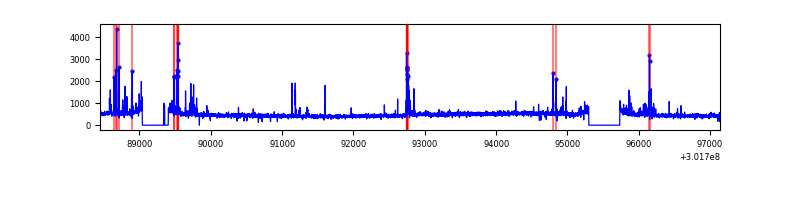 |
| B | 8692 | 7910 | 22 | 22 | 0.25% | 0.28% | 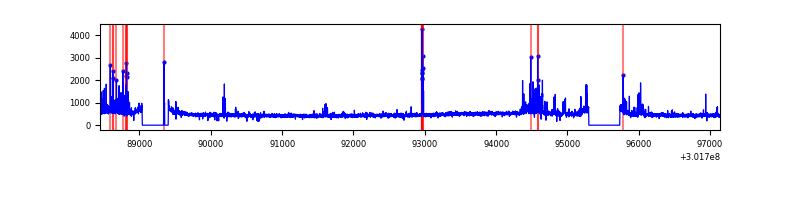 |
| C | 8692 | 7910 | 1 | 1 | 0.01% | 0.01% | 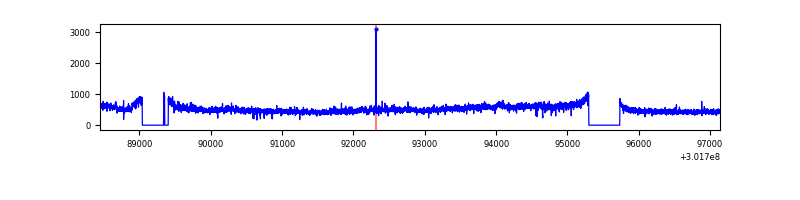 |
| D | 8692 | 7910 | 179 | 179 | 2.06% | 2.26% | 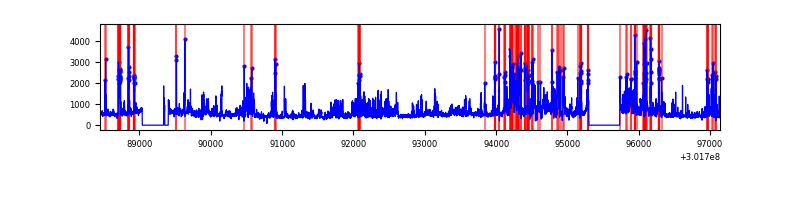 |
Top three noisy pixels from each quadrant. If the there are fewer than three noisy pixels in the level2.evt file, extra rows are filled as -1
| Pixel properties | Quadrant properties | ||||||
|---|---|---|---|---|---|---|---|
| Quadrant | DetID | PixID | Counts | Sigma | Mean | Median | Sigma |
| A | 9 | 143 | 148366 | 770.1 | 944 | 923 | 191.5 |
| A | 5 | 16 | 117889 | 610.92 | 944 | 923 | 191.5 |
| A | 0 | 226 | 7946 | 36.68 | 944 | 923 | 191.5 |
| B | 7 | 220 | 213809 | 1170.39 | 944 | 922 | 181.9 |
| B | 3 | 64 | 43525 | 234.22 | 944 | 922 | 181.9 |
| B | 0 | 190 | 35955 | 192.6 | 944 | 922 | 181.9 |
| C | 3 | 233 | 385310 | 1818.67 | 899 | 903 | 211.4 |
| C | 14 | 238 | 138978 | 653.25 | 899 | 903 | 211.4 |
| C | 8 | 208 | 19374 | 87.39 | 899 | 903 | 211.4 |
| D | 1 | 52 | 1618771 | 7333.55 | 903 | 875 | 220.6 |
| D | 2 | 165 | 92764 | 416.51 | 903 | 875 | 220.6 |
| D | 12 | 227 | 78642 | 352.5 | 903 | 875 | 220.6 |
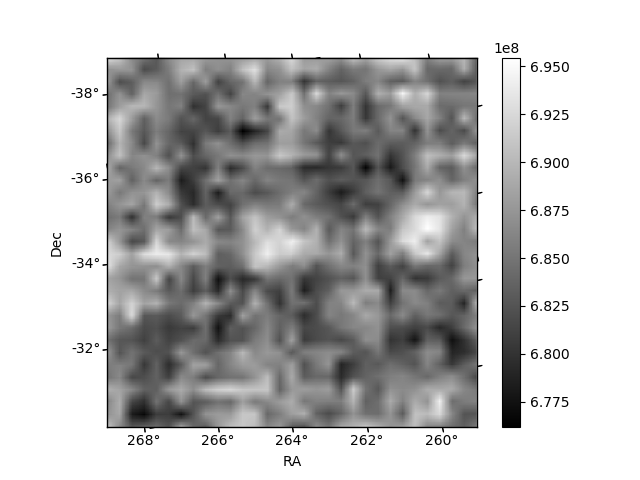
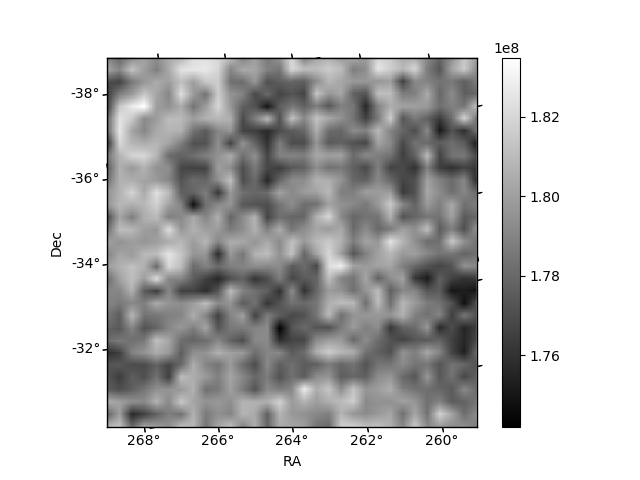
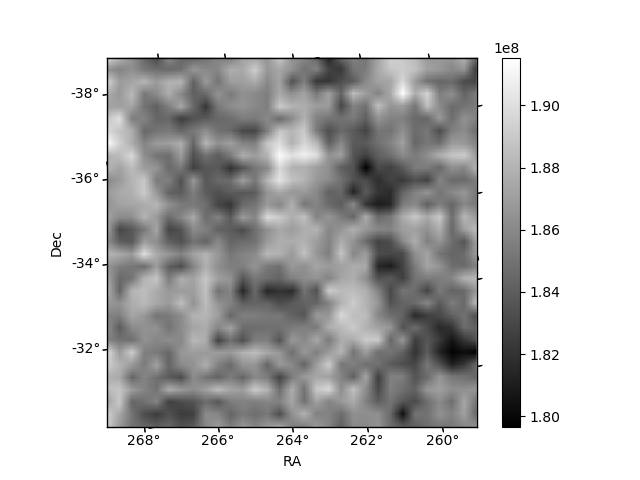
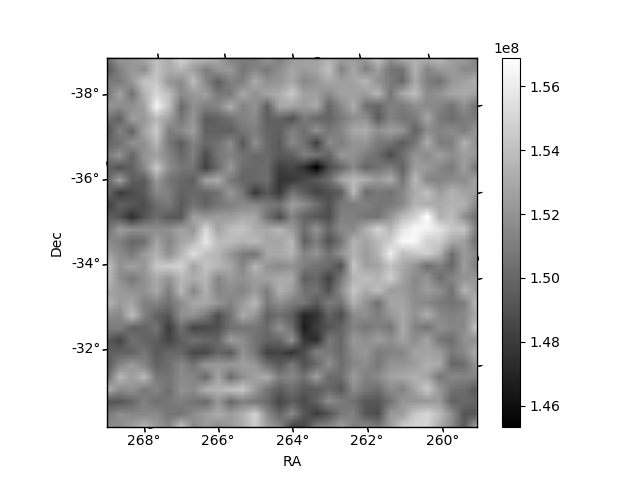
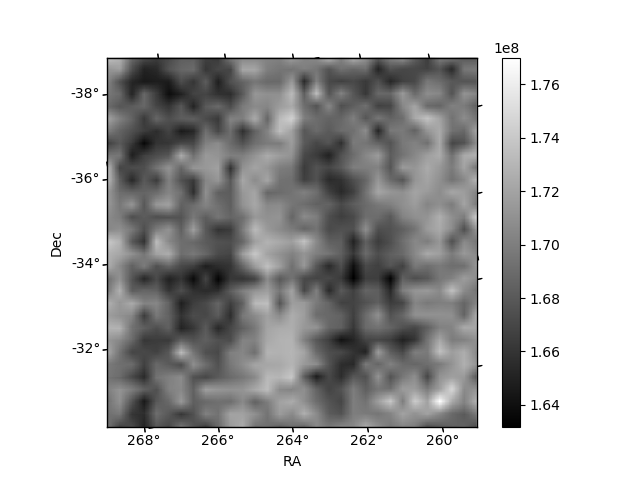
Histogram calculated using DETX and DETY for each event in the final _common_clean file
| Quadrant A | 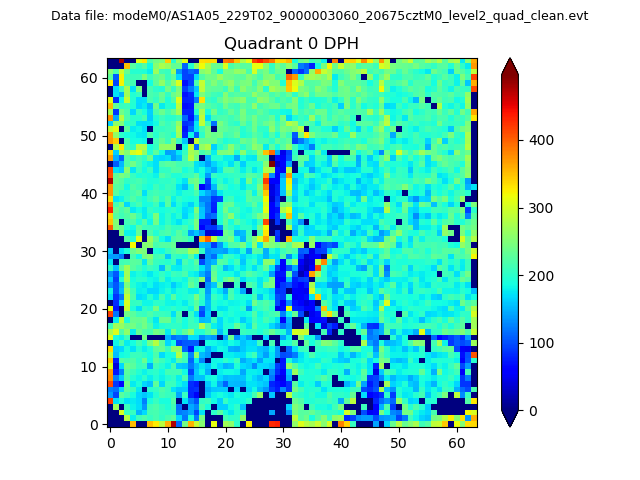 |
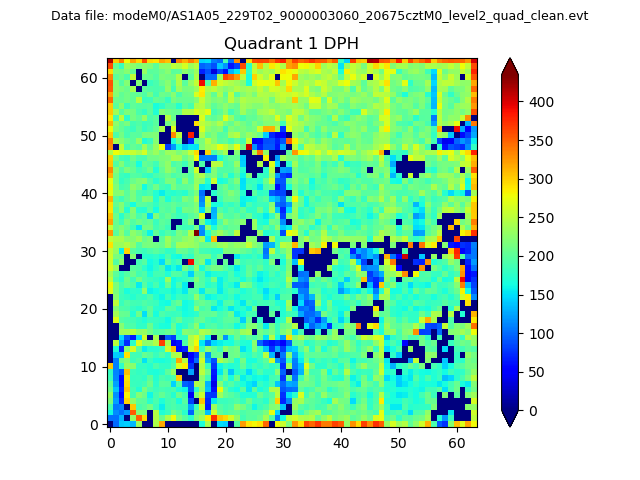 |
Quadrant B |
|---|---|---|---|
| Quadrant D |  |
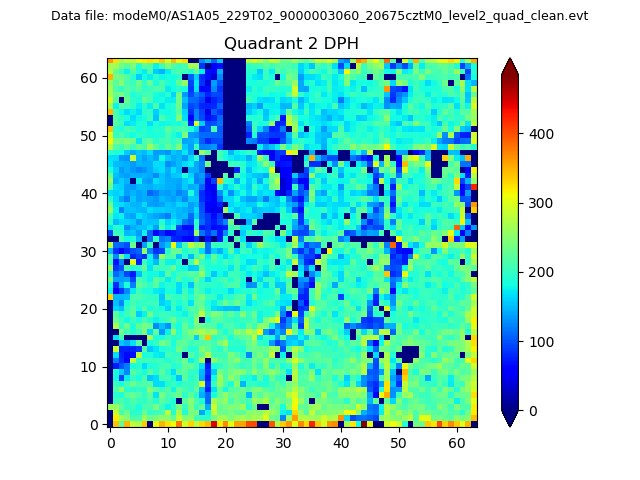 |
Quadrant C |
| Plot type | Count rate plots | Images |
|---|---|---|
| Comparison with Poisson distribution Blue bars denote a histogram of data divided into 1 sec bins. Red curve is a Poisson curve with rate = median count rate of data. |
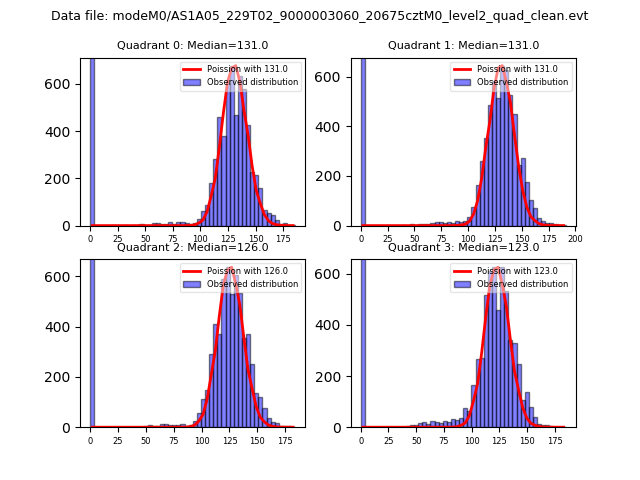 |
 |
| Quadrant-wise count rates Data is divided into 100 sec bins |
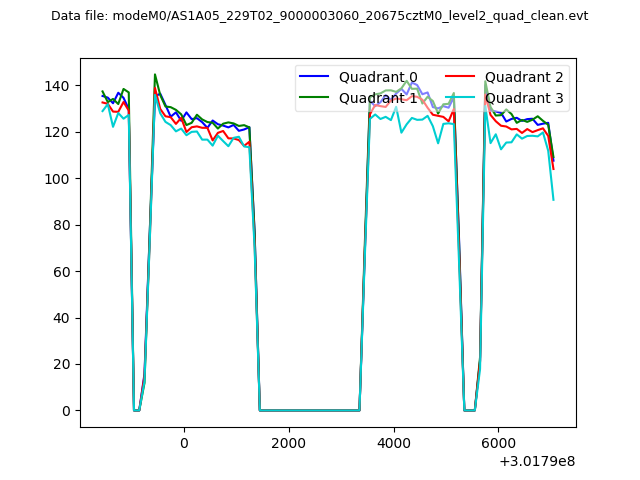 |
|
| Module-wise count rates for Quadrant A Data is divided into 100 sec bins |
 |
 |
| Module-wise count rates for Quadrant B Data is divided into 100 sec bins |
 |
 |
| Module-wise count rates for Quadrant C Data is divided into 100 sec bins |
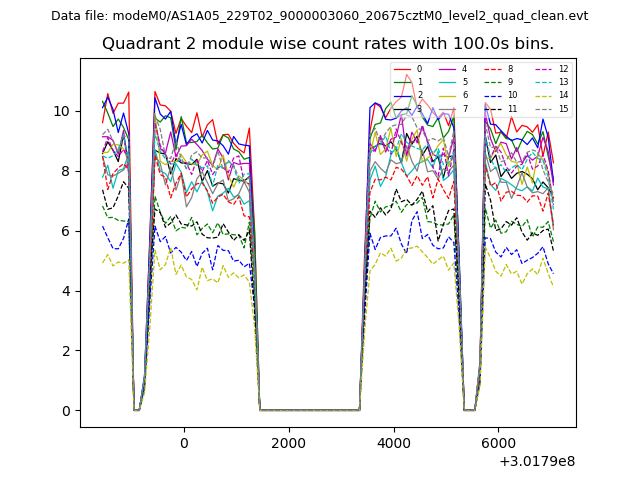 |
 |
| Module-wise count rates for Quadrant D Data is divided into 100 sec bins |
 |
 |
| Parameter | Plot |
|---|---|
| CZT HV Monitor | 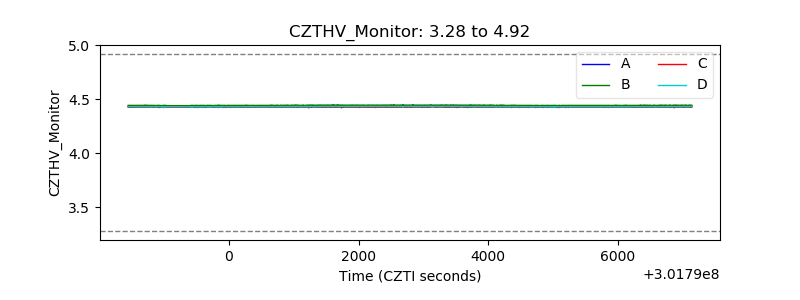 |
| D_VDD | 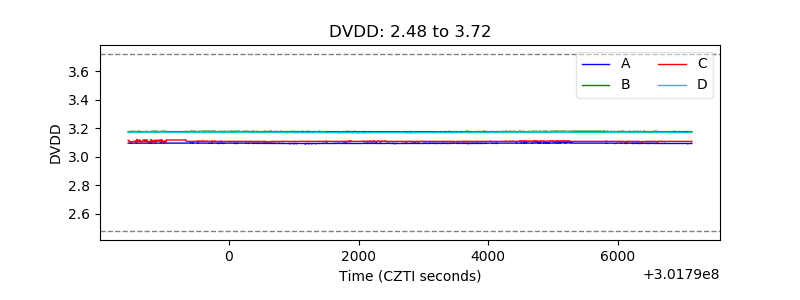 |
| Temperature 1 | 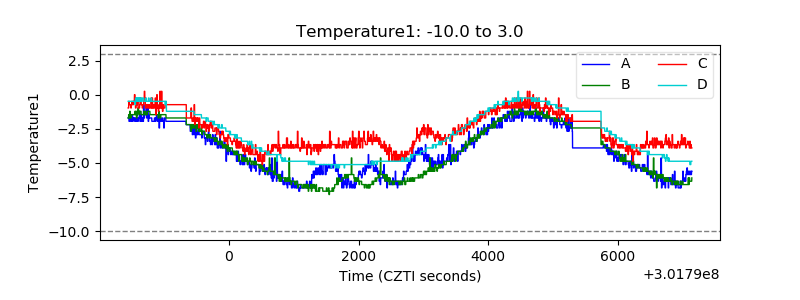 |
| Veto HV Monitor | 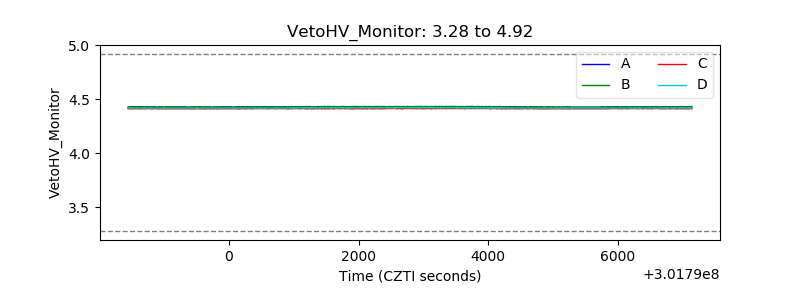 |
| Veto LLD |  |
| Alpha Counter | 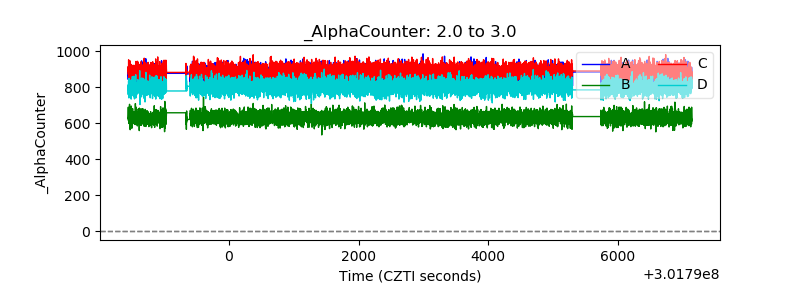 |
| _CPM_Rate | 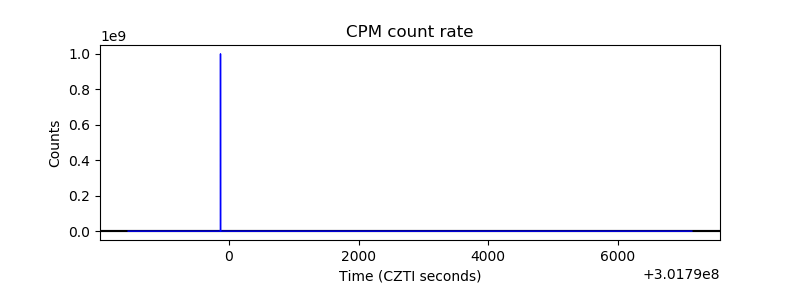 |
| CZT Counter | 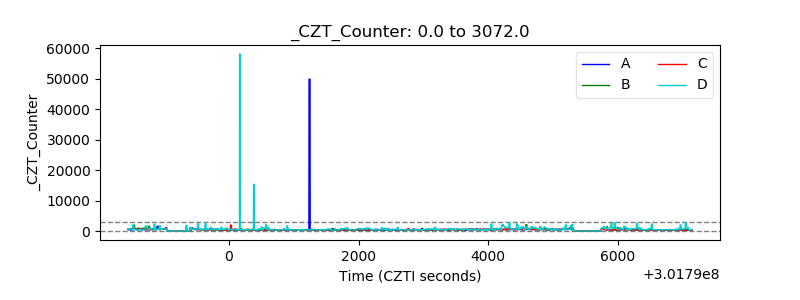 |
| +2.5 Volts monitor |  |
| +5 Volts monitor | 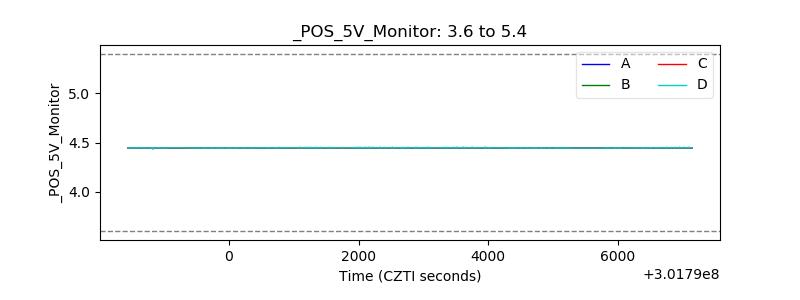 |
| _ROLL_ROT | 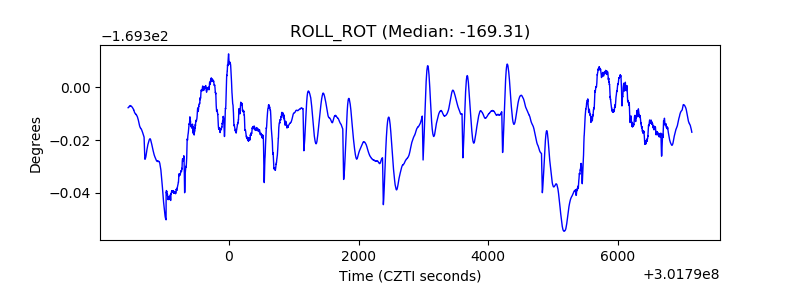 |
| _Roll_DEC | 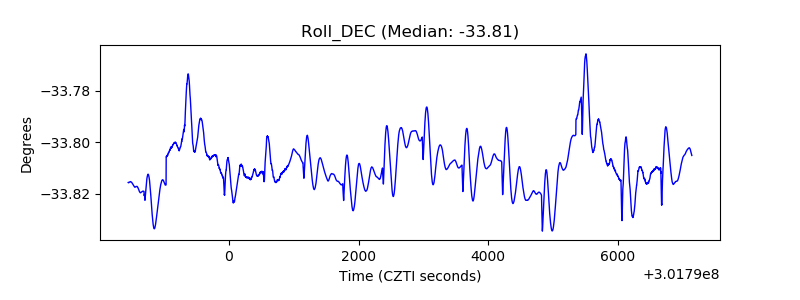 |
| _Roll_RA | 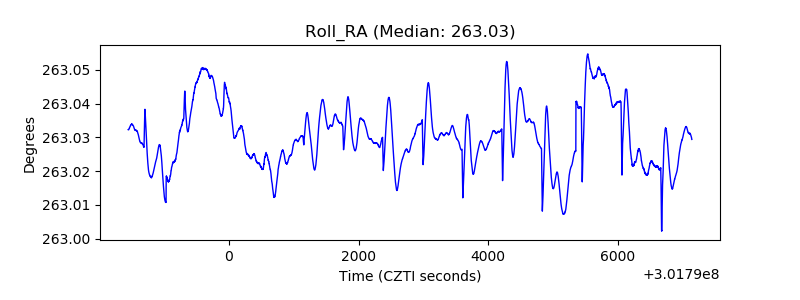 |
| Veto Counter |  |