| Param | Original file | Final file |
|---|---|---|
| Filename | modeM0/AS1A05_229T02_9000003060_20678cztM0_level2.evt | modeM0/AS1A05_229T02_9000003060_20678cztM0_level2_quad_clean.evt |
| Size (bytes) | 1,321,110,720 | 233,953,920 |
| Size | 1.2 GB | 223.1 MB |
| Events in quadrant A | 8,866,430 | 1,478,814 |
| Events in quadrant B | 9,851,838 | 1,479,575 |
| Events in quadrant C | 8,952,756 | 1,441,953 |
| Events in quadrant D | 11,064,716 | 1,386,624 |
| Mode M0 | |||
|---|---|---|---|
| Quadrant | BADHDUFLAG | Total packets | Discarded packets |
| A | 0 | 38804 | 4 |
| B | 0 | 41595 | 4 |
| C | 0 | 39010 | 4 |
| D | 0 | 45955 | 5 |
| Mode SS | |||
|---|---|---|---|
| Quadrant | BADHDUFLAG | Total packets | Discarded packets |
| A | 0 | 382 | 0 |
| B | 0 | 382 | 0 |
| C | 0 | 382 | 0 |
| D | 0 | 384 | 0 |
| Mode M9 | |||
|---|---|---|---|
| Quadrant | BADHDUFLAG | Total packets | Discarded packets |
| A | 0 | 26 | 0 |
| B | 0 | 26 | 0 |
| C | 0 | 26 | 0 |
| D | 0 | 26 | 0 |
| Quadrant | Total seconds | Saturated seconds | Saturation percentage |
|---|---|---|---|
| A | 18856 | 113 | 0.599279% |
| B | 18856 | 364 | 1.930420% |
| C | 18856 | 203 | 1.076580% |
| D | 18856 | 629 | 3.335808% |
Noise dominated data is calculated using 1-second bins in cleaned event files. If a bin has >2000 counts, and if more than 50% of those come from <1% of pixels, then it is considered to be noise-dominated and hence unusable.
| Quadrant | # 1 sec bins | Bins with >0 counts | Bins with >2000 counts | High rate bins dominated by noise | Noise dominated (total time) | Noise dominated (detector-on time) | Marked lightcurve |
|---|---|---|---|---|---|---|---|
| A | 21391 | 18860 | 12 | 12 | 0.06% | 0.06% | 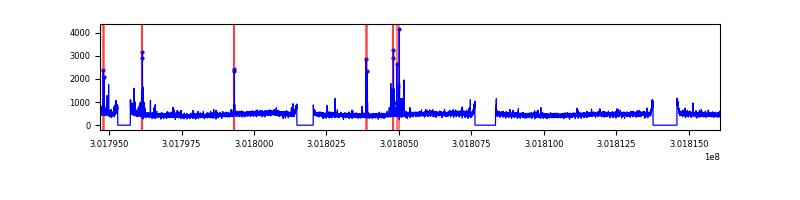 |
| B | 21391 | 18860 | 142 | 142 | 0.66% | 0.75% | 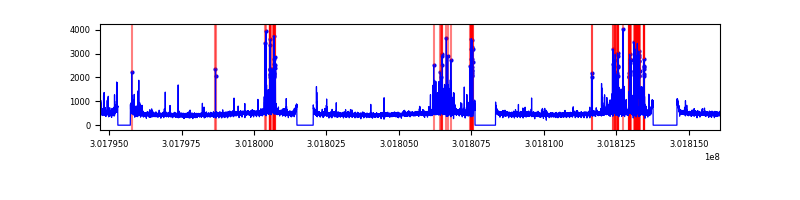 |
| C | 21391 | 18860 | 0 | 0 | 0.00% | 0.00% | 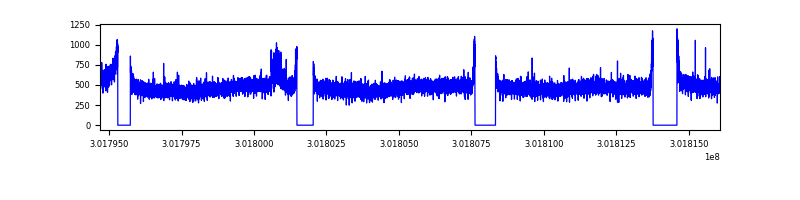 |
| D | 21391 | 18860 | 398 | 398 | 1.86% | 2.11% | 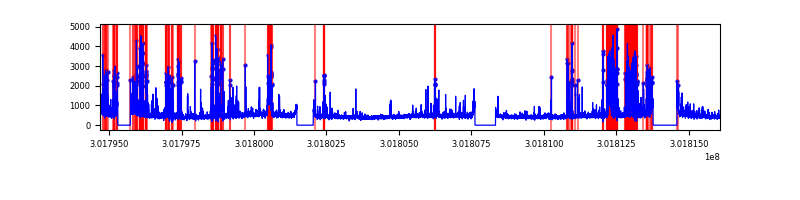 |
Top three noisy pixels from each quadrant. If the there are fewer than three noisy pixels in the level2.evt file, extra rows are filled as -1
| Pixel properties | Quadrant properties | ||||||
|---|---|---|---|---|---|---|---|
| Quadrant | DetID | PixID | Counts | Sigma | Mean | Median | Sigma |
| A | 5 | 16 | 155078 | 336.6 | 2253 | 2205 | 454.2 |
| A | 9 | 143 | 35352 | 72.98 | 2253 | 2205 | 454.2 |
| A | 0 | 226 | 19009 | 37.0 | 2253 | 2205 | 454.2 |
| B | 7 | 220 | 820175 | 1934.69 | 2240 | 2183 | 422.8 |
| B | 0 | 197 | 68721 | 157.37 | 2240 | 2183 | 422.8 |
| B | 0 | 190 | 61077 | 139.29 | 2240 | 2183 | 422.8 |
| C | 14 | 238 | 335998 | 662.21 | 2155 | 2168 | 504.1 |
| C | 3 | 233 | 132486 | 258.51 | 2155 | 2168 | 504.1 |
| C | 7 | 247 | 86771 | 167.82 | 2155 | 2168 | 504.1 |
| D | 1 | 52 | 1925170 | 3703.1 | 2158 | 2099 | 519.3 |
| D | 1 | 20 | 453115 | 868.48 | 2158 | 2099 | 519.3 |
| D | 7 | 238 | 258107 | 492.97 | 2158 | 2099 | 519.3 |
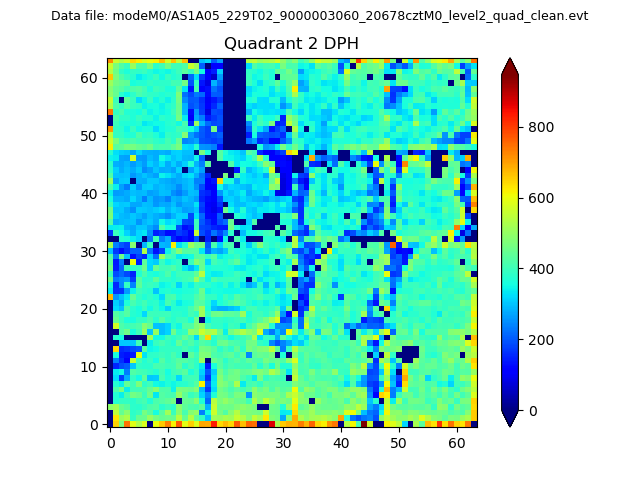
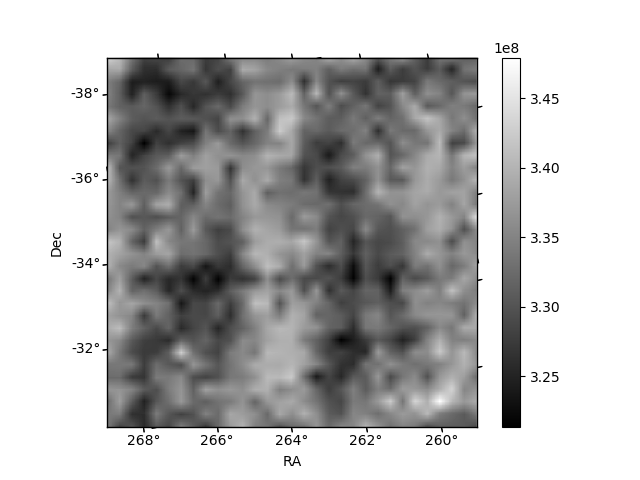
Histogram calculated using DETX and DETY for each event in the final _common_clean file
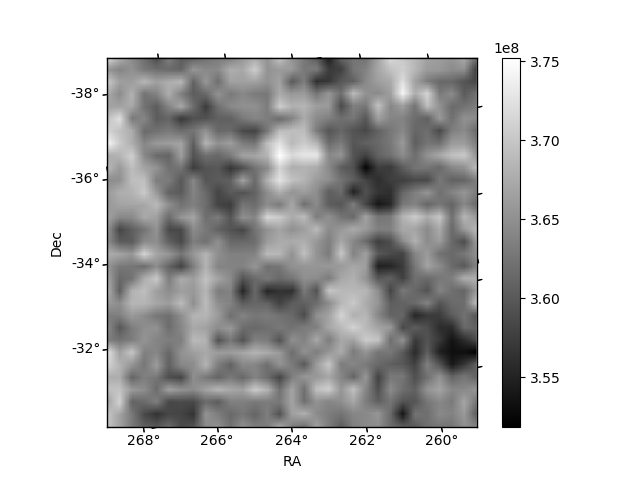
| Quadrant A | 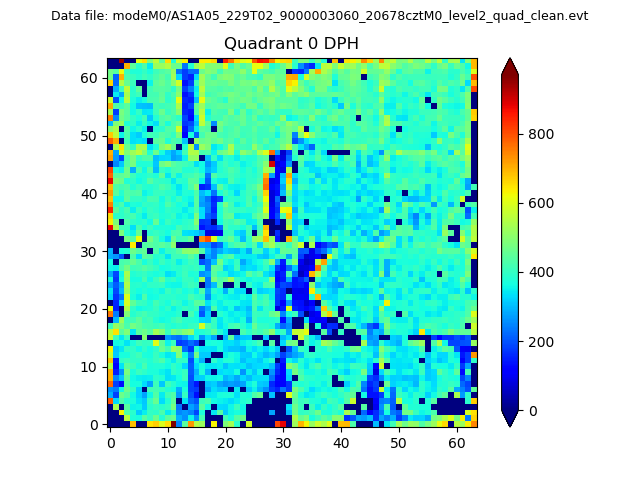 |
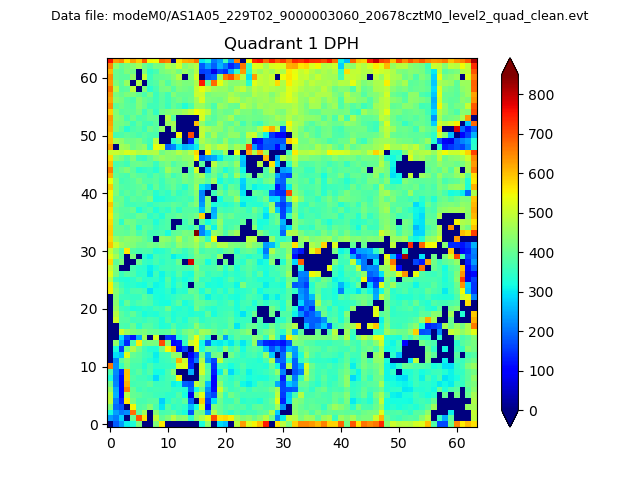 |
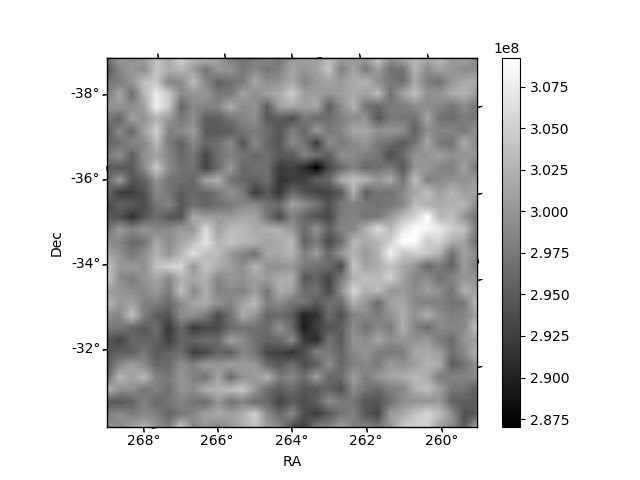
Quadrant B |
|---|---|---|---|
| Quadrant D | 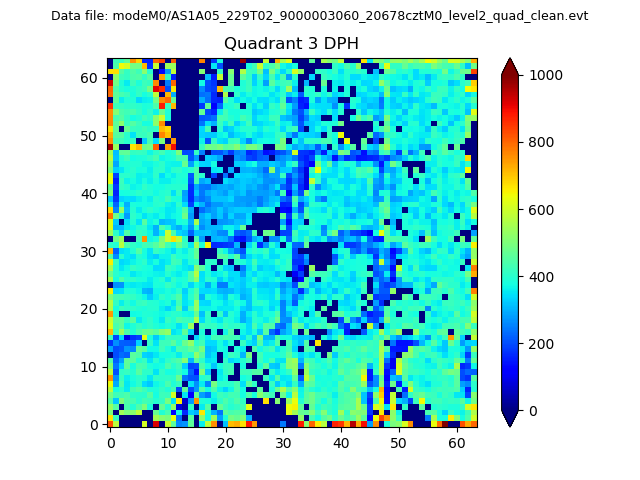 |
 |
Quadrant C |
| Plot type | Count rate plots | Images |
|---|---|---|
| Comparison with Poisson distribution Blue bars denote a histogram of data divided into 1 sec bins. Red curve is a Poisson curve with rate = median count rate of data. |
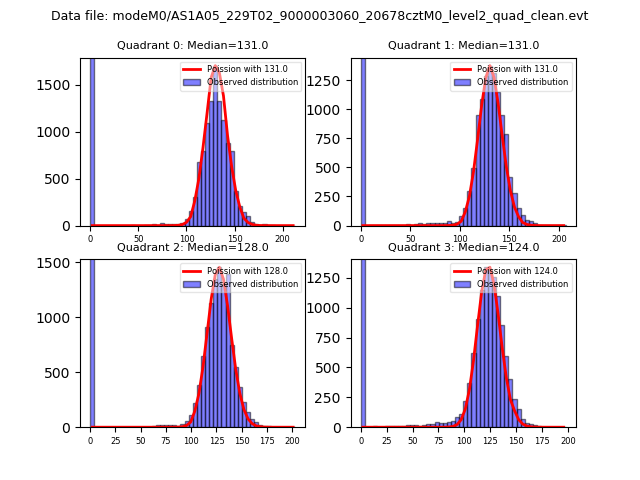 |
 |
| Quadrant-wise count rates Data is divided into 100 sec bins |
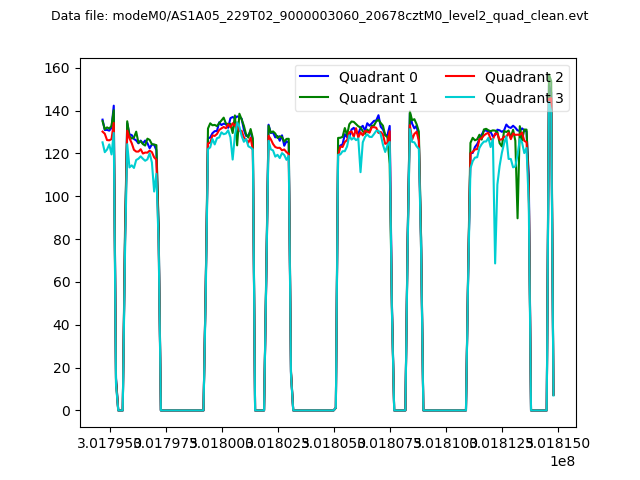 |
|
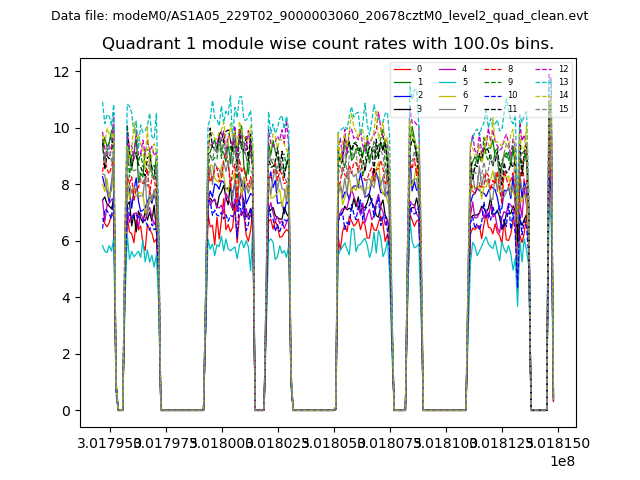
| Module-wise count rates for Quadrant A Data is divided into 100 sec bins |
 |
 |
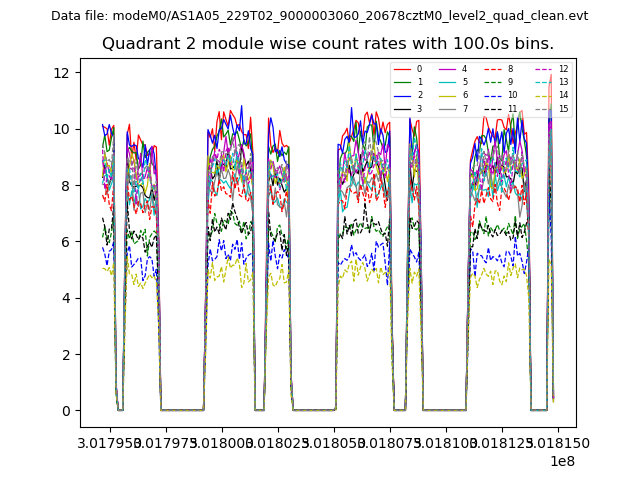
| Module-wise count rates for Quadrant B Data is divided into 100 sec bins |
 |
 |
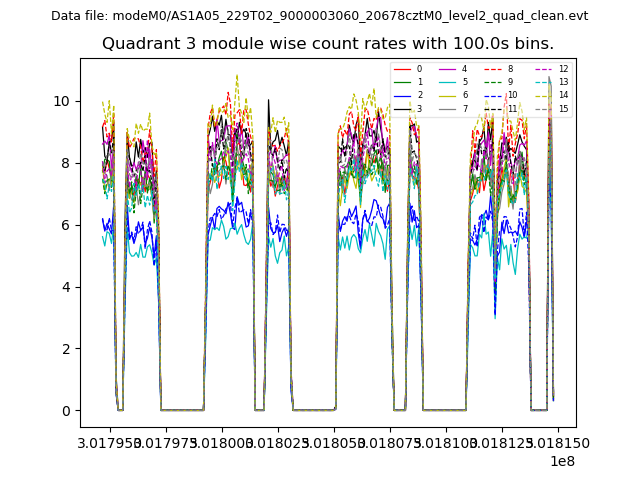
| Module-wise count rates for Quadrant C Data is divided into 100 sec bins |
 |
 |
| Module-wise count rates for Quadrant D Data is divided into 100 sec bins |
 |
 |
| Parameter | Plot |
|---|---|
| CZT HV Monitor | 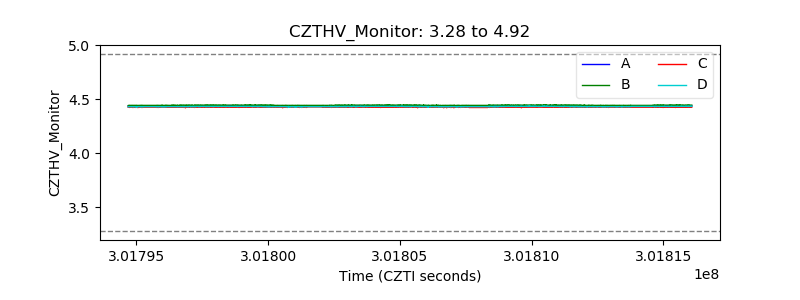 |
| D_VDD | 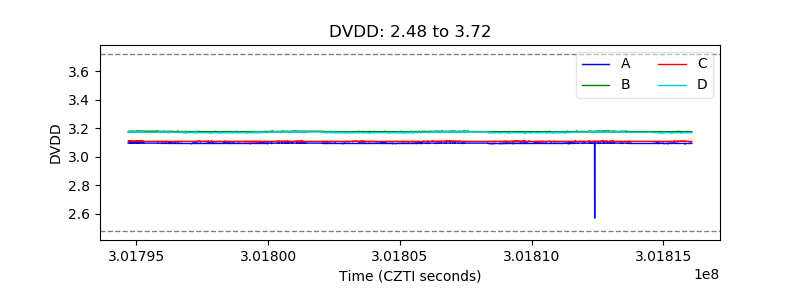 |
| Temperature 1 | 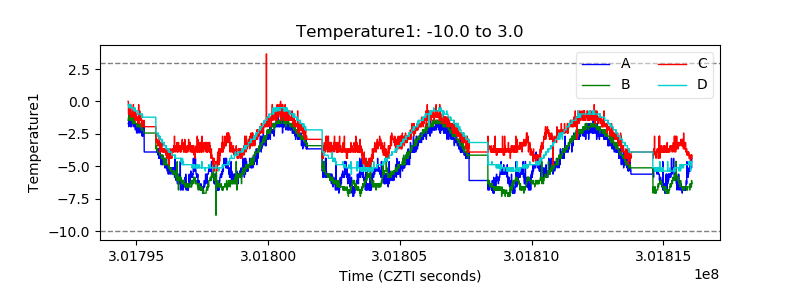 |
| Veto HV Monitor | 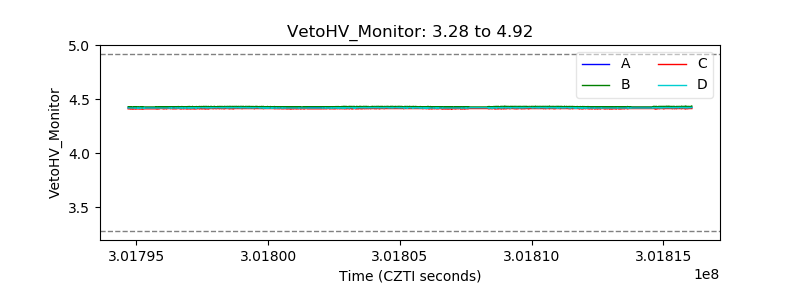 |
| Veto LLD | 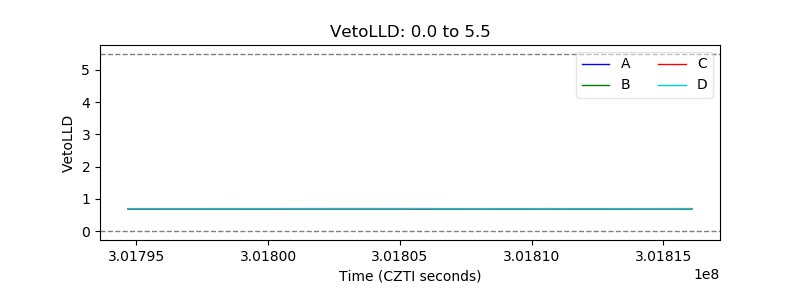 |
| Alpha Counter | 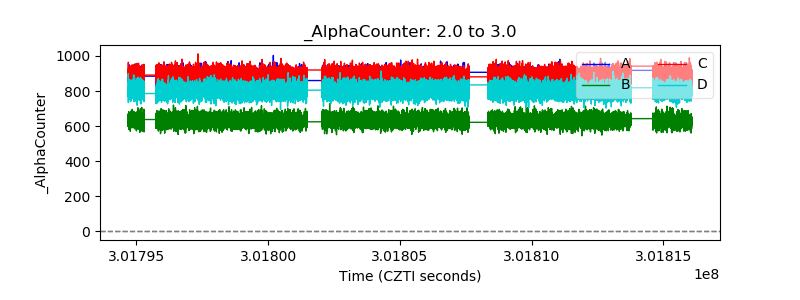 |
| _CPM_Rate | 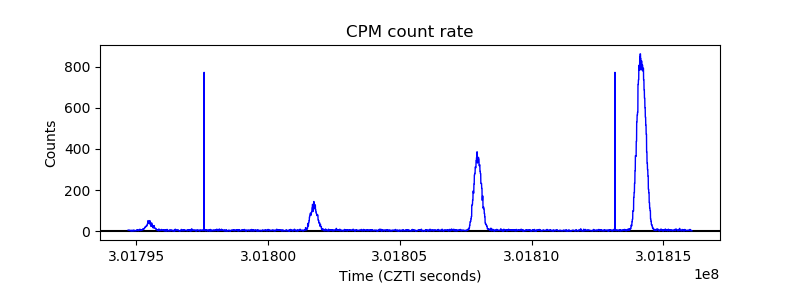 |
| CZT Counter | 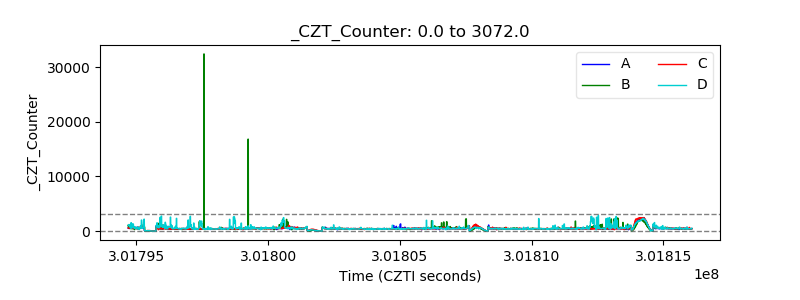 |
| +2.5 Volts monitor |  |
| +5 Volts monitor |  |
| _ROLL_ROT |  |
| _Roll_DEC |  |
| _Roll_RA | 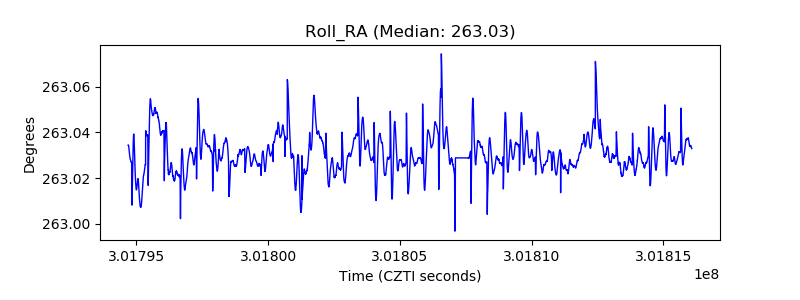 |
| Veto Counter | 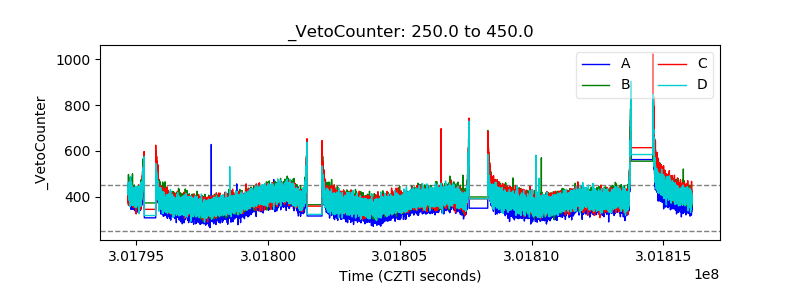 |