| Param | Original file | Final file |
|---|---|---|
| Filename | modeM0/AS1A05_229T02_9000003060_20679cztM0_level2.evt | modeM0/AS1A05_229T02_9000003060_20679cztM0_level2_quad_clean.evt |
| Size (bytes) | 483,770,880 | 67,236,480 |
| Size | 461.4 MB | 64.1 MB |
| Events in quadrant A | 3,621,563 | 394,729 |
| Events in quadrant B | 3,404,653 | 405,457 |
| Events in quadrant C | 3,213,984 | 395,314 |
| Events in quadrant D | 3,960,027 | 377,481 |
| Mode M0 | |||
|---|---|---|---|
| Quadrant | BADHDUFLAG | Total packets | Discarded packets |
| A | 0 | 14956 | 1 |
| B | 0 | 14247 | 2 |
| C | 0 | 13659 | 1 |
| D | 0 | 16180 | 1 |
| Mode SS | |||
|---|---|---|---|
| Quadrant | BADHDUFLAG | Total packets | Discarded packets |
| A | 0 | 134 | 0 |
| B | 0 | 134 | 0 |
| C | 0 | 134 | 0 |
| D | 0 | 134 | 0 |
| Mode M9 | |||
|---|---|---|---|
| Quadrant | BADHDUFLAG | Total packets | Discarded packets |
| A | 0 | 10 | 0 |
| B | 0 | 10 | 0 |
| C | 0 | 10 | 0 |
| D | 0 | 10 | 0 |
| Quadrant | Total seconds | Saturated seconds | Saturation percentage |
|---|---|---|---|
| A | 6641 | 132 | 1.987652% |
| B | 6640 | 78 | 1.174699% |
| C | 6640 | 82 | 1.234940% |
| D | 6641 | 152 | 2.288812% |
Noise dominated data is calculated using 1-second bins in cleaned event files. If a bin has >2000 counts, and if more than 50% of those come from <1% of pixels, then it is considered to be noise-dominated and hence unusable.
| Quadrant | # 1 sec bins | Bins with >0 counts | Bins with >2000 counts | High rate bins dominated by noise | Noise dominated (total time) | Noise dominated (detector-on time) | Marked lightcurve |
|---|---|---|---|---|---|---|---|
| A | 7636 | 6642 | 78 | 78 | 1.02% | 1.17% | 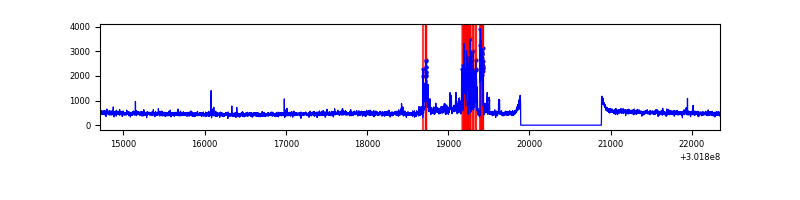 |
| B | 7635 | 6641 | 12 | 12 | 0.16% | 0.18% | 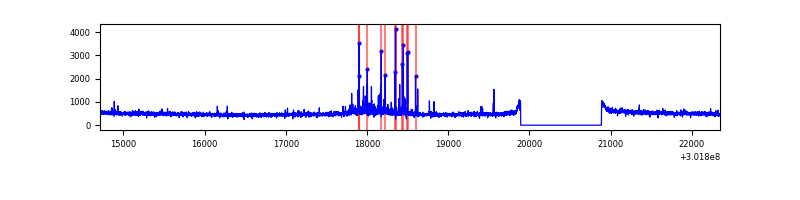 |
| C | 7635 | 6641 | 0 | 0 | 0.00% | 0.00% | 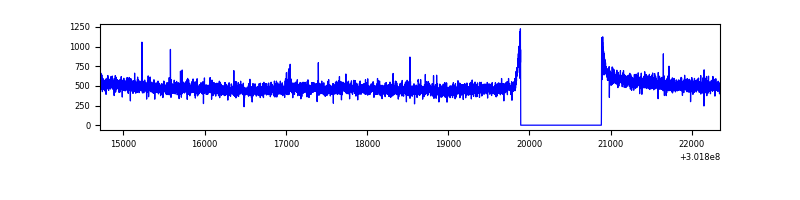 |
| D | 7636 | 6642 | 114 | 114 | 1.49% | 1.72% | 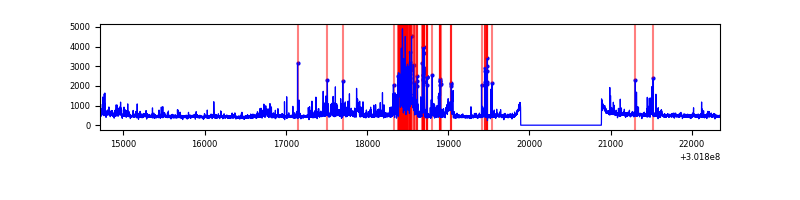 |
Top three noisy pixels from each quadrant. If the there are fewer than three noisy pixels in the level2.evt file, extra rows are filled as -1
| Pixel properties | Quadrant properties | ||||||
|---|---|---|---|---|---|---|---|
| Quadrant | DetID | PixID | Counts | Sigma | Mean | Median | Sigma |
| A | 5 | 16 | 471055 | 2862.34 | 813 | 797 | 164.3 |
| A | 12 | 16 | 19078 | 111.27 | 813 | 797 | 164.3 |
| A | 12 | 194 | 9274 | 51.6 | 813 | 797 | 164.3 |
| B | 7 | 220 | 141545 | 909.12 | 817 | 797 | 154.8 |
| B | 0 | 229 | 19649 | 121.77 | 817 | 797 | 154.8 |
| B | 12 | 111 | 18685 | 115.54 | 817 | 797 | 154.8 |
| C | 14 | 238 | 124296 | 670.08 | 788 | 793 | 184.3 |
| C | 3 | 233 | 6955 | 33.43 | 788 | 793 | 184.3 |
| C | 5 | 4 | 5707 | 26.66 | 788 | 793 | 184.3 |
| D | 1 | 52 | 832151 | 4376.21 | 788 | 768 | 190.0 |
| D | 13 | 153 | 55375 | 287.44 | 788 | 768 | 190.0 |
| D | 2 | 234 | 29910 | 153.4 | 788 | 768 | 190.0 |
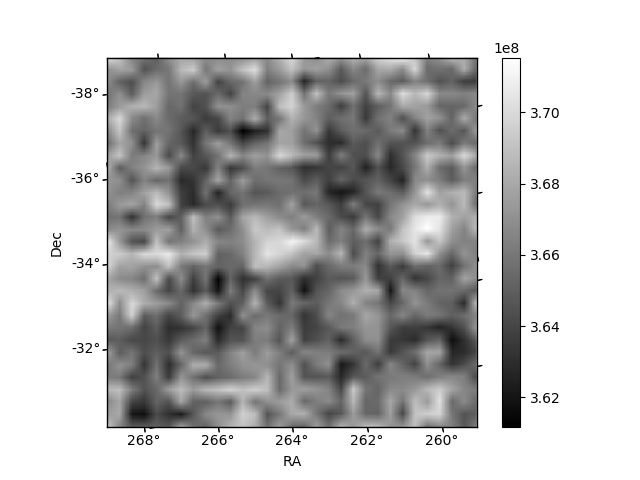
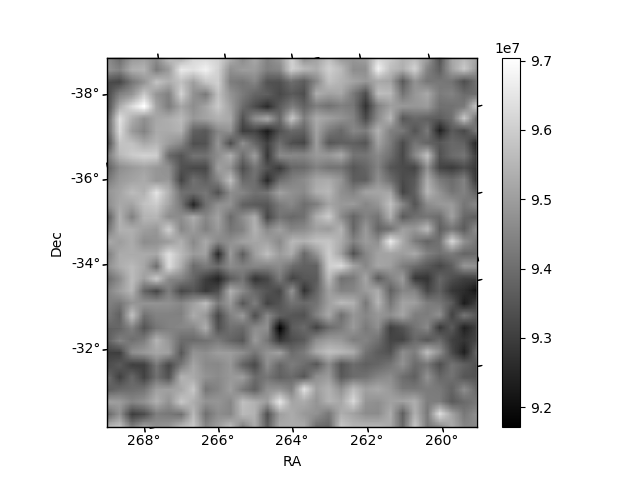
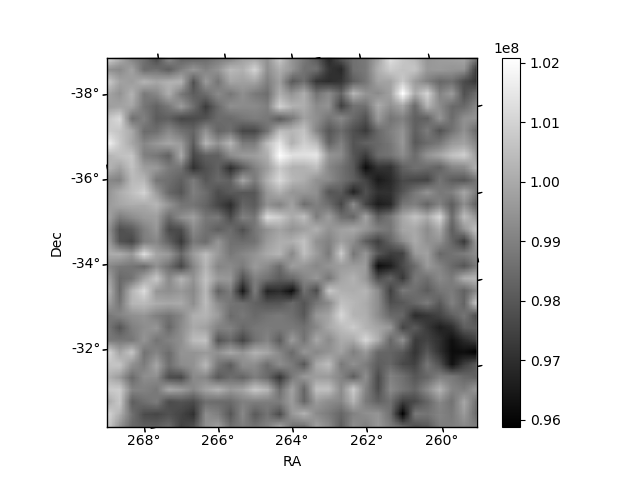
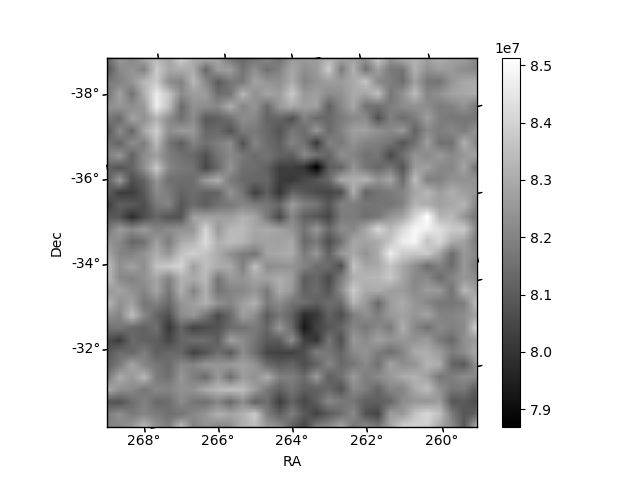
Histogram calculated using DETX and DETY for each event in the final _common_clean file
| Quadrant A | 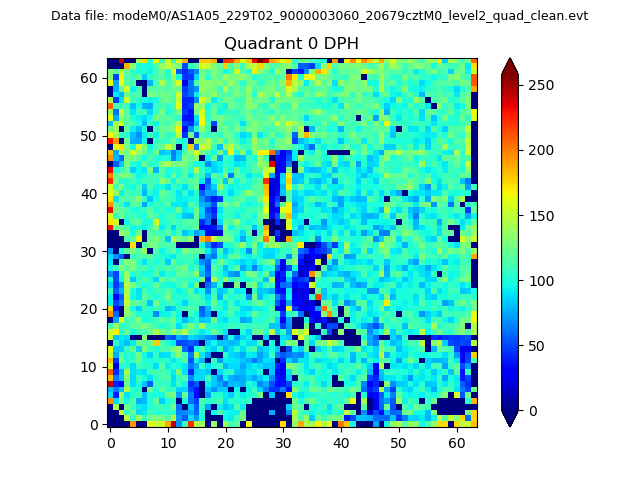 |
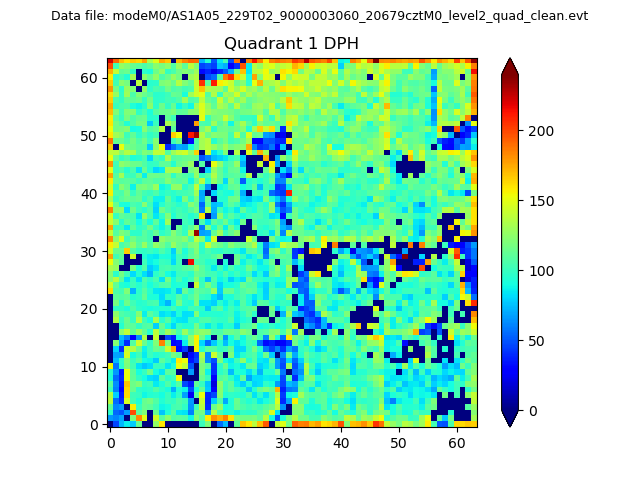 |
Quadrant B |
|---|---|---|---|
| Quadrant D |  |
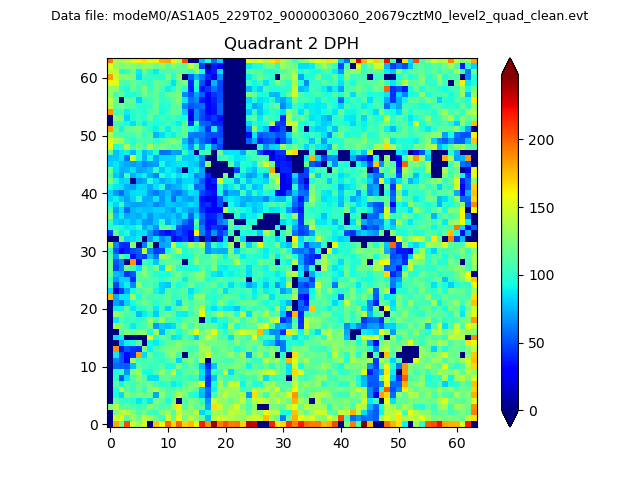 |
Quadrant C |
| Plot type | Count rate plots | Images |
|---|---|---|
| Comparison with Poisson distribution Blue bars denote a histogram of data divided into 1 sec bins. Red curve is a Poisson curve with rate = median count rate of data. |
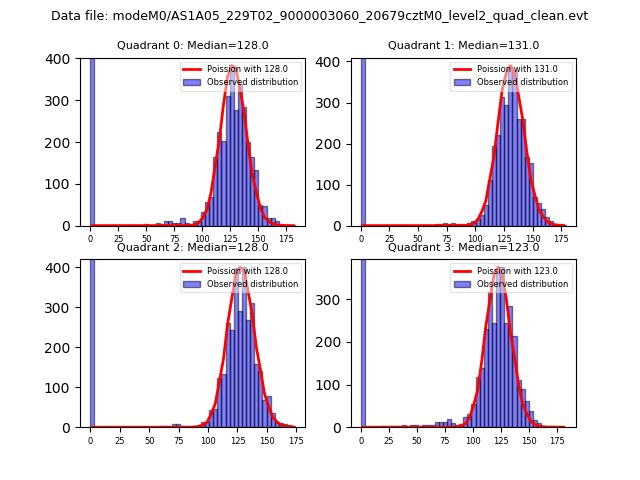 |
 |
| Quadrant-wise count rates Data is divided into 100 sec bins |
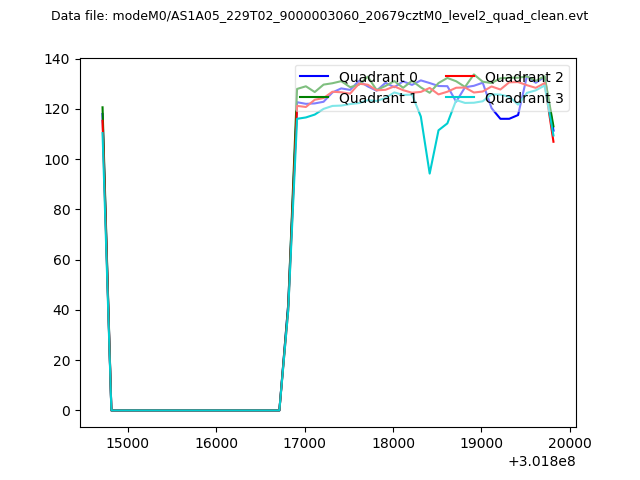 |
|
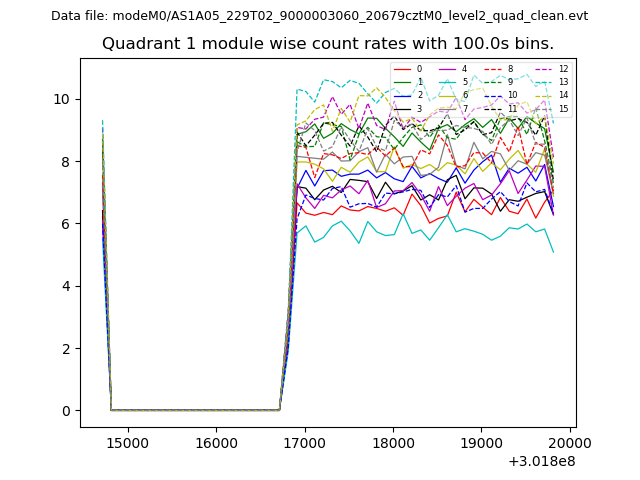
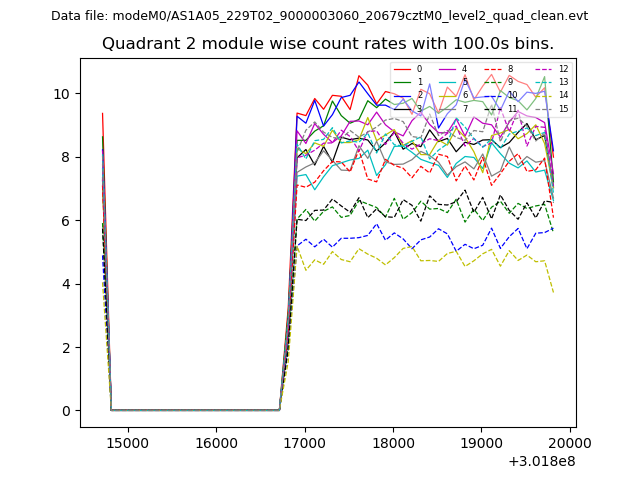
| Module-wise count rates for Quadrant A Data is divided into 100 sec bins |
 |
 |
| Module-wise count rates for Quadrant B Data is divided into 100 sec bins |
 |
 |
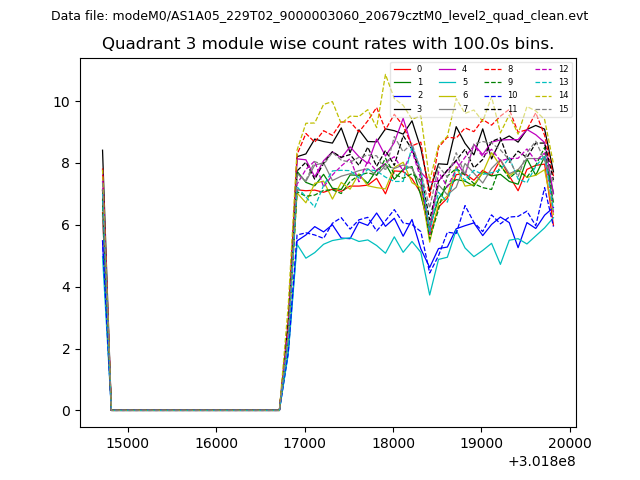
| Module-wise count rates for Quadrant C Data is divided into 100 sec bins |
 |
 |
| Module-wise count rates for Quadrant D Data is divided into 100 sec bins |
 |
 |
| Parameter | Plot |
|---|---|
| CZT HV Monitor | 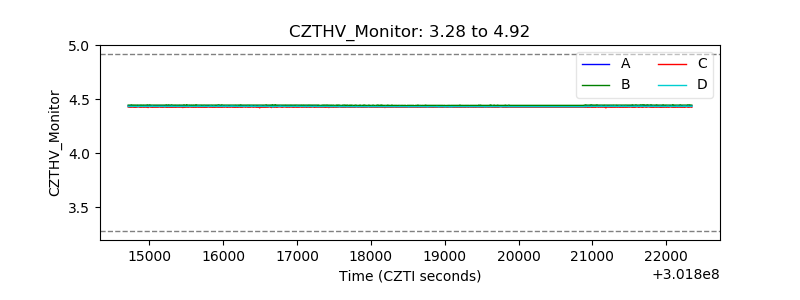 |
| D_VDD | 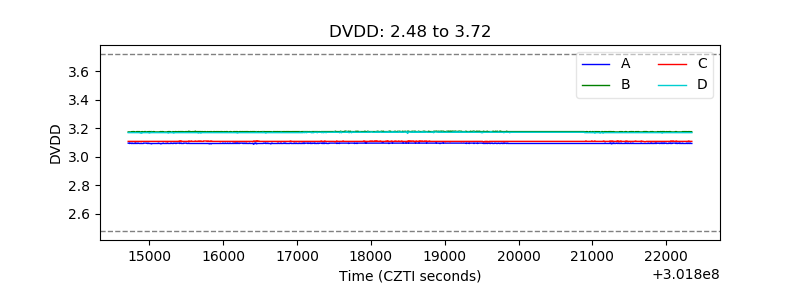 |
| Temperature 1 | 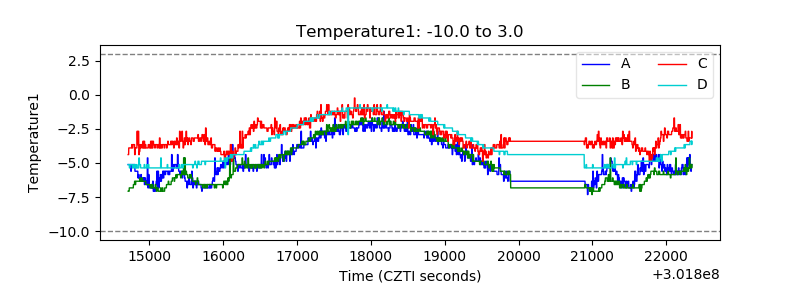 |
| Veto HV Monitor | 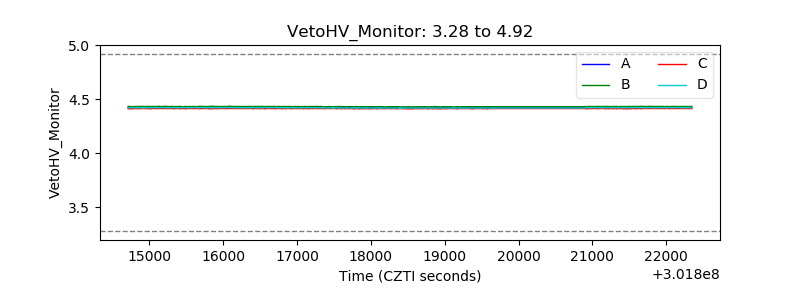 |
| Veto LLD | 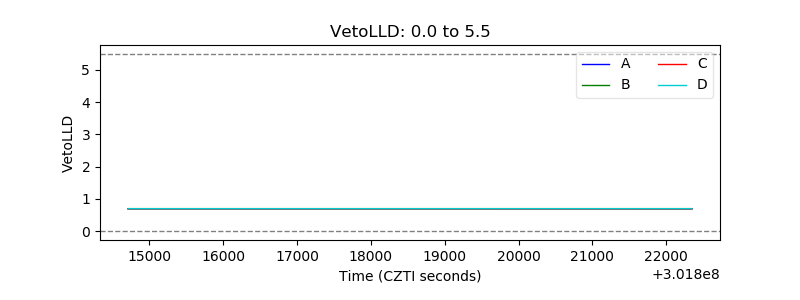 |
| Alpha Counter | 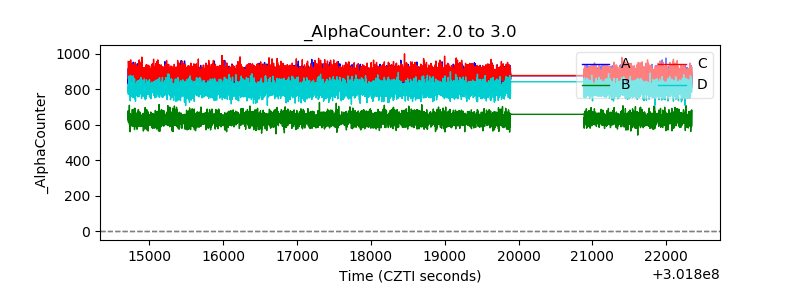 |
| _CPM_Rate |  |
| CZT Counter | 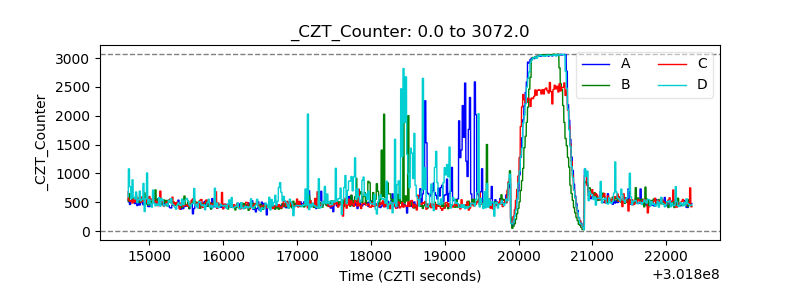 |
| +2.5 Volts monitor | 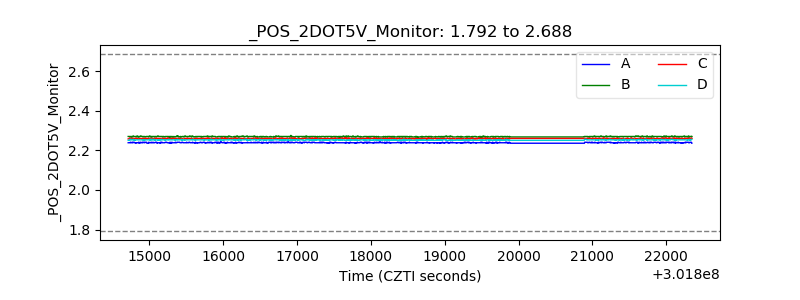 |
| +5 Volts monitor |  |
| _ROLL_ROT |  |
| _Roll_DEC | 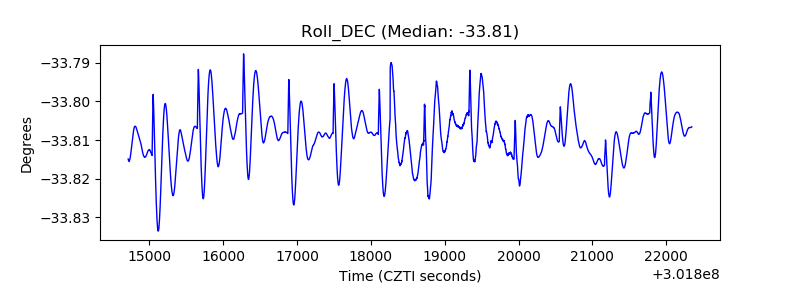 |
| _Roll_RA | 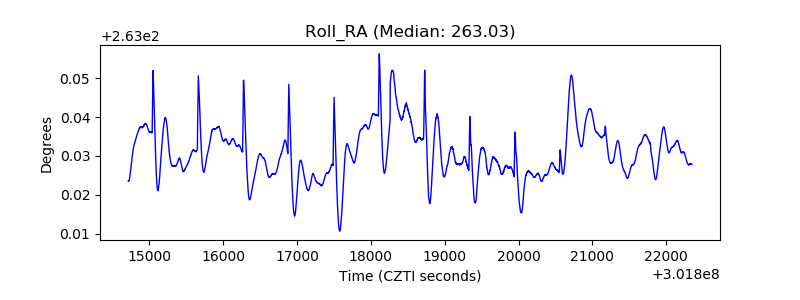 |
| Veto Counter |  |