| Param | Original file | Final file |
|---|---|---|
| Filename | modeM0/AS1A05_229T02_9000003060_20683cztM0_level2.evt | modeM0/AS1A05_229T02_9000003060_20683cztM0_level2_quad_clean.evt |
| Size (bytes) | 546,730,560 | 103,622,400 |
| Size | 521.4 MB | 98.8 MB |
| Events in quadrant A | 3,438,862 | 693,985 |
| Events in quadrant B | 3,586,472 | 696,256 |
| Events in quadrant C | 3,470,288 | 672,723 |
| Events in quadrant D | 5,636,323 | 636,621 |
| Mode M0 | |||
|---|---|---|---|
| Quadrant | BADHDUFLAG | Total packets | Discarded packets |
| A | 0 | 14318 | 2 |
| B | 0 | 14734 | 2 |
| C | 0 | 14455 | 2 |
| D | 0 | 21305 | 2 |
| Mode SS | |||
|---|---|---|---|
| Quadrant | BADHDUFLAG | Total packets | Discarded packets |
| A | 0 | 132 | 0 |
| B | 0 | 132 | 0 |
| C | 0 | 132 | 0 |
| D | 0 | 132 | 0 |
| Mode M9 | |||
|---|---|---|---|
| Quadrant | BADHDUFLAG | Total packets | Discarded packets |
| A | 0 | 24 | 0 |
| B | 0 | 24 | 0 |
| C | 0 | 24 | 0 |
| D | 0 | 24 | 0 |
| Quadrant | Total seconds | Saturated seconds | Saturation percentage |
|---|---|---|---|
| A | 6279 | 121 | 1.927058% |
| B | 6278 | 145 | 2.309653% |
| C | 6278 | 177 | 2.819369% |
| D | 6279 | 371 | 5.908584% |
Noise dominated data is calculated using 1-second bins in cleaned event files. If a bin has >2000 counts, and if more than 50% of those come from <1% of pixels, then it is considered to be noise-dominated and hence unusable.
| Quadrant | # 1 sec bins | Bins with >0 counts | Bins with >2000 counts | High rate bins dominated by noise | Noise dominated (total time) | Noise dominated (detector-on time) | Marked lightcurve |
|---|---|---|---|---|---|---|---|
| A | 8789 | 6280 | 0 | 0 | 0.00% | 0.00% | 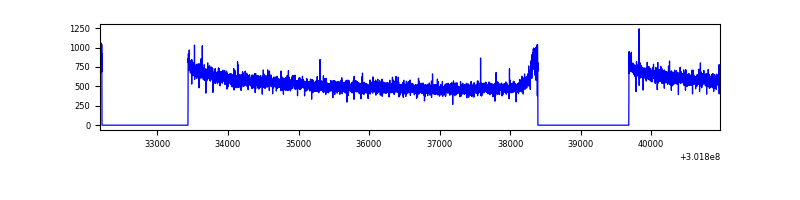 |
| B | 8788 | 6280 | 8 | 8 | 0.09% | 0.13% | 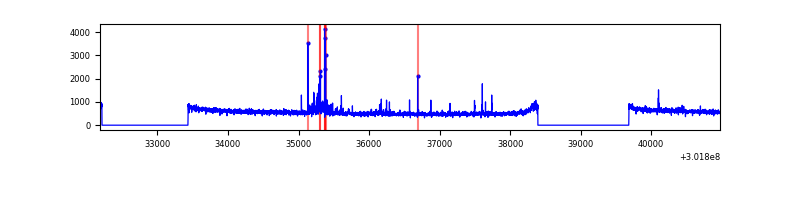 |
| C | 8788 | 6280 | 0 | 0 | 0.00% | 0.00% | 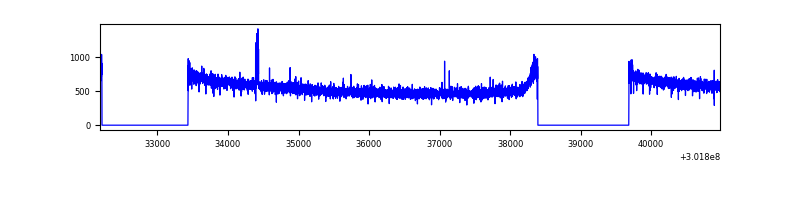 |
| D | 8789 | 6281 | 345 | 345 | 3.93% | 5.49% | 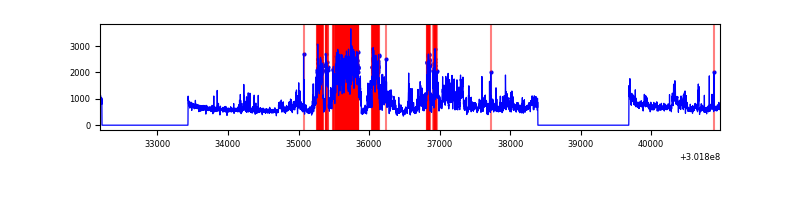 |
Top three noisy pixels from each quadrant. If the there are fewer than three noisy pixels in the level2.evt file, extra rows are filled as -1
| Pixel properties | Quadrant properties | ||||||
|---|---|---|---|---|---|---|---|
| Quadrant | DetID | PixID | Counts | Sigma | Mean | Median | Sigma |
| A | 0 | 226 | 7824 | 39.23 | 895 | 882 | 176.9 |
| A | 3 | 137 | 6622 | 32.44 | 895 | 882 | 176.9 |
| A | 12 | 194 | 6467 | 31.56 | 895 | 882 | 176.9 |
| B | 7 | 220 | 68729 | 413.37 | 882 | 863 | 164.2 |
| B | 0 | 190 | 24567 | 144.38 | 882 | 863 | 164.2 |
| B | 0 | 229 | 20852 | 121.75 | 882 | 863 | 164.2 |
| C | 14 | 238 | 137226 | 703.07 | 847 | 858 | 194.0 |
| C | 7 | 247 | 17401 | 85.29 | 847 | 858 | 194.0 |
| C | 3 | 233 | 15880 | 77.45 | 847 | 858 | 194.0 |
| D | 12 | 227 | 2180205 | 10576.31 | 864 | 841 | 206.1 |
| D | 1 | 52 | 70734 | 339.19 | 864 | 841 | 206.1 |
| D | 13 | 153 | 55772 | 266.58 | 864 | 841 | 206.1 |
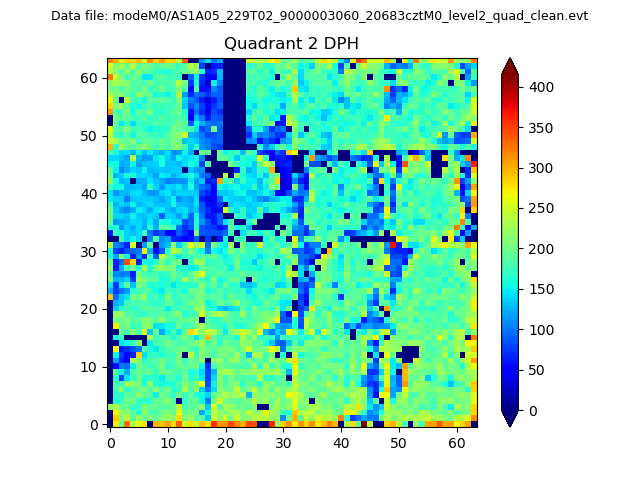
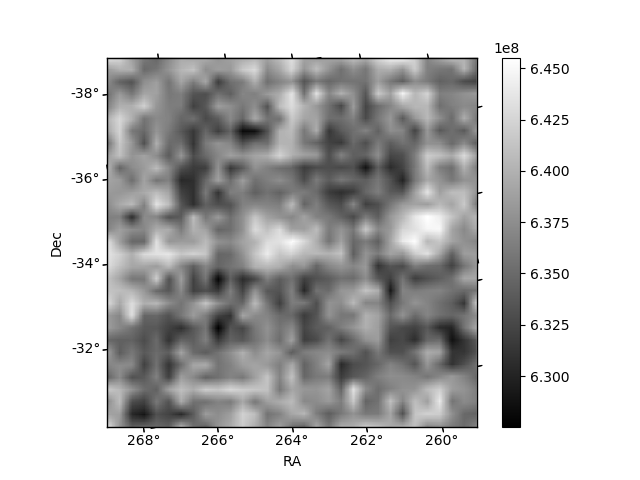
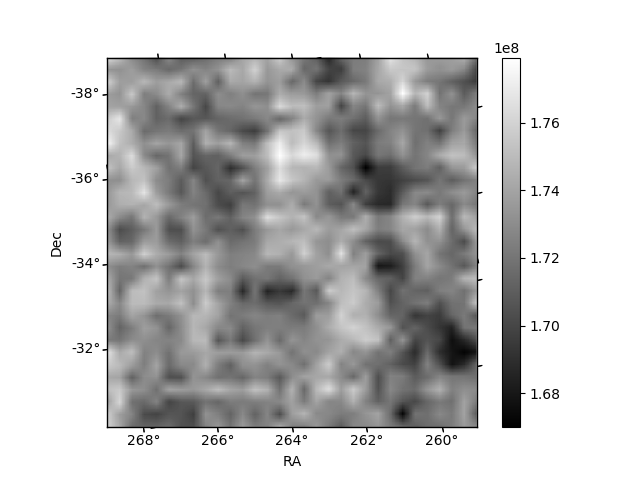
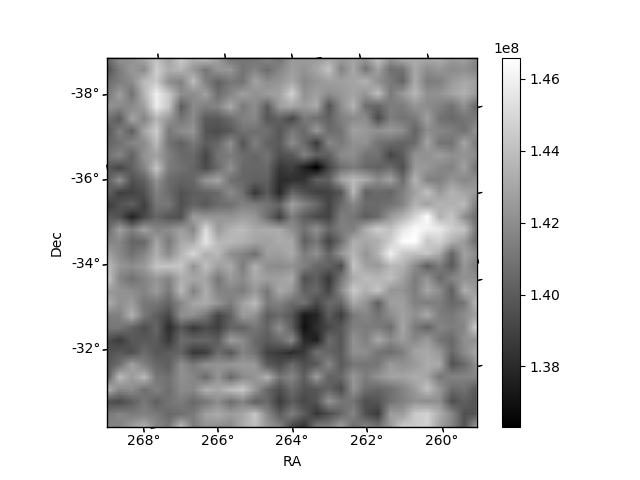
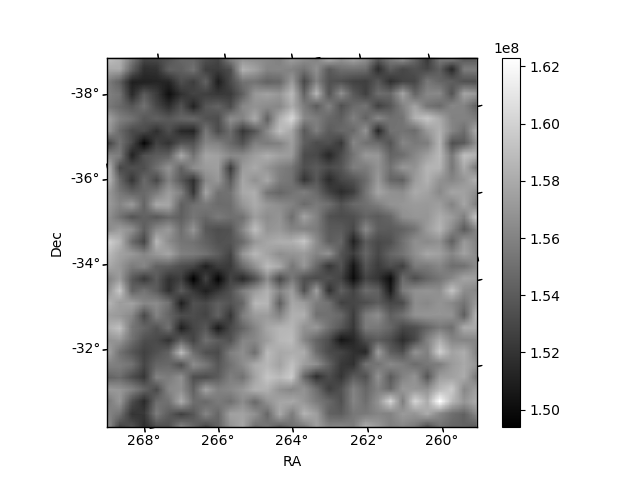
Histogram calculated using DETX and DETY for each event in the final _common_clean file
| Quadrant A | 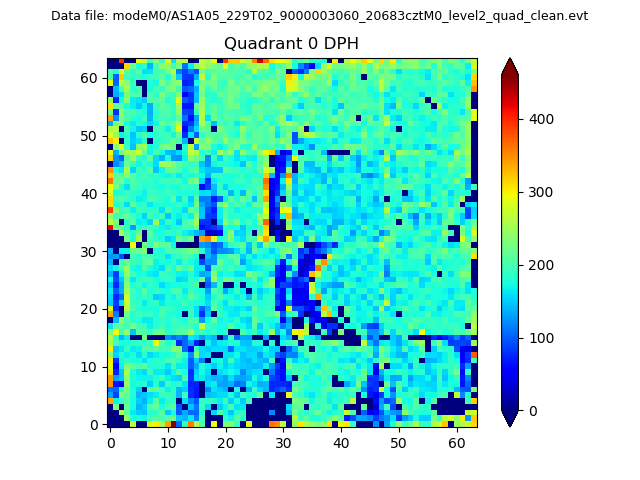 |
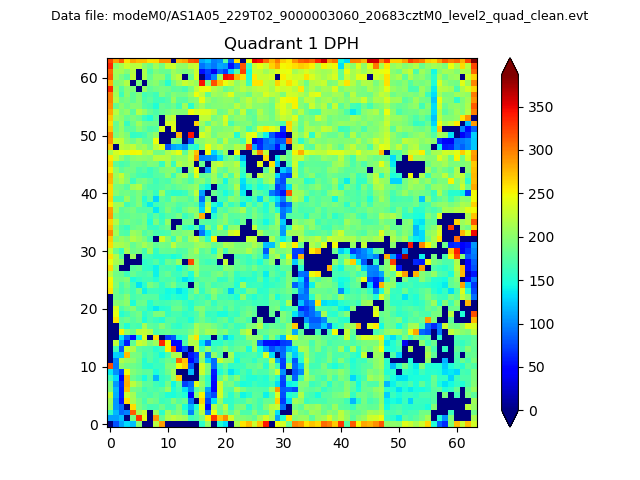 |
Quadrant B |
|---|---|---|---|
| Quadrant D | 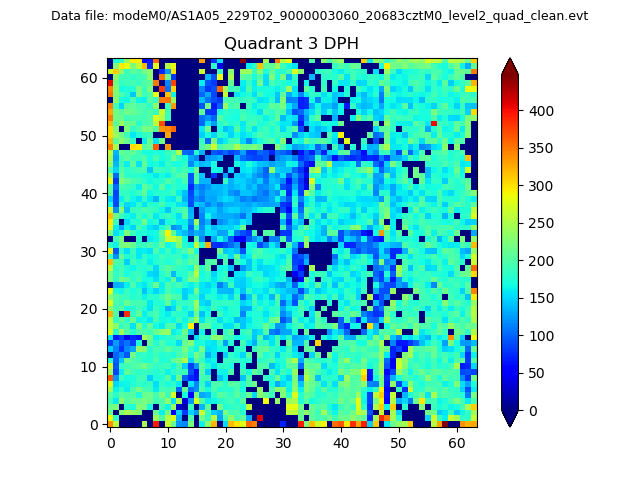 |
 |
Quadrant C |
| Plot type | Count rate plots | Images |
|---|---|---|
| Comparison with Poisson distribution Blue bars denote a histogram of data divided into 1 sec bins. Red curve is a Poisson curve with rate = median count rate of data. |
 |
 |
| Quadrant-wise count rates Data is divided into 100 sec bins |
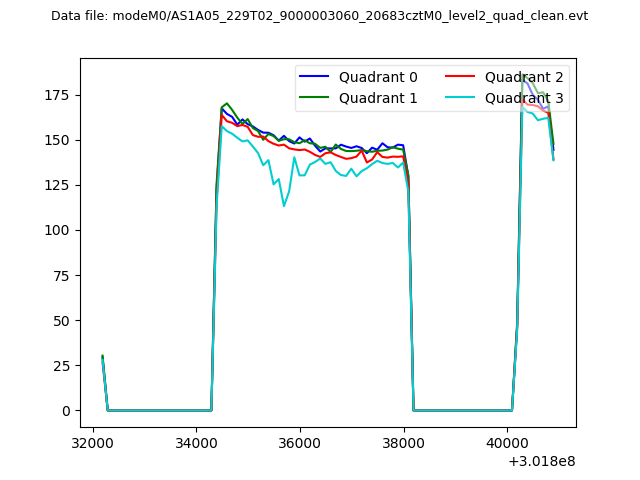 |
|
| Module-wise count rates for Quadrant A Data is divided into 100 sec bins |
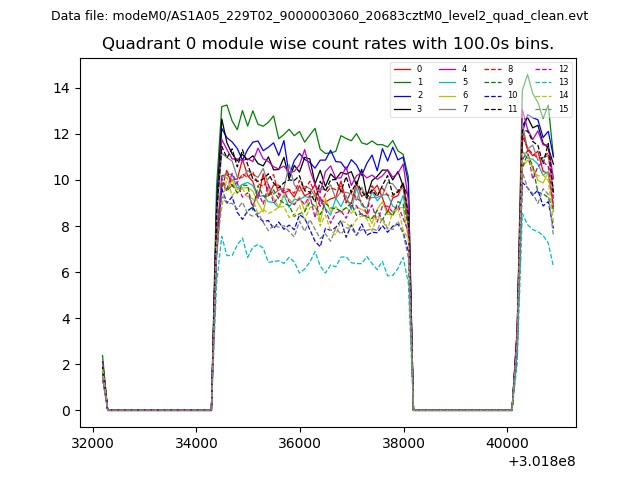 |
 |
| Module-wise count rates for Quadrant B Data is divided into 100 sec bins |
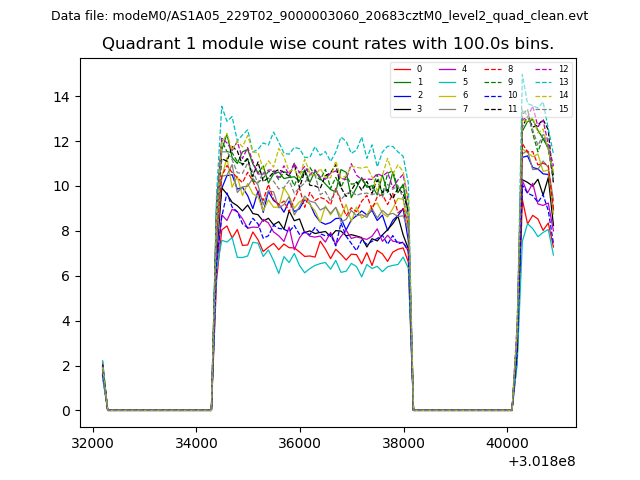 |
 |
| Module-wise count rates for Quadrant C Data is divided into 100 sec bins |
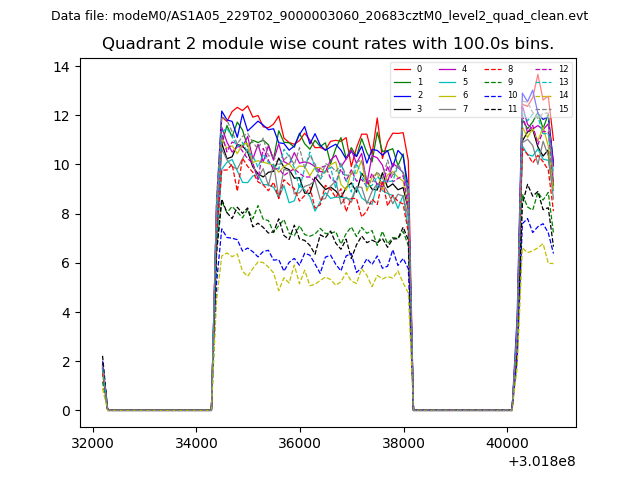 |
 |
| Module-wise count rates for Quadrant D Data is divided into 100 sec bins |
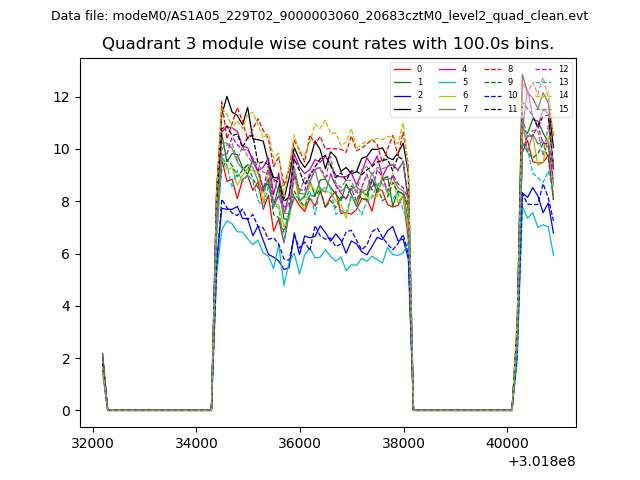 |
 |
| Parameter | Plot |
|---|---|
| CZT HV Monitor | 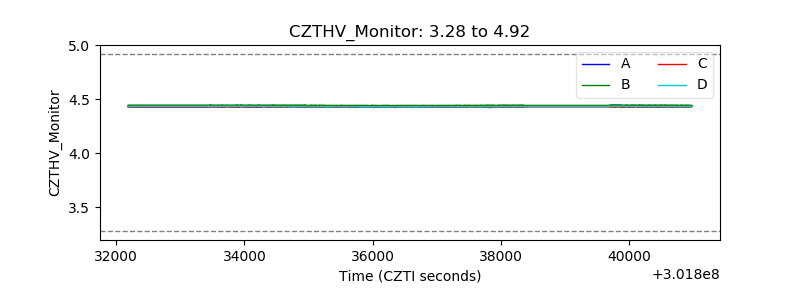 |
| D_VDD | 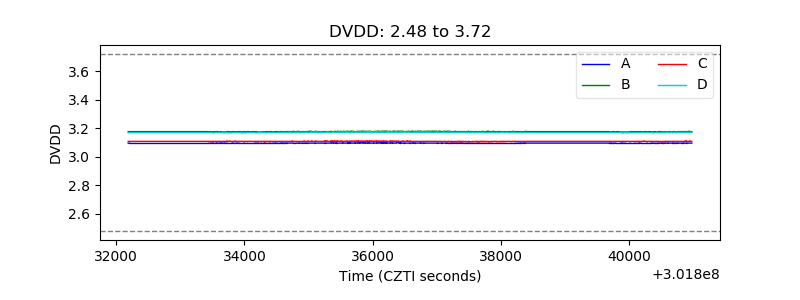 |
| Temperature 1 |  |
| Veto HV Monitor | 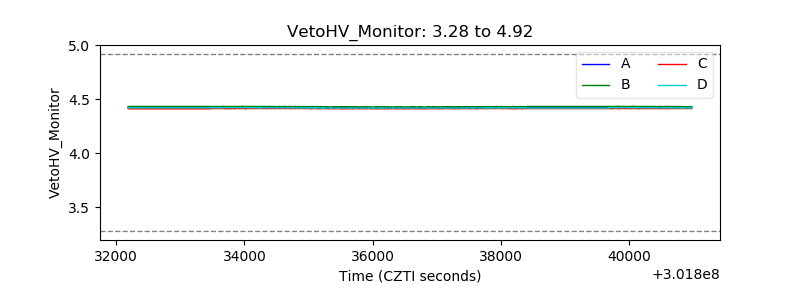 |
| Veto LLD |  |
| Alpha Counter | 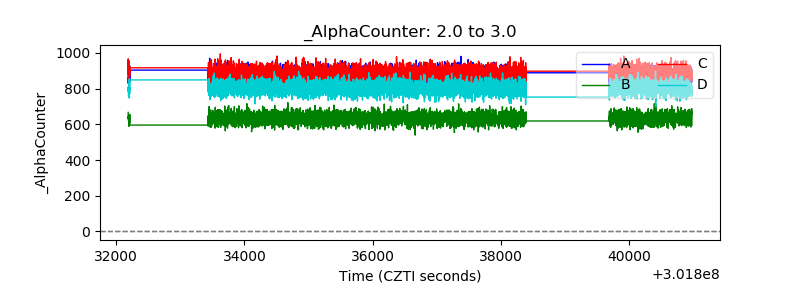 |
| _CPM_Rate | 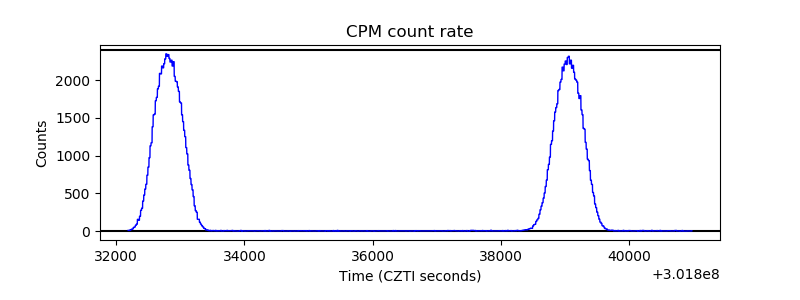 |
| CZT Counter | 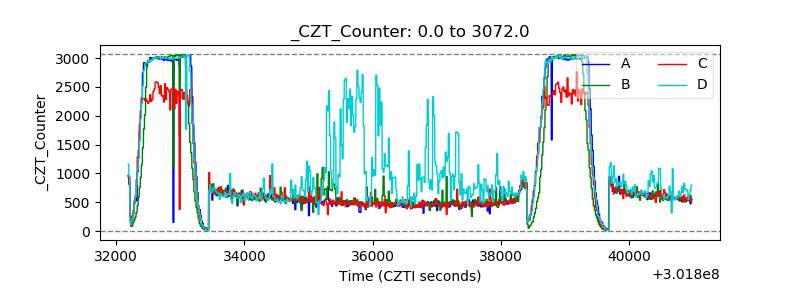 |
| +2.5 Volts monitor |  |
| +5 Volts monitor | 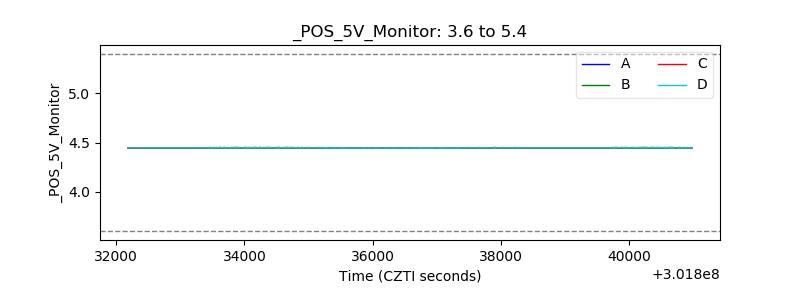 |
| _ROLL_ROT | 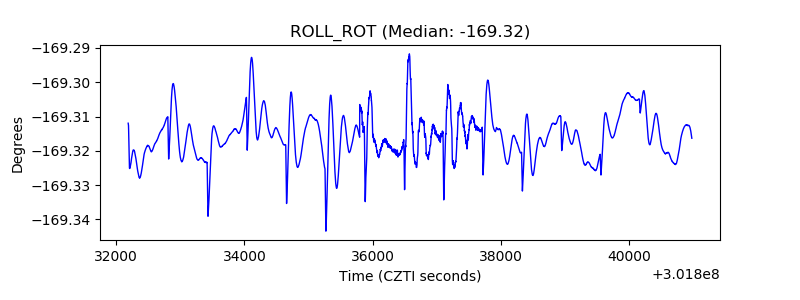 |
| _Roll_DEC | 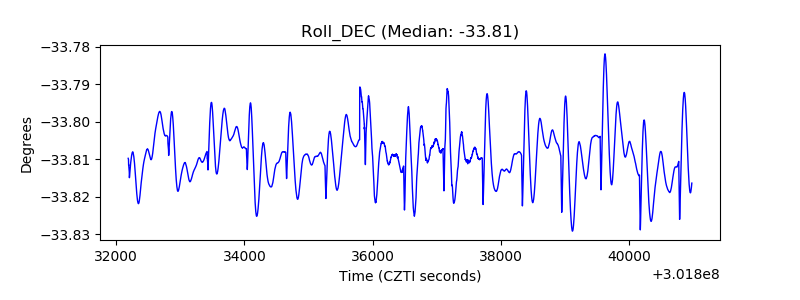 |
| _Roll_RA | 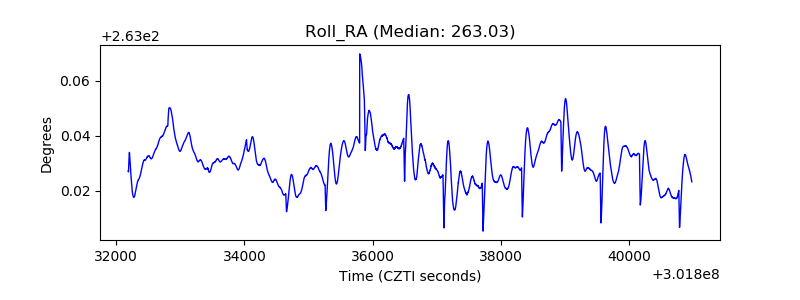 |
| Veto Counter | 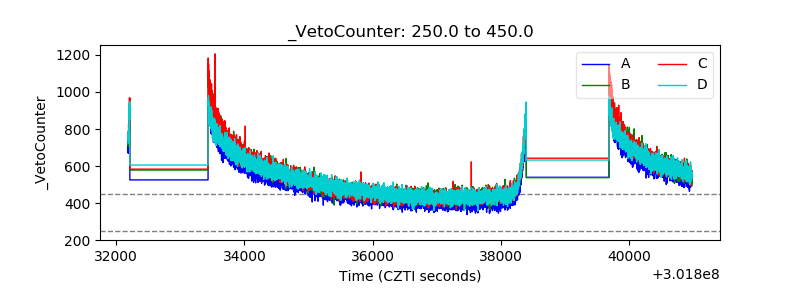 |