| Param | Original file | Final file |
|---|---|---|
| Filename | modeM0/AS1A05_229T02_9000003060_20684cztM0_level2.evt | modeM0/AS1A05_229T02_9000003060_20684cztM0_level2_quad_clean.evt |
| Size (bytes) | 502,467,840 | 115,960,320 |
| Size | 479.2 MB | 110.6 MB |
| Events in quadrant A | 3,423,697 | 791,248 |
| Events in quadrant B | 3,711,678 | 790,497 |
| Events in quadrant C | 3,415,765 | 756,907 |
| Events in quadrant D | 4,239,979 | 735,095 |
| Mode M0 | |||
|---|---|---|---|
| Quadrant | BADHDUFLAG | Total packets | Discarded packets |
| A | 0 | 14248 | 2 |
| B | 0 | 15196 | 2 |
| C | 0 | 14226 | 2 |
| D | 0 | 16939 | 3 |
| Mode SS | |||
|---|---|---|---|
| Quadrant | BADHDUFLAG | Total packets | Discarded packets |
| A | 0 | 130 | 0 |
| B | 0 | 130 | 0 |
| C | 0 | 130 | 0 |
| D | 0 | 130 | 0 |
| Mode M9 | |||
|---|---|---|---|
| Quadrant | BADHDUFLAG | Total packets | Discarded packets |
| A | 0 | 23 | 0 |
| B | 0 | 24 | 0 |
| C | 0 | 24 | 0 |
| D | 0 | 24 | 0 |
| Quadrant | Total seconds | Saturated seconds | Saturation percentage |
|---|---|---|---|
| A | 6274 | 95 | 1.514186% |
| B | 6274 | 134 | 2.135799% |
| C | 6274 | 132 | 2.103921% |
| D | 6273 | 231 | 3.682449% |
Noise dominated data is calculated using 1-second bins in cleaned event files. If a bin has >2000 counts, and if more than 50% of those come from <1% of pixels, then it is considered to be noise-dominated and hence unusable.
| Quadrant | # 1 sec bins | Bins with >0 counts | Bins with >2000 counts | High rate bins dominated by noise | Noise dominated (total time) | Noise dominated (detector-on time) | Marked lightcurve |
|---|---|---|---|---|---|---|---|
| A | 7609 | 6275 | 0 | 0 | 0.00% | 0.00% | 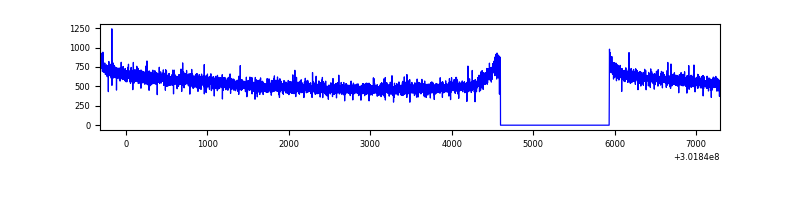 |
| B | 7609 | 6275 | 18 | 18 | 0.24% | 0.29% | 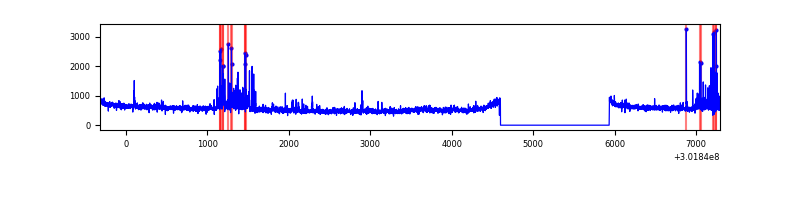 |
| C | 7609 | 6275 | 0 | 0 | 0.00% | 0.00% | 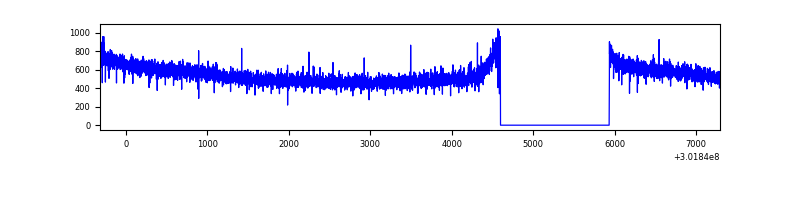 |
| D | 7608 | 6274 | 106 | 106 | 1.39% | 1.69% | 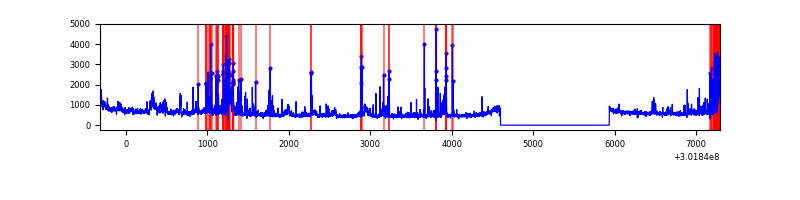 |
Top three noisy pixels from each quadrant. If the there are fewer than three noisy pixels in the level2.evt file, extra rows are filled as -1
| Pixel properties | Quadrant properties | ||||||
|---|---|---|---|---|---|---|---|
| Quadrant | DetID | PixID | Counts | Sigma | Mean | Median | Sigma |
| A | 0 | 226 | 7835 | 39.14 | 891 | 875 | 177.8 |
| A | 3 | 137 | 6501 | 31.64 | 891 | 875 | 177.8 |
| A | 12 | 194 | 6387 | 31.0 | 891 | 875 | 177.8 |
| B | 7 | 220 | 205145 | 1269.29 | 870 | 852 | 160.9 |
| B | 0 | 229 | 32622 | 197.39 | 870 | 852 | 160.9 |
| B | 0 | 190 | 27114 | 163.17 | 870 | 852 | 160.9 |
| C | 14 | 238 | 134286 | 699.25 | 834 | 842 | 190.8 |
| C | 3 | 233 | 23699 | 119.77 | 834 | 842 | 190.8 |
| C | 13 | 61 | 5939 | 26.71 | 834 | 842 | 190.8 |
| D | 13 | 138 | 311038 | 1522.76 | 854 | 831 | 203.7 |
| D | 12 | 227 | 234282 | 1145.97 | 854 | 831 | 203.7 |
| D | 1 | 52 | 200073 | 978.05 | 854 | 831 | 203.7 |
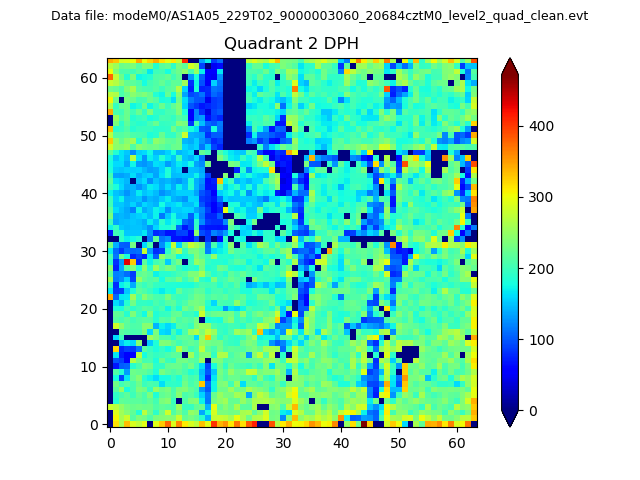
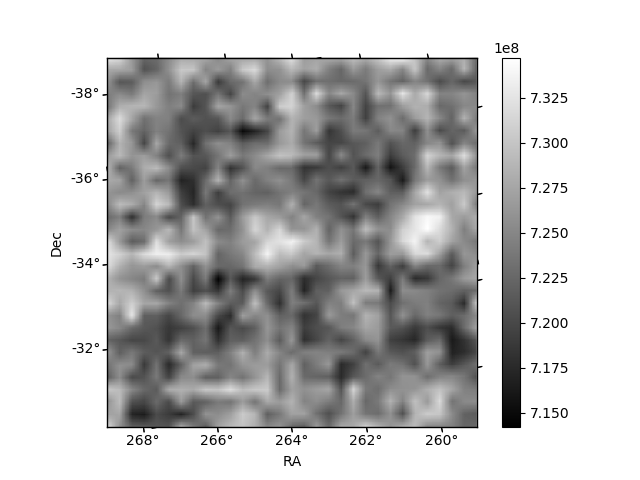
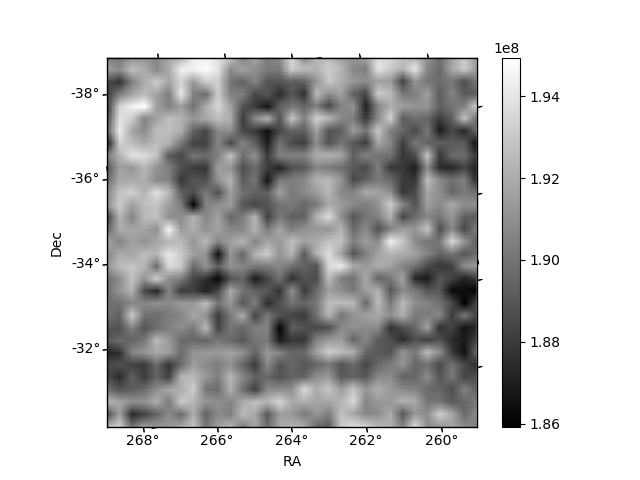
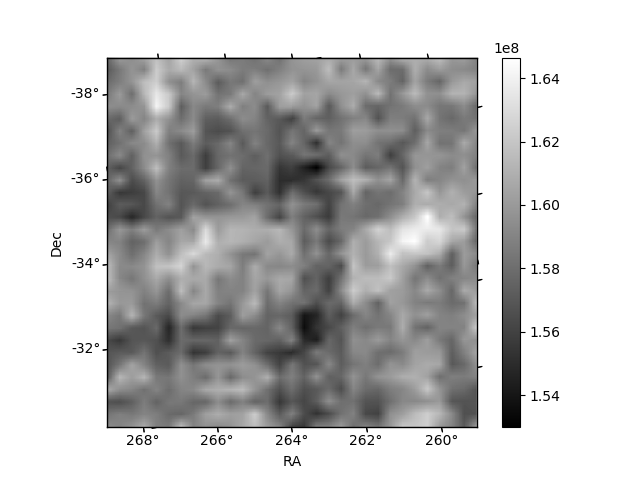
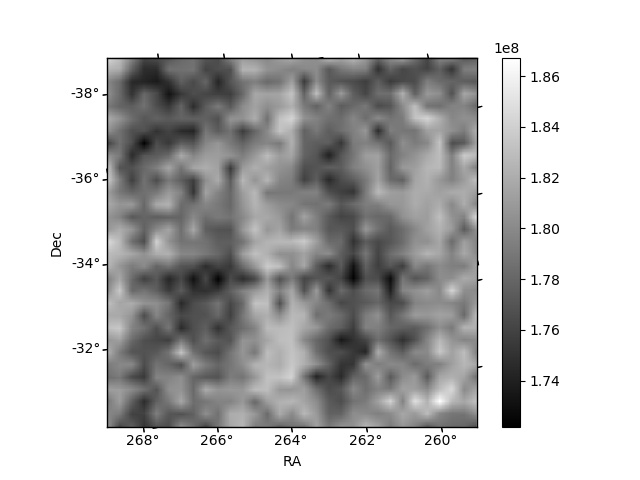
Histogram calculated using DETX and DETY for each event in the final _common_clean file
| Quadrant A | 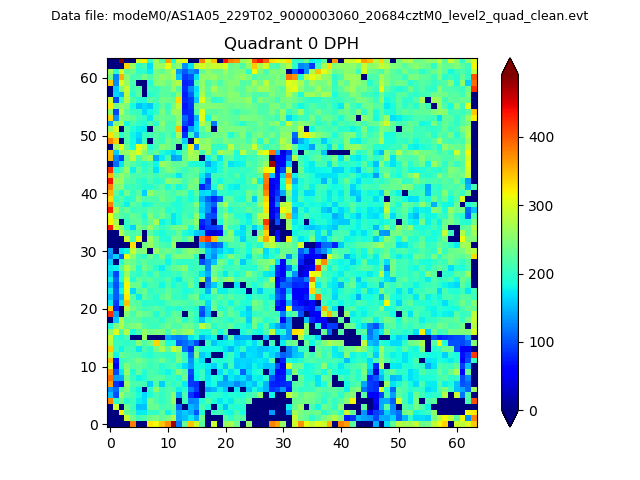 |
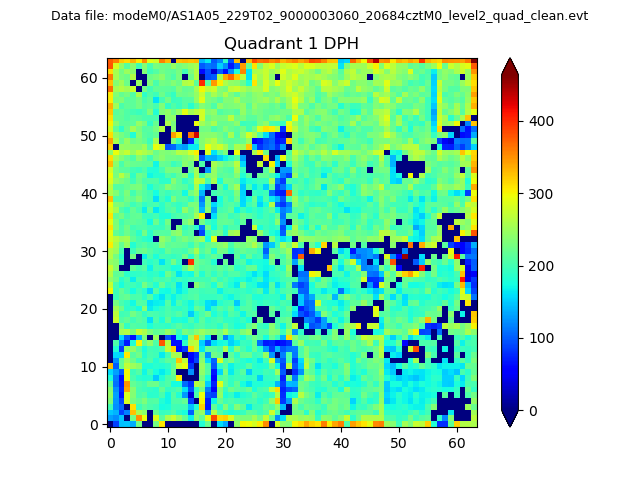 |
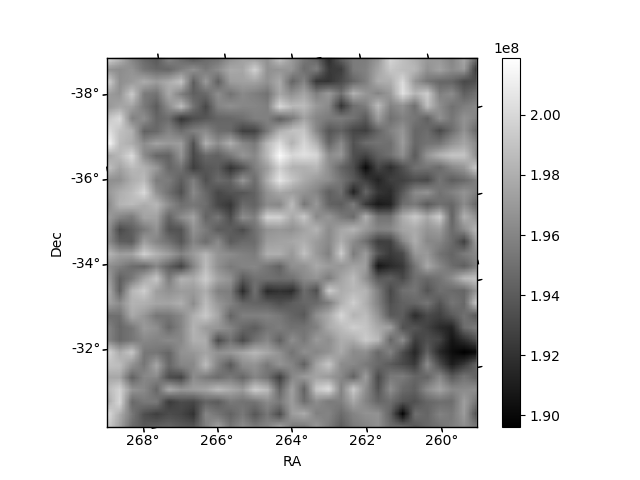
Quadrant B |
|---|---|---|---|
| Quadrant D | 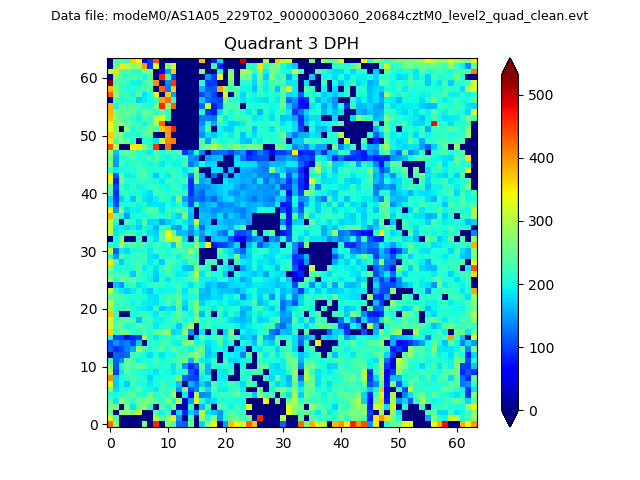 |
 |
Quadrant C |
| Plot type | Count rate plots | Images |
|---|---|---|
| Comparison with Poisson distribution Blue bars denote a histogram of data divided into 1 sec bins. Red curve is a Poisson curve with rate = median count rate of data. |
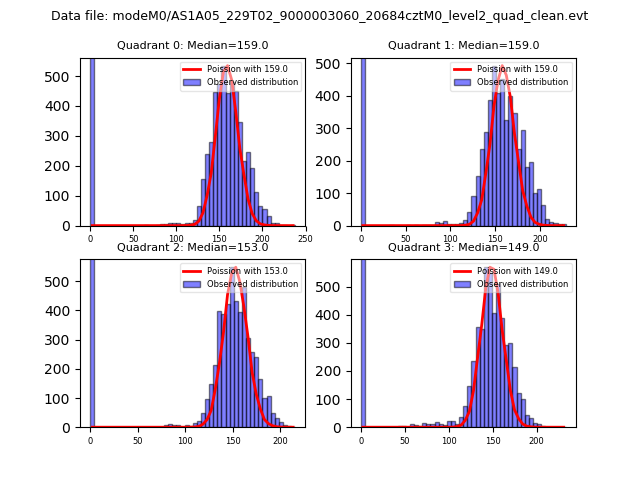 |
 |
| Quadrant-wise count rates Data is divided into 100 sec bins |
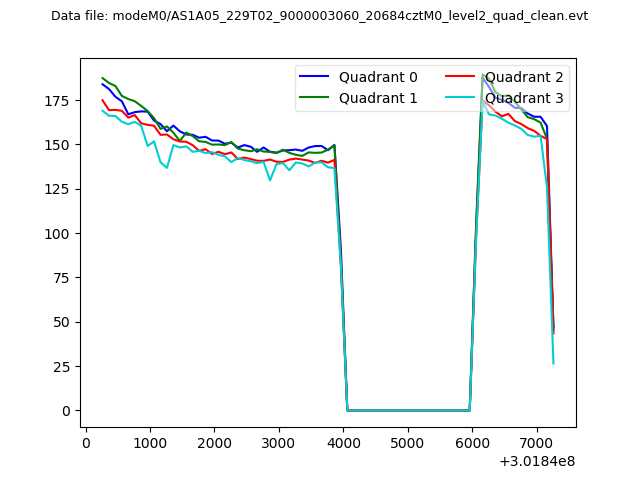 |
|
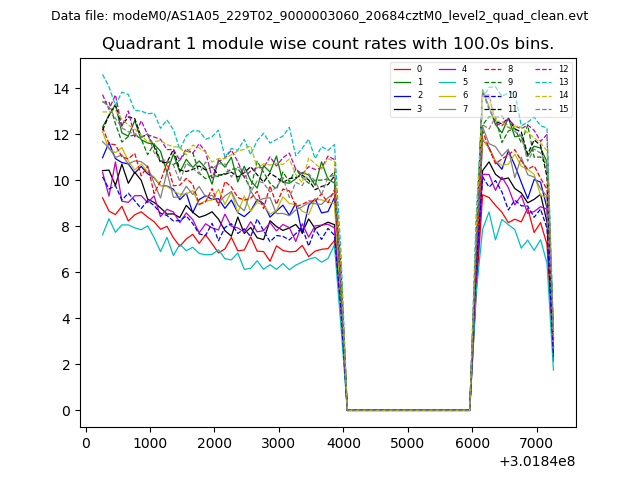
| Module-wise count rates for Quadrant A Data is divided into 100 sec bins |
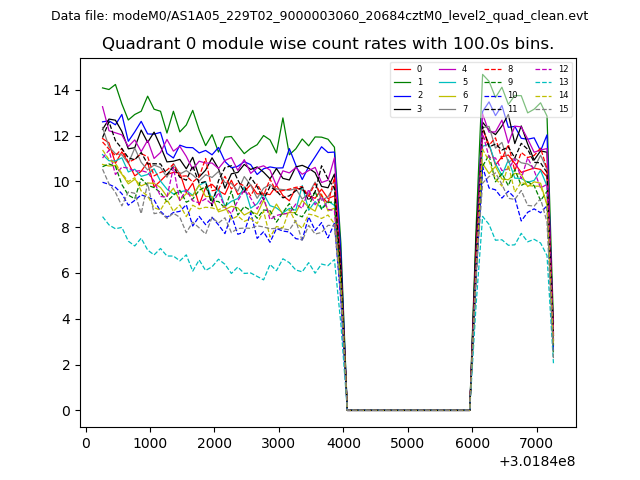 |
 |
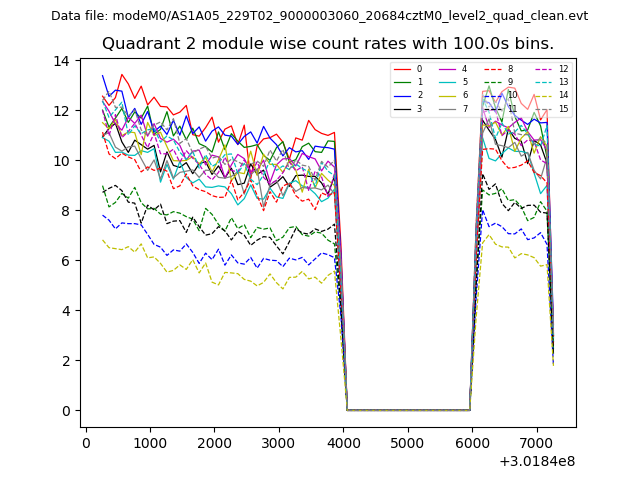
| Module-wise count rates for Quadrant B Data is divided into 100 sec bins |
 |
 |
| Module-wise count rates for Quadrant C Data is divided into 100 sec bins |
 |
 |
| Module-wise count rates for Quadrant D Data is divided into 100 sec bins |
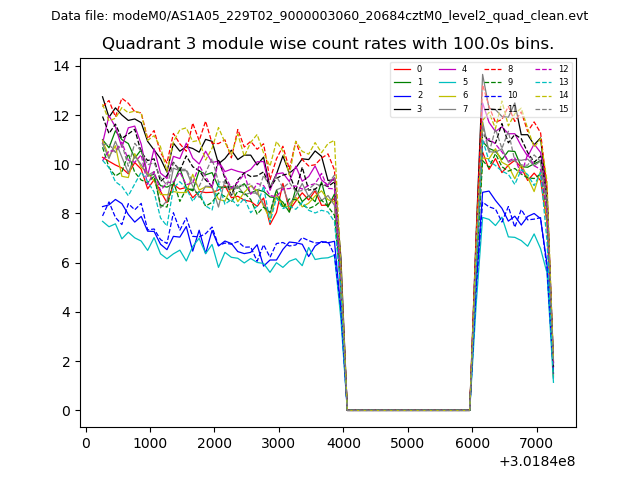 |
 |
| Parameter | Plot |
|---|---|
| CZT HV Monitor | 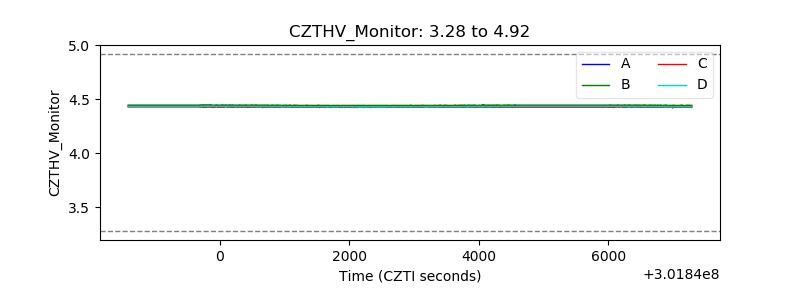 |
| D_VDD |  |
| Temperature 1 | 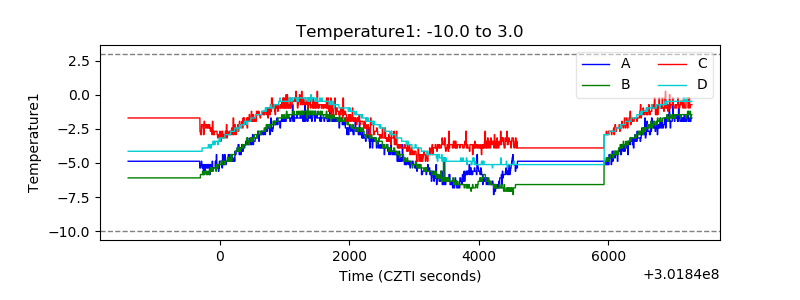 |
| Veto HV Monitor | 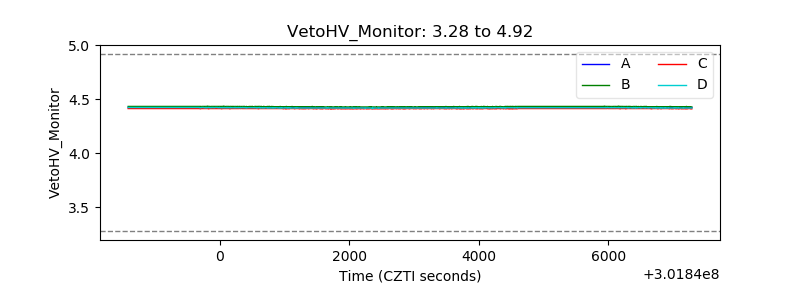 |
| Veto LLD | 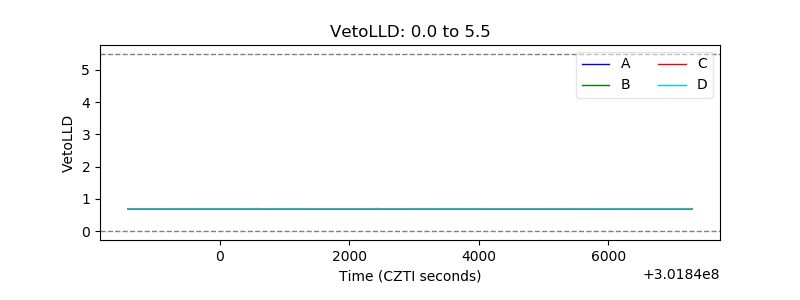 |
| Alpha Counter | 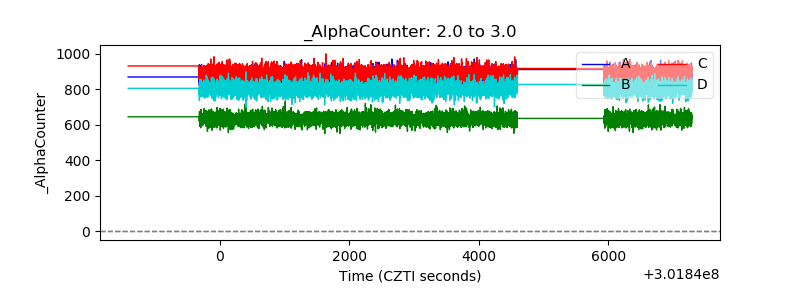 |
| _CPM_Rate | 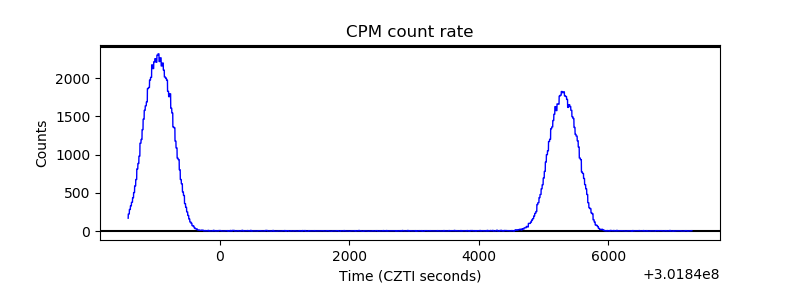 |
| CZT Counter | 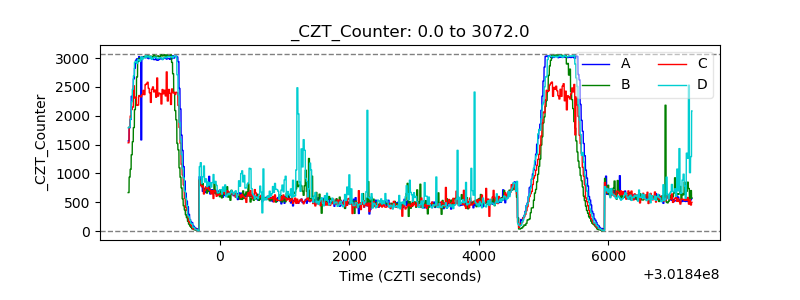 |
| +2.5 Volts monitor |  |
| +5 Volts monitor | 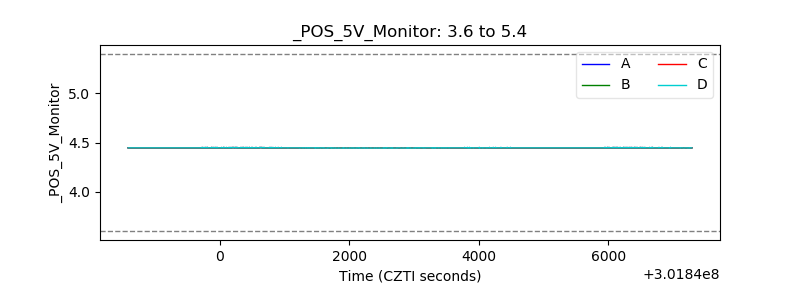 |
| _ROLL_ROT | 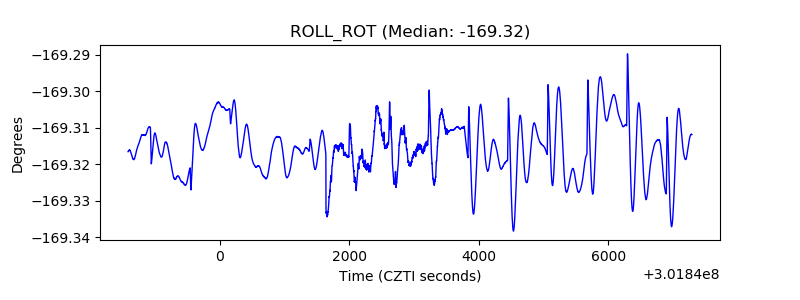 |
| _Roll_DEC |  |
| _Roll_RA | 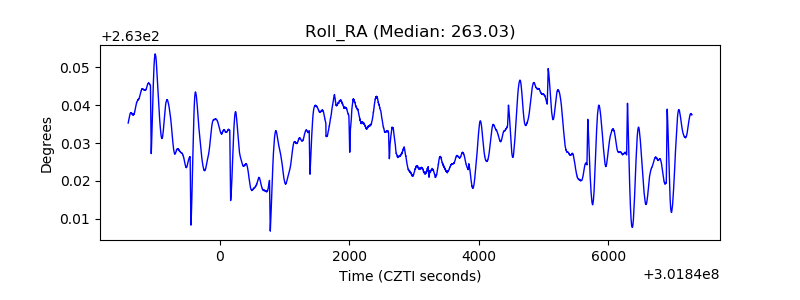 |
| Veto Counter |  |