| Param | Original file | Final file |
|---|---|---|
| Filename | modeM0/AS1A05_229T02_9000003060_20685cztM0_level2.evt | modeM0/AS1A05_229T02_9000003060_20685cztM0_level2_quad_clean.evt |
| Size (bytes) | 571,651,200 | 121,417,920 |
| Size | 545.2 MB | 115.8 MB |
| Events in quadrant A | 3,380,424 | 846,218 |
| Events in quadrant B | 4,249,795 | 826,019 |
| Events in quadrant C | 3,632,093 | 799,953 |
| Events in quadrant D | 5,607,813 | 749,820 |
| Mode M0 | |||
|---|---|---|---|
| Quadrant | BADHDUFLAG | Total packets | Discarded packets |
| A | 0 | 14130 | 1 |
| B | 0 | 16893 | 1 |
| C | 0 | 14891 | 1 |
| D | 0 | 21008 | 1 |
| Mode SS | |||
|---|---|---|---|
| Quadrant | BADHDUFLAG | Total packets | Discarded packets |
| A | 0 | 134 | 0 |
| B | 0 | 134 | 0 |
| C | 0 | 134 | 0 |
| D | 0 | 134 | 0 |
| Mode M9 | |||
|---|---|---|---|
| Quadrant | BADHDUFLAG | Total packets | Discarded packets |
| A | 0 | 12 | 0 |
| B | 0 | 12 | 0 |
| C | 0 | 12 | 0 |
| D | 0 | 12 | 0 |
| Quadrant | Total seconds | Saturated seconds | Saturation percentage |
|---|---|---|---|
| A | 6520 | 98 | 1.503067% |
| B | 6521 | 360 | 5.520626% |
| C | 6520 | 191 | 2.929448% |
| D | 6520 | 764 | 11.717791% |
Noise dominated data is calculated using 1-second bins in cleaned event files. If a bin has >2000 counts, and if more than 50% of those come from <1% of pixels, then it is considered to be noise-dominated and hence unusable.
| Quadrant | # 1 sec bins | Bins with >0 counts | Bins with >2000 counts | High rate bins dominated by noise | Noise dominated (total time) | Noise dominated (detector-on time) | Marked lightcurve |
|---|---|---|---|---|---|---|---|
| A | 7770 | 6521 | 0 | 0 | 0.00% | 0.00% | 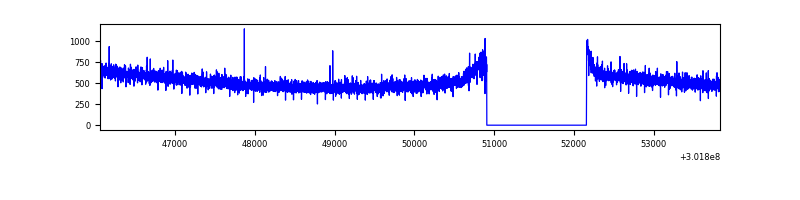 |
| B | 7771 | 6522 | 191 | 191 | 2.46% | 2.93% | 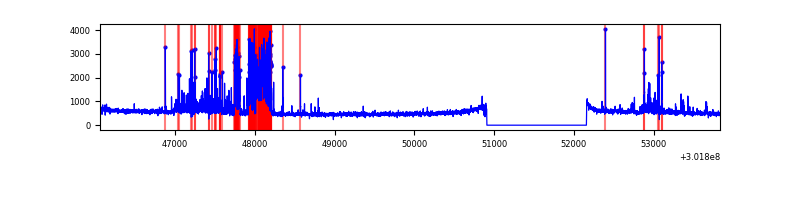 |
| C | 7770 | 6521 | 57 | 57 | 0.73% | 0.87% | 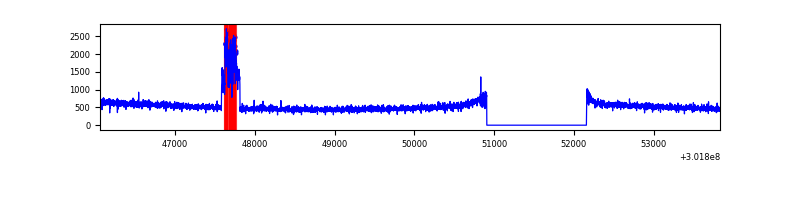 |
| D | 7770 | 6521 | 633 | 633 | 8.15% | 9.71% | 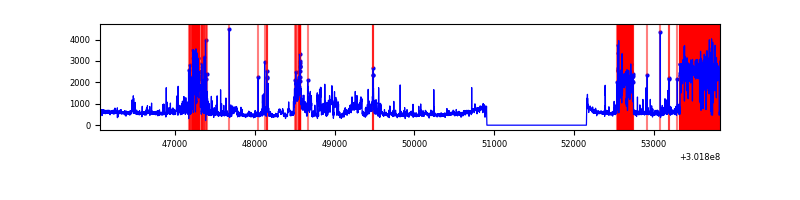 |
Top three noisy pixels from each quadrant. If the there are fewer than three noisy pixels in the level2.evt file, extra rows are filled as -1
| Pixel properties | Quadrant properties | ||||||
|---|---|---|---|---|---|---|---|
| Quadrant | DetID | PixID | Counts | Sigma | Mean | Median | Sigma |
| A | 0 | 226 | 7665 | 39.06 | 878 | 865 | 174.1 |
| A | 3 | 137 | 6518 | 32.47 | 878 | 865 | 174.1 |
| A | 12 | 194 | 6333 | 31.41 | 878 | 865 | 174.1 |
| B | 7 | 220 | 824291 | 5164.39 | 852 | 834 | 159.4 |
| B | 0 | 190 | 28789 | 175.32 | 852 | 834 | 159.4 |
| B | 3 | 64 | 22525 | 136.04 | 852 | 834 | 159.4 |
| C | 9 | 54 | 282523 | 1491.17 | 819 | 826 | 188.9 |
| C | 14 | 238 | 131388 | 691.13 | 819 | 826 | 188.9 |
| C | 3 | 233 | 19314 | 97.87 | 819 | 826 | 188.9 |
| D | 1 | 52 | 1718923 | 8786.54 | 818 | 797 | 195.5 |
| D | 13 | 138 | 327482 | 1670.68 | 818 | 797 | 195.5 |
| D | 12 | 227 | 265090 | 1351.6 | 818 | 797 | 195.5 |
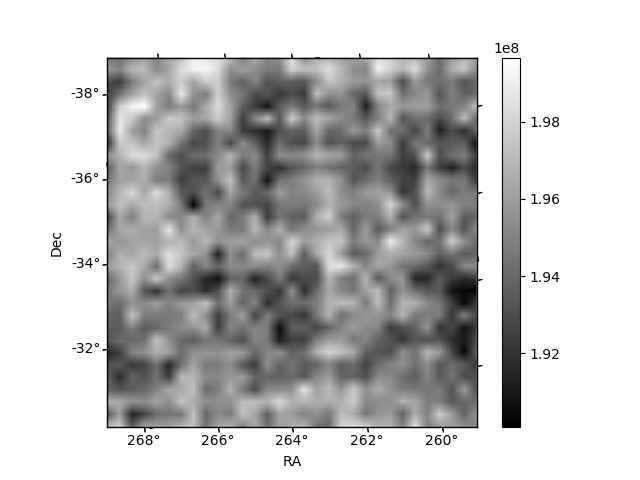
Histogram calculated using DETX and DETY for each event in the final _common_clean file
| Quadrant A |  |
 |
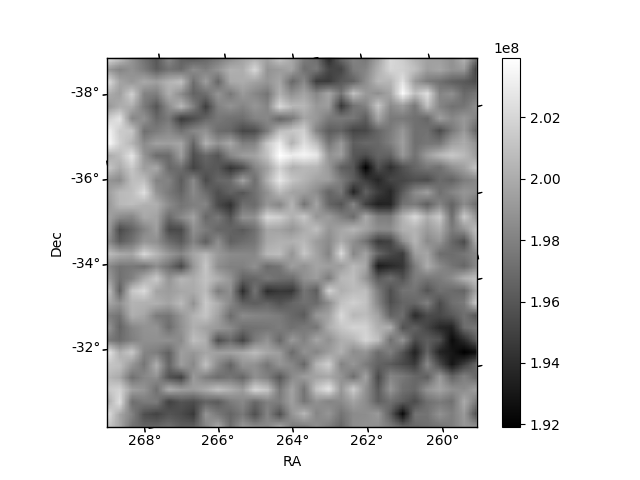
Quadrant B |
|---|---|---|---|
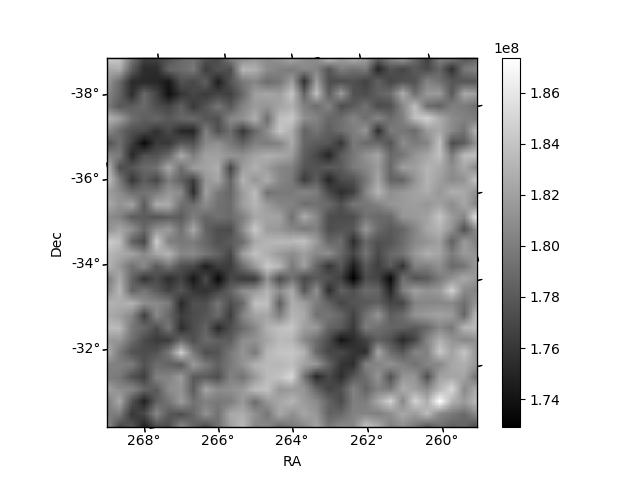
| Quadrant D |  |
 |
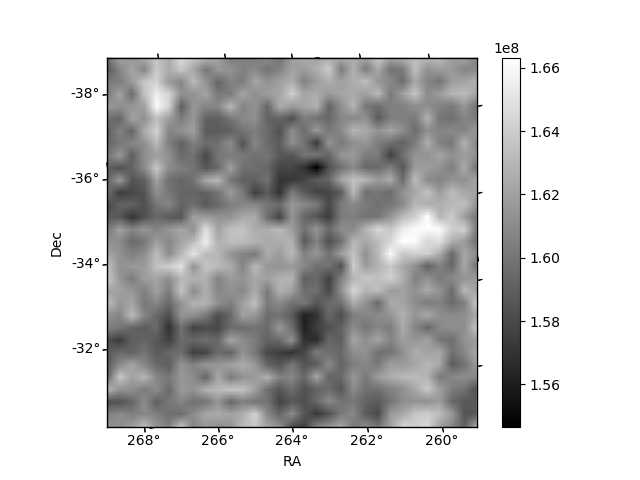
Quadrant C |
| Plot type | Count rate plots | Images |
|---|---|---|
| Comparison with Poisson distribution Blue bars denote a histogram of data divided into 1 sec bins. Red curve is a Poisson curve with rate = median count rate of data. |
 |
 |
| Quadrant-wise count rates Data is divided into 100 sec bins |
 |
|
| Module-wise count rates for Quadrant A Data is divided into 100 sec bins |
 |
 |
| Module-wise count rates for Quadrant B Data is divided into 100 sec bins |
 |
 |
| Module-wise count rates for Quadrant C Data is divided into 100 sec bins |
 |
 |
| Module-wise count rates for Quadrant D Data is divided into 100 sec bins |
 |
 |
| Parameter | Plot |
|---|---|
| CZT HV Monitor |  |
| D_VDD | 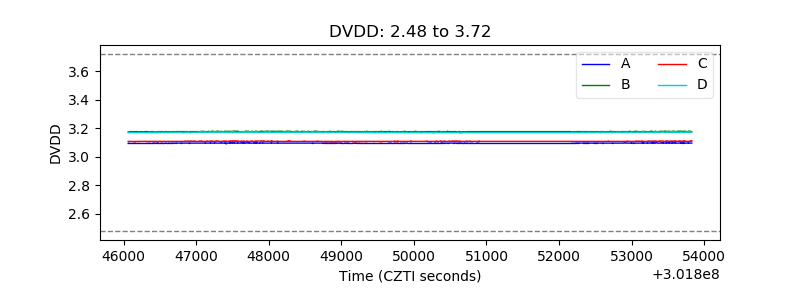 |
| Temperature 1 | 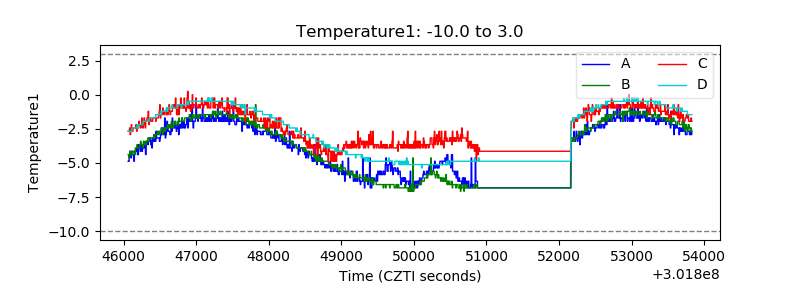 |
| Veto HV Monitor |  |
| Veto LLD |  |
| Alpha Counter |  |
| _CPM_Rate |  |
| CZT Counter |  |
| +2.5 Volts monitor |  |
| +5 Volts monitor |  |
| _ROLL_ROT |  |
| _Roll_DEC |  |
| _Roll_RA |  |
| Veto Counter |  |