| Param | Original file | Final file |
|---|---|---|
| Filename | modeM0/AS1A05_229T02_9000003060_20687cztM0_level2.evt | modeM0/AS1A05_229T02_9000003060_20687cztM0_level2_quad_clean.evt |
| Size (bytes) | 490,947,840 | 99,702,720 |
| Size | 468.2 MB | 95.1 MB |
| Events in quadrant A | 3,271,433 | 653,724 |
| Events in quadrant B | 3,589,677 | 651,533 |
| Events in quadrant C | 3,292,105 | 627,990 |
| Events in quadrant D | 4,247,793 | 606,654 |
| Mode M0 | |||
|---|---|---|---|
| Quadrant | BADHDUFLAG | Total packets | Discarded packets |
| A | 0 | 14181 | 1 |
| B | 0 | 15131 | 1 |
| C | 0 | 14213 | 1 |
| D | 0 | 17211 | 1 |
| Mode SS | |||
|---|---|---|---|
| Quadrant | BADHDUFLAG | Total packets | Discarded packets |
| A | 0 | 140 | 0 |
| B | 0 | 140 | 0 |
| C | 0 | 140 | 0 |
| D | 0 | 140 | 0 |
| Mode M9 | |||
|---|---|---|---|
| Quadrant | BADHDUFLAG | Total packets | Discarded packets |
| A | 0 | 7 | 0 |
| B | 0 | 7 | 0 |
| C | 0 | 7 | 0 |
| D | 0 | 7 | 0 |
| Quadrant | Total seconds | Saturated seconds | Saturation percentage |
|---|---|---|---|
| A | 6880 | 49 | 0.712209% |
| B | 6881 | 72 | 1.046360% |
| C | 6881 | 60 | 0.871966% |
| D | 6880 | 233 | 3.386628% |
Noise dominated data is calculated using 1-second bins in cleaned event files. If a bin has >2000 counts, and if more than 50% of those come from <1% of pixels, then it is considered to be noise-dominated and hence unusable.
| Quadrant | # 1 sec bins | Bins with >0 counts | Bins with >2000 counts | High rate bins dominated by noise | Noise dominated (total time) | Noise dominated (detector-on time) | Marked lightcurve |
|---|---|---|---|---|---|---|---|
| A | 7595 | 6881 | 0 | 0 | 0.00% | 0.00% | 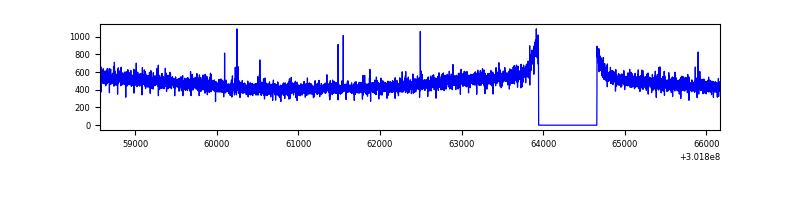 |
| B | 7596 | 6882 | 9 | 9 | 0.12% | 0.13% | 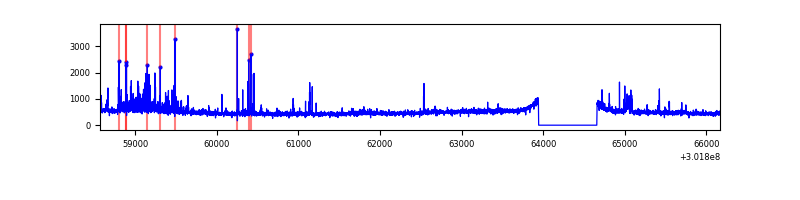 |
| C | 7596 | 6882 | 0 | 0 | 0.00% | 0.00% | 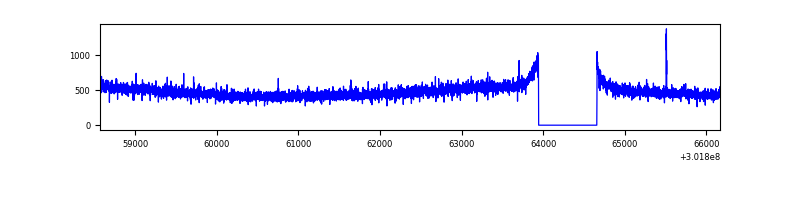 |
| D | 7595 | 6881 | 179 | 179 | 2.36% | 2.60% | 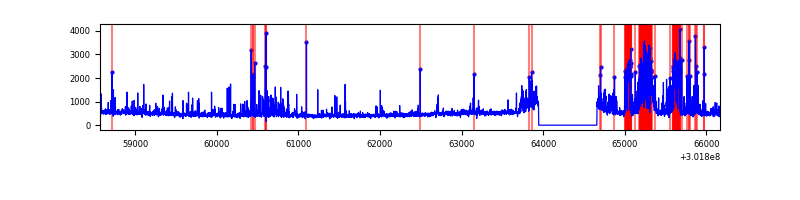 |
Top three noisy pixels from each quadrant. If the there are fewer than three noisy pixels in the level2.evt file, extra rows are filled as -1
| Pixel properties | Quadrant properties | ||||||
|---|---|---|---|---|---|---|---|
| Quadrant | DetID | PixID | Counts | Sigma | Mean | Median | Sigma |
| A | 5 | 16 | 9672 | 51.59 | 848 | 831 | 171.4 |
| A | 0 | 226 | 7360 | 38.1 | 848 | 831 | 171.4 |
| A | 3 | 137 | 6595 | 33.63 | 848 | 831 | 171.4 |
| B | 7 | 220 | 167230 | 1030.88 | 843 | 821 | 161.4 |
| B | 0 | 190 | 34305 | 207.43 | 843 | 821 | 161.4 |
| B | 0 | 197 | 31241 | 188.45 | 843 | 821 | 161.4 |
| C | 14 | 238 | 127156 | 672.68 | 803 | 809 | 187.8 |
| C | 3 | 233 | 22318 | 114.51 | 803 | 809 | 187.8 |
| C | 7 | 247 | 10722 | 52.78 | 803 | 809 | 187.8 |
| D | 1 | 52 | 739084 | 3718.07 | 811 | 788 | 198.6 |
| D | 7 | 38 | 230877 | 1158.73 | 811 | 788 | 198.6 |
| D | 12 | 227 | 94714 | 473.01 | 811 | 788 | 198.6 |
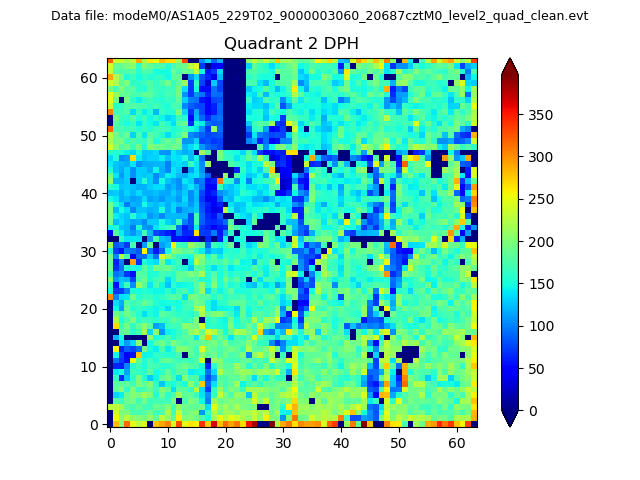
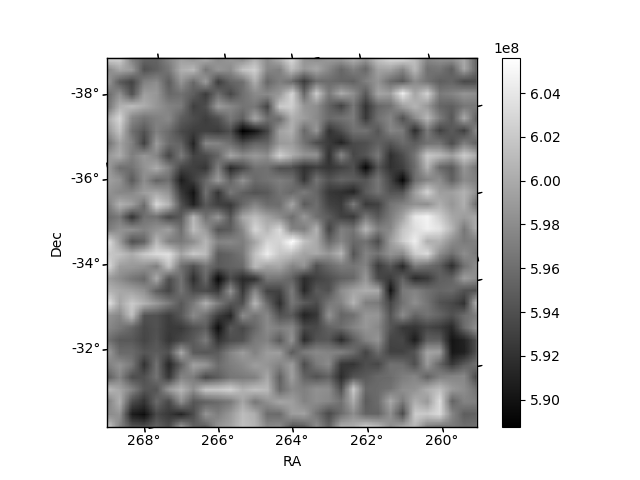
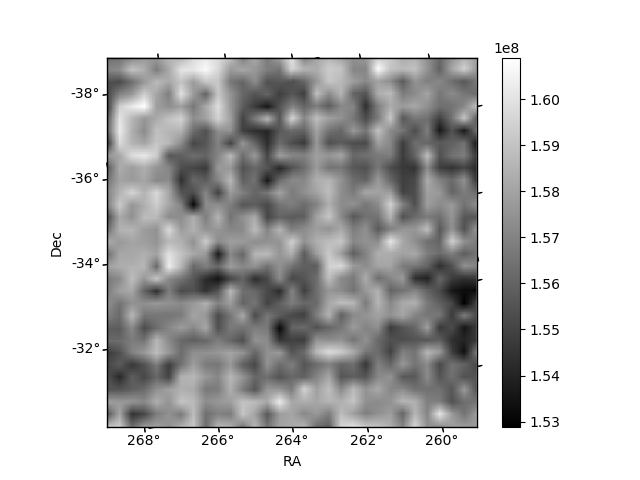
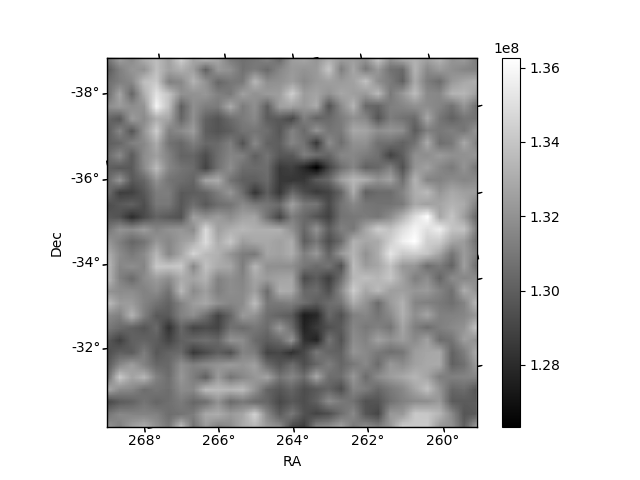
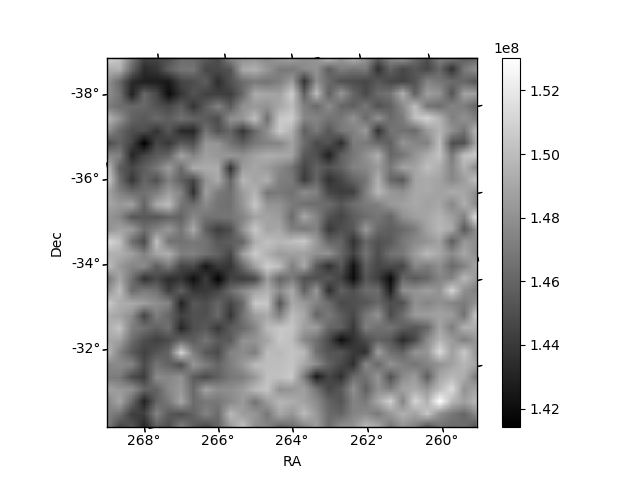
Histogram calculated using DETX and DETY for each event in the final _common_clean file
| Quadrant A | 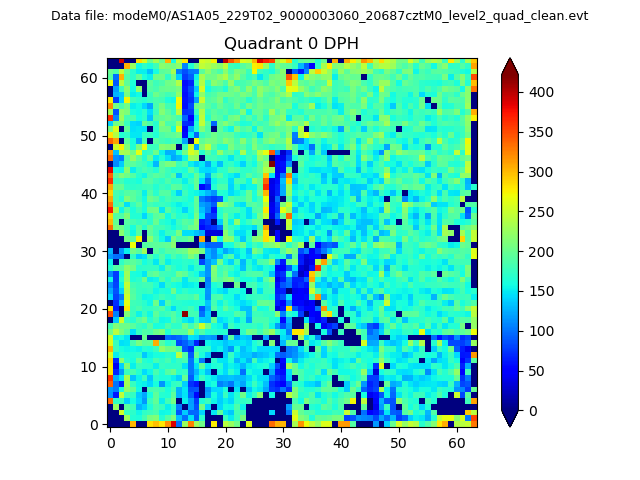 |
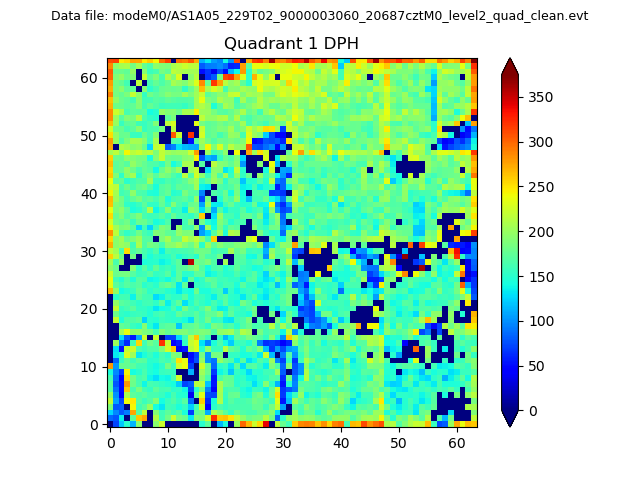 |
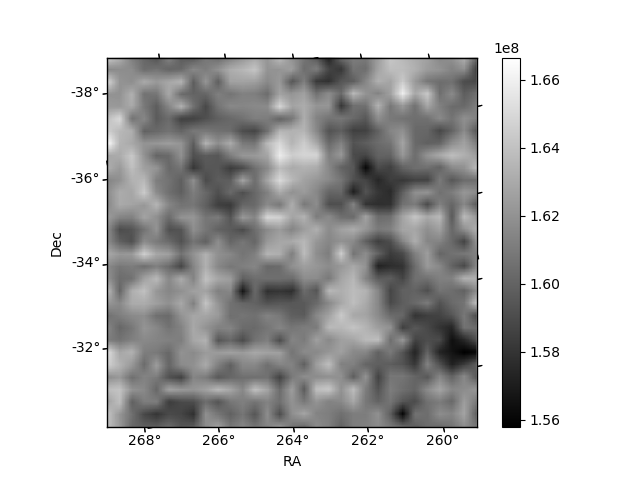
Quadrant B |
|---|---|---|---|
| Quadrant D | 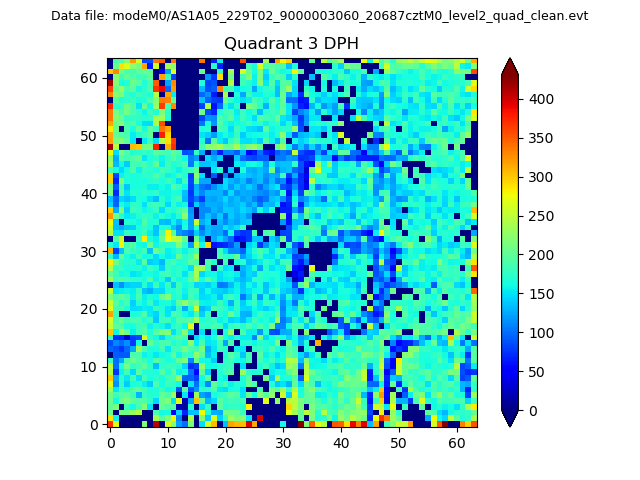 |
 |
Quadrant C |
| Plot type | Count rate plots | Images |
|---|---|---|
| Comparison with Poisson distribution Blue bars denote a histogram of data divided into 1 sec bins. Red curve is a Poisson curve with rate = median count rate of data. |
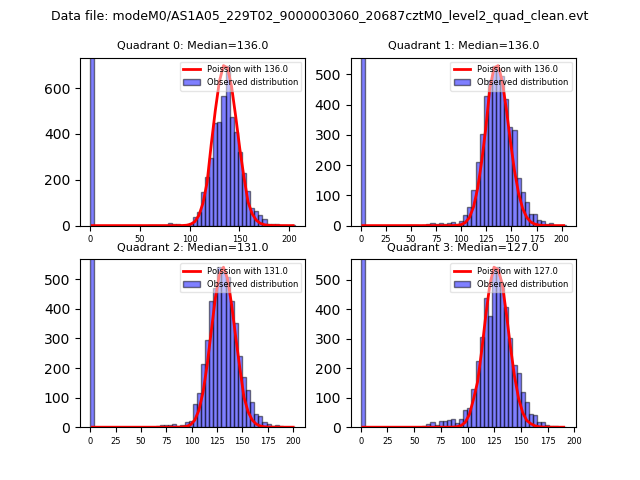 |
 |
| Quadrant-wise count rates Data is divided into 100 sec bins |
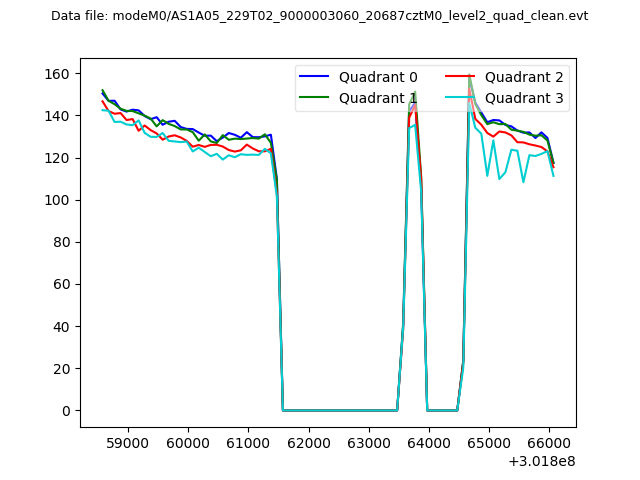 |
|
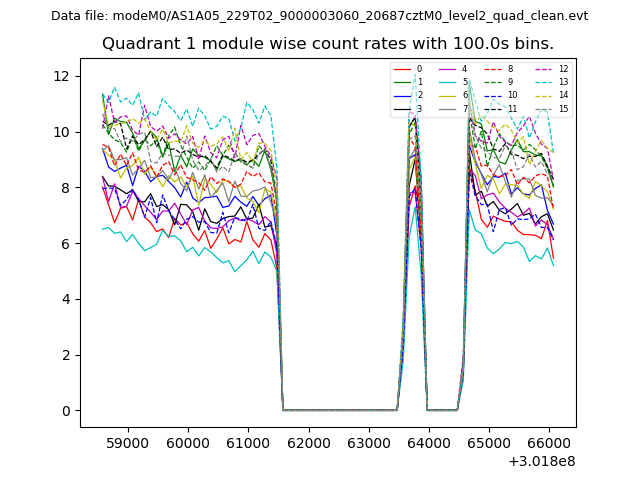
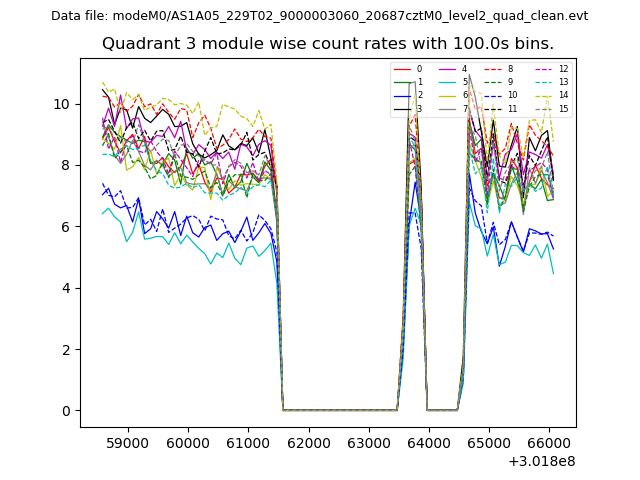
| Module-wise count rates for Quadrant A Data is divided into 100 sec bins |
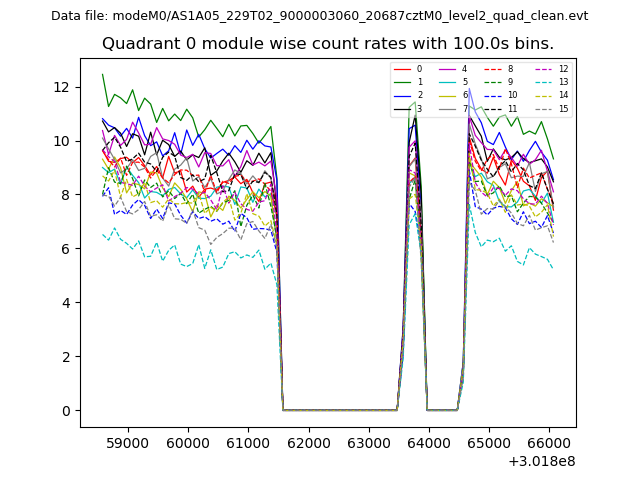 |
 |
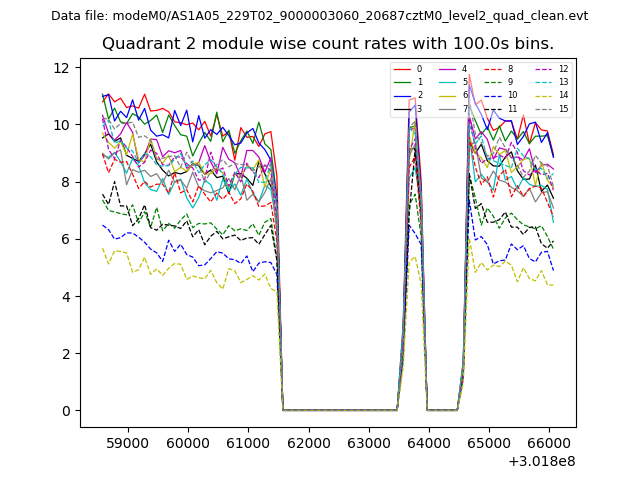
| Module-wise count rates for Quadrant B Data is divided into 100 sec bins |
 |
 |
| Module-wise count rates for Quadrant C Data is divided into 100 sec bins |
 |
 |
| Module-wise count rates for Quadrant D Data is divided into 100 sec bins |
 |
 |
| Parameter | Plot |
|---|---|
| CZT HV Monitor | 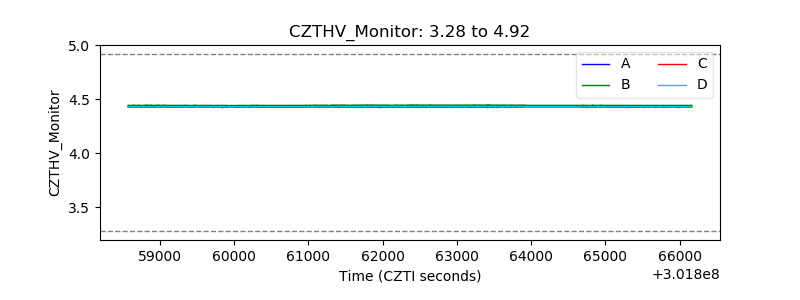 |
| D_VDD | 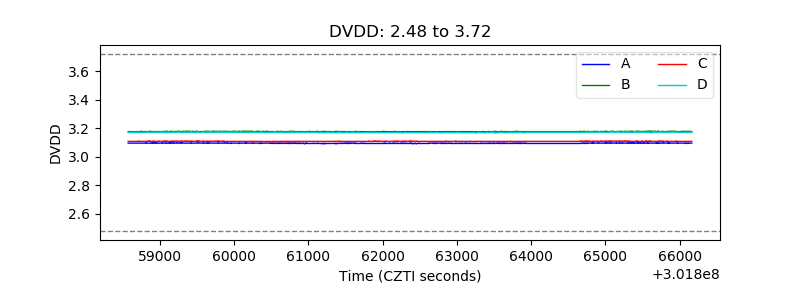 |
| Temperature 1 | 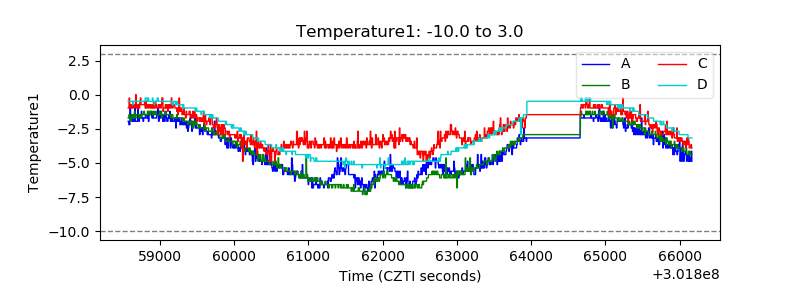 |
| Veto HV Monitor | 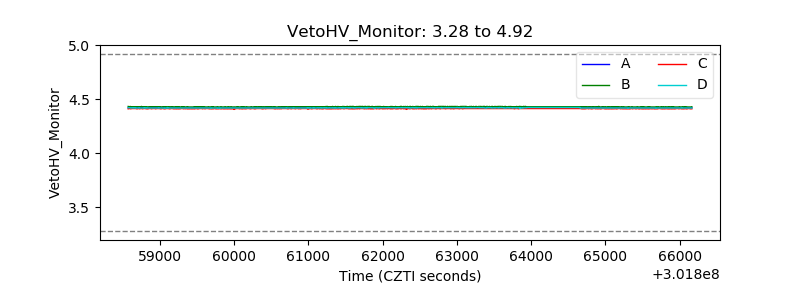 |
| Veto LLD | 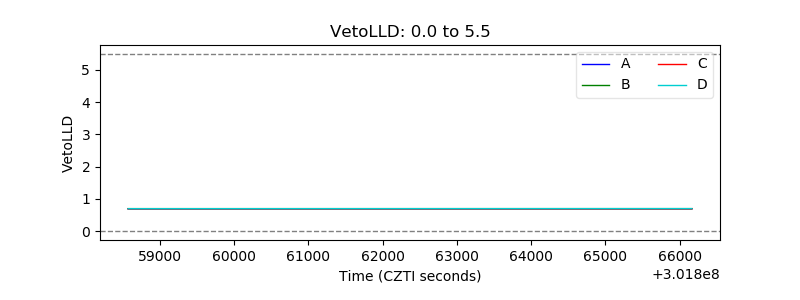 |
| Alpha Counter | 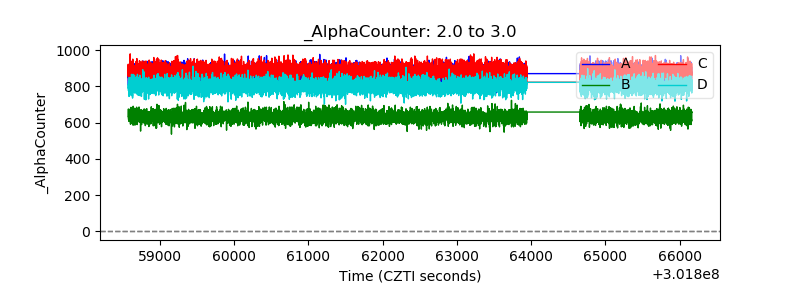 |
| _CPM_Rate | 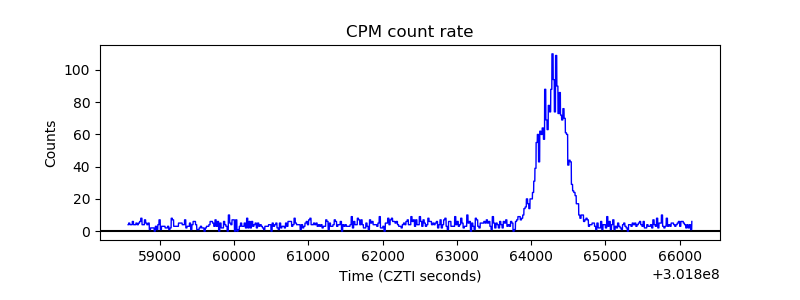 |
| CZT Counter | 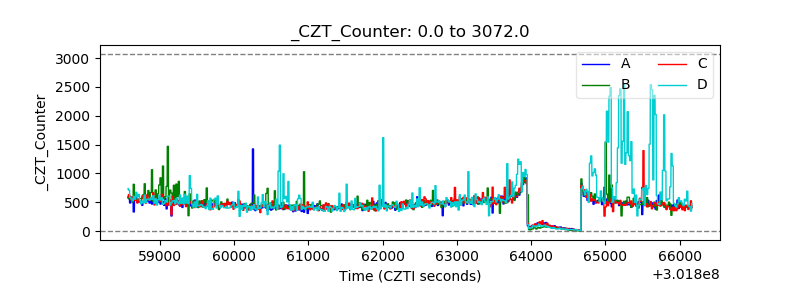 |
| +2.5 Volts monitor |  |
| +5 Volts monitor |  |
| _ROLL_ROT | 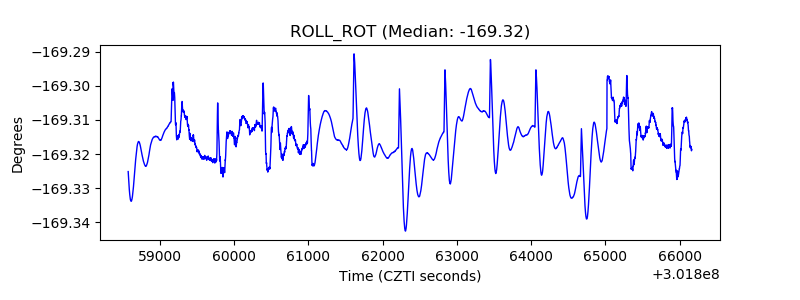 |
| _Roll_DEC | 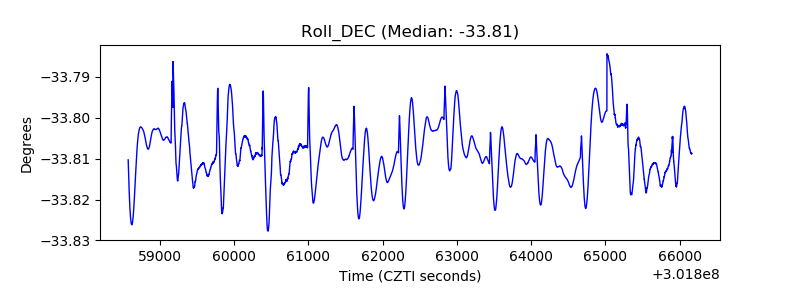 |
| _Roll_RA | 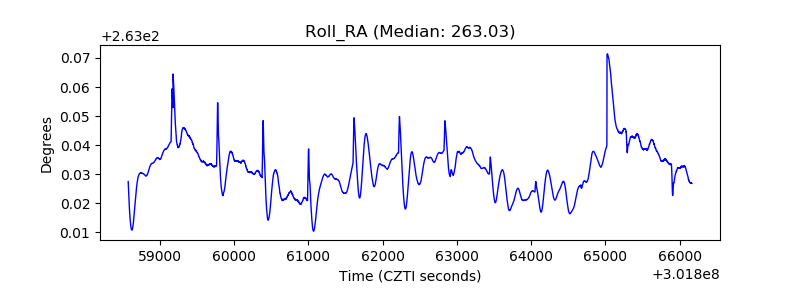 |
| Veto Counter | 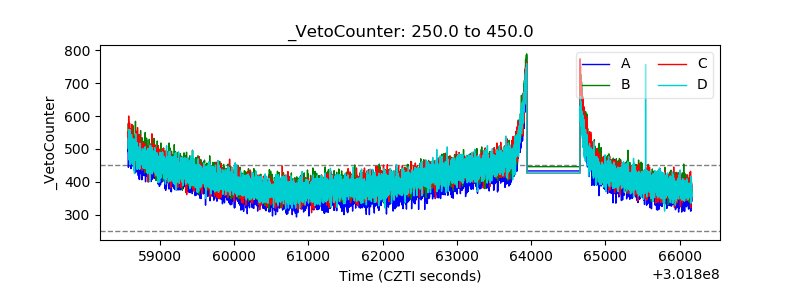 |