| Param | Original file | Final file |
|---|---|---|
| Filename | modeM0/AS1A05_229T02_9000003060_20689cztM0_level2.evt | modeM0/AS1A05_229T02_9000003060_20689cztM0_level2_quad_clean.evt |
| Size (bytes) | 574,917,120 | 114,888,960 |
| Size | 548.3 MB | 109.6 MB |
| Events in quadrant A | 3,652,642 | 754,494 |
| Events in quadrant B | 3,952,287 | 756,174 |
| Events in quadrant C | 3,675,900 | 730,384 |
| Events in quadrant D | 5,603,067 | 697,490 |
| Mode M0 | |||
|---|---|---|---|
| Quadrant | BADHDUFLAG | Total packets | Discarded packets |
| A | 0 | 16116 | 2 |
| B | 0 | 16897 | 2 |
| C | 0 | 16084 | 2 |
| D | 0 | 21824 | 2 |
| Mode SS | |||
|---|---|---|---|
| Quadrant | BADHDUFLAG | Total packets | Discarded packets |
| A | 0 | 160 | 0 |
| B | 0 | 160 | 0 |
| C | 0 | 160 | 0 |
| D | 0 | 160 | 0 |
| Mode M9 | |||
|---|---|---|---|
| Quadrant | BADHDUFLAG | Total packets | Discarded packets |
| A | 0 | 7 | 0 |
| B | 0 | 7 | 0 |
| C | 0 | 7 | 0 |
| D | 0 | 7 | 0 |
| Quadrant | Total seconds | Saturated seconds | Saturation percentage |
|---|---|---|---|
| A | 7778 | 44 | 0.565698% |
| B | 7778 | 117 | 1.504243% |
| C | 7778 | 91 | 1.169967% |
| D | 7778 | 296 | 3.805606% |
Noise dominated data is calculated using 1-second bins in cleaned event files. If a bin has >2000 counts, and if more than 50% of those come from <1% of pixels, then it is considered to be noise-dominated and hence unusable.
| Quadrant | # 1 sec bins | Bins with >0 counts | Bins with >2000 counts | High rate bins dominated by noise | Noise dominated (total time) | Noise dominated (detector-on time) | Marked lightcurve |
|---|---|---|---|---|---|---|---|
| A | 8483 | 7780 | 0 | 0 | 0.00% | 0.00% | 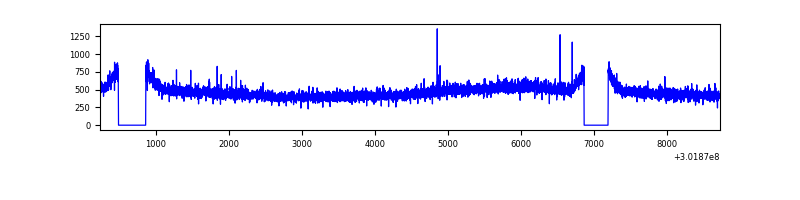 |
| B | 8483 | 7780 | 16 | 16 | 0.19% | 0.21% | 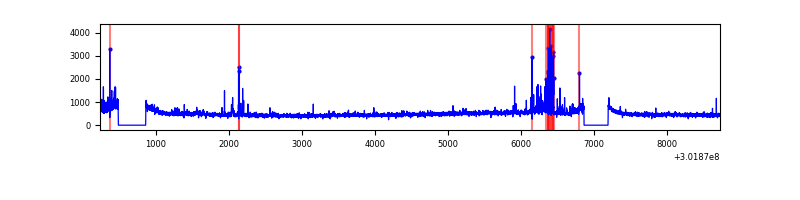 |
| C | 8483 | 7780 | 0 | 0 | 0.00% | 0.00% | 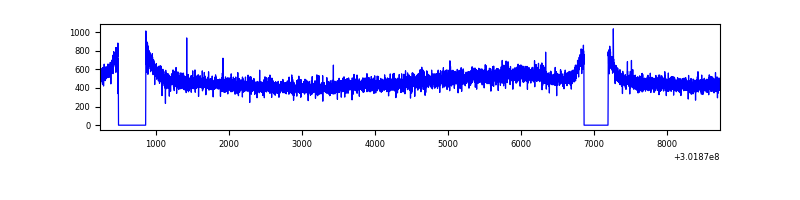 |
| D | 8483 | 7780 | 266 | 266 | 3.14% | 3.42% | 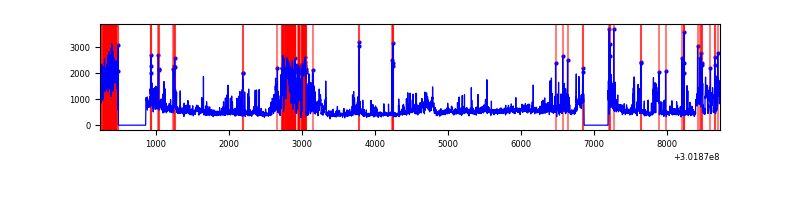 |
Top three noisy pixels from each quadrant. If the there are fewer than three noisy pixels in the level2.evt file, extra rows are filled as -1
| Pixel properties | Quadrant properties | ||||||
|---|---|---|---|---|---|---|---|
| Quadrant | DetID | PixID | Counts | Sigma | Mean | Median | Sigma |
| A | 0 | 226 | 8400 | 39.11 | 947 | 927 | 191.1 |
| A | 3 | 137 | 7830 | 36.13 | 947 | 927 | 191.1 |
| A | 12 | 194 | 6778 | 30.62 | 947 | 927 | 191.1 |
| B | 7 | 220 | 184675 | 1026.45 | 940 | 919 | 179.0 |
| B | 0 | 190 | 25110 | 135.13 | 940 | 919 | 179.0 |
| B | 12 | 111 | 21446 | 114.66 | 940 | 919 | 179.0 |
| C | 14 | 238 | 140360 | 655.14 | 900 | 903 | 212.9 |
| C | 7 | 247 | 12694 | 55.39 | 900 | 903 | 212.9 |
| C | 3 | 233 | 10408 | 44.65 | 900 | 903 | 212.9 |
| D | 1 | 52 | 1105782 | 5051.0 | 902 | 875 | 218.7 |
| D | 5 | 222 | 643133 | 2936.04 | 902 | 875 | 218.7 |
| D | 12 | 227 | 280877 | 1280.01 | 902 | 875 | 218.7 |
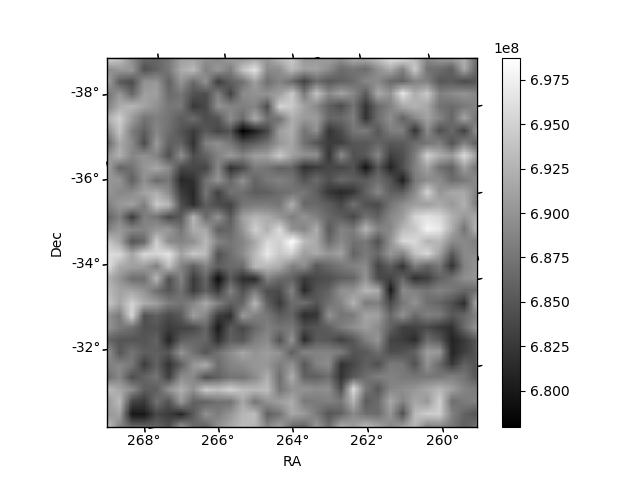
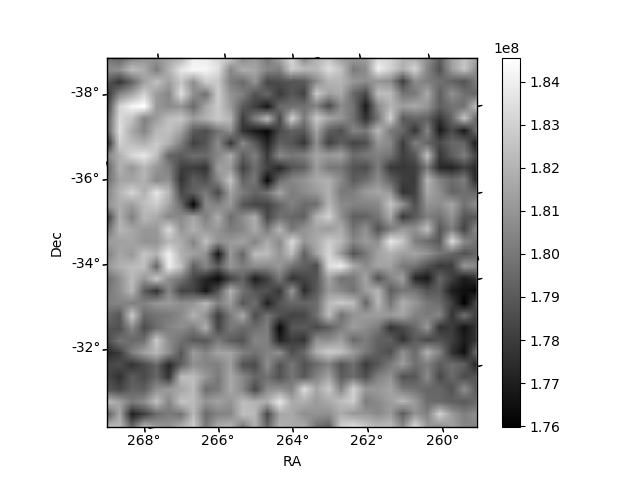
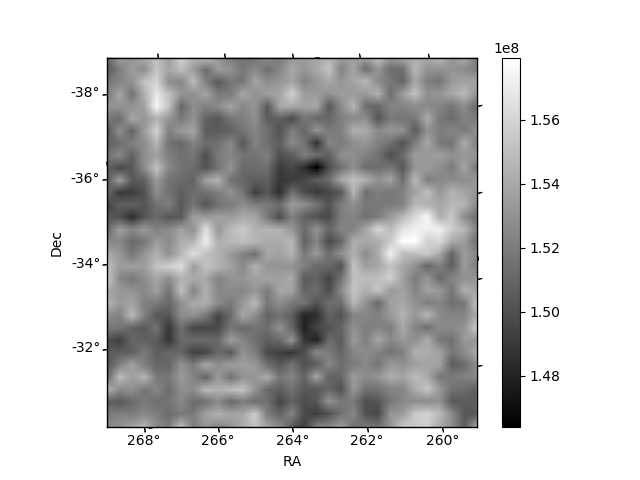
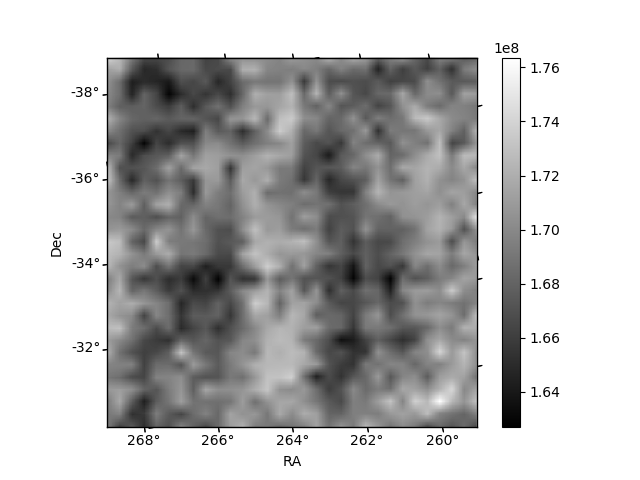
Histogram calculated using DETX and DETY for each event in the final _common_clean file
| Quadrant A | 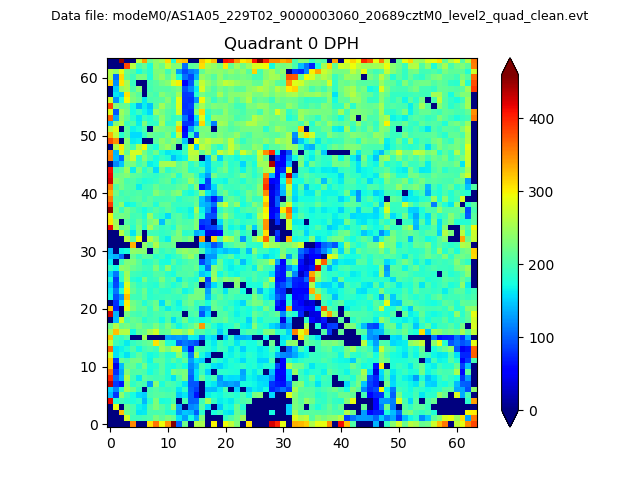 |
 |
Quadrant B |
|---|---|---|---|
| Quadrant D | 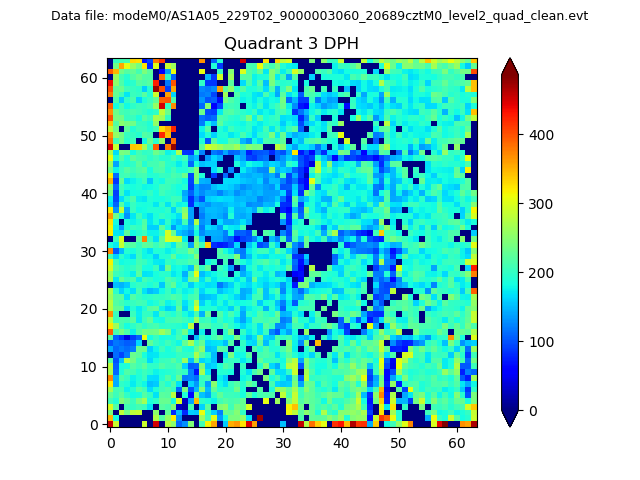 |
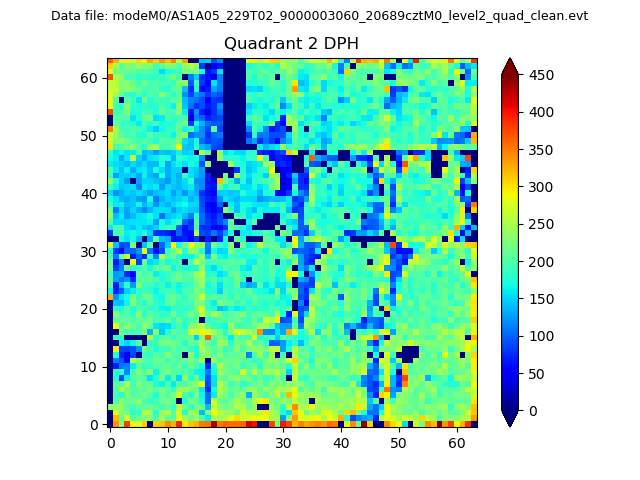 |
Quadrant C |
| Plot type | Count rate plots | Images |
|---|---|---|
| Comparison with Poisson distribution Blue bars denote a histogram of data divided into 1 sec bins. Red curve is a Poisson curve with rate = median count rate of data. |
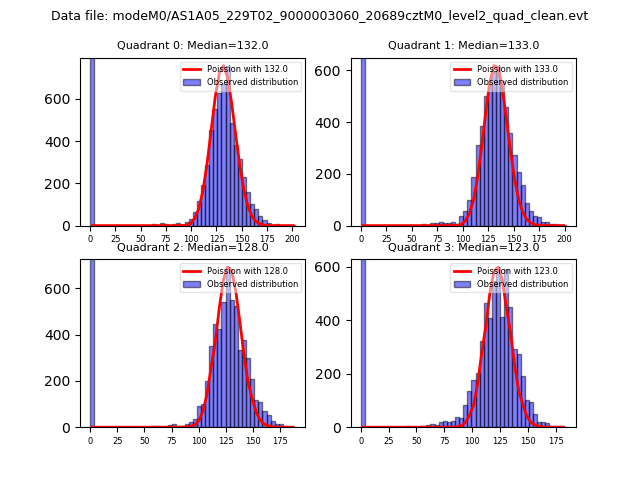 |
 |
| Quadrant-wise count rates Data is divided into 100 sec bins |
 |
|
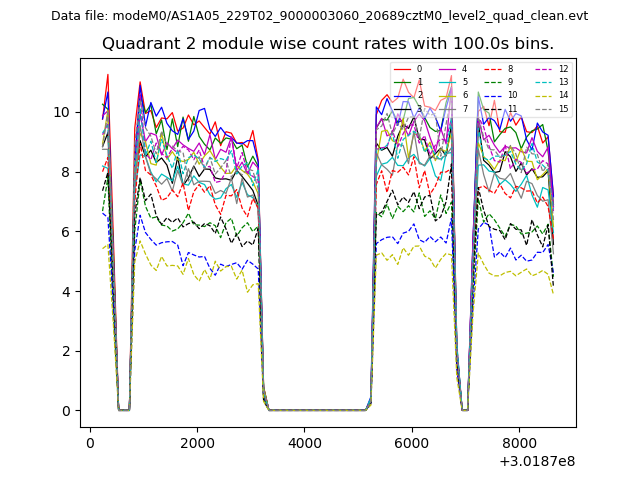
| Module-wise count rates for Quadrant A Data is divided into 100 sec bins |
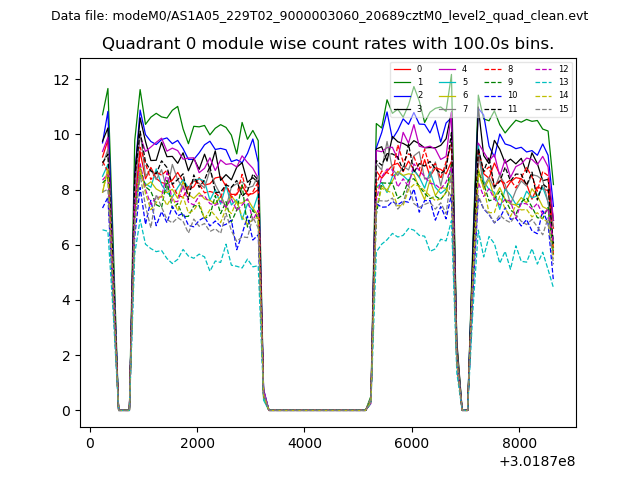 |
 |
| Module-wise count rates for Quadrant B Data is divided into 100 sec bins |
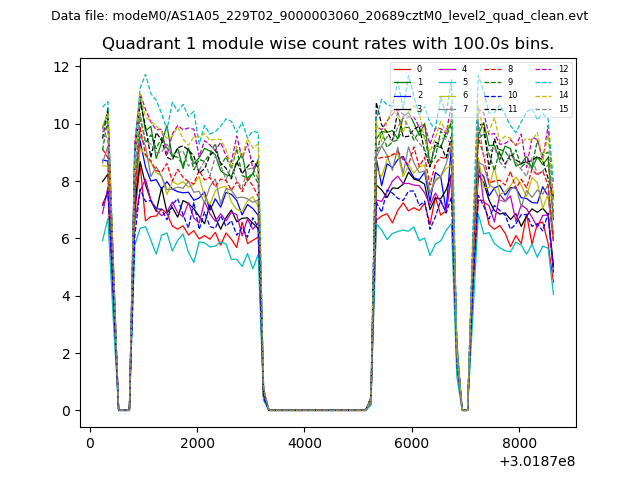 |
 |
| Module-wise count rates for Quadrant C Data is divided into 100 sec bins |
 |
 |
| Module-wise count rates for Quadrant D Data is divided into 100 sec bins |
 |
 |
| Parameter | Plot |
|---|---|
| CZT HV Monitor | 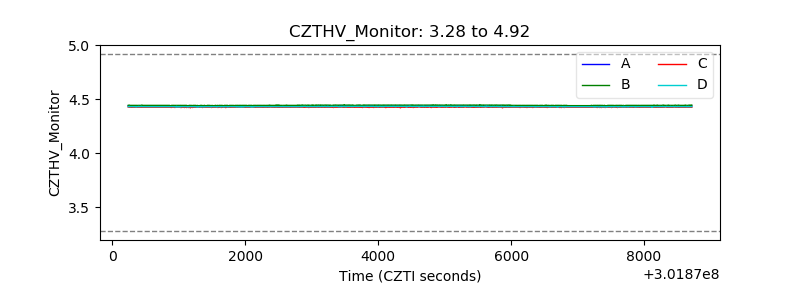 |
| D_VDD | 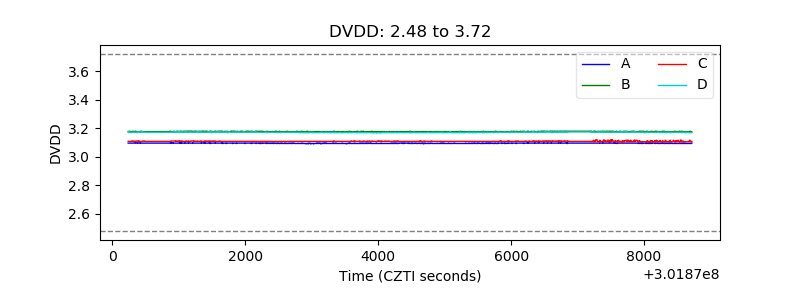 |
| Temperature 1 | 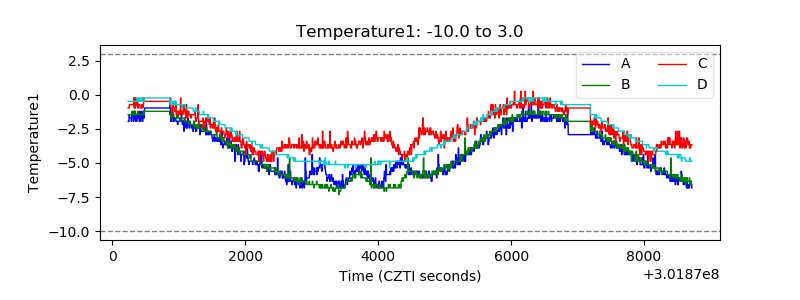 |
| Veto HV Monitor | 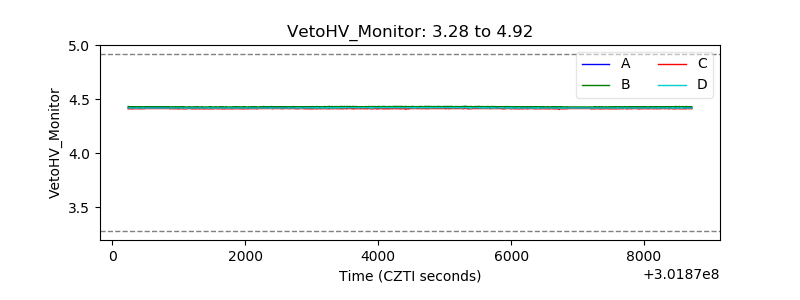 |
| Veto LLD | 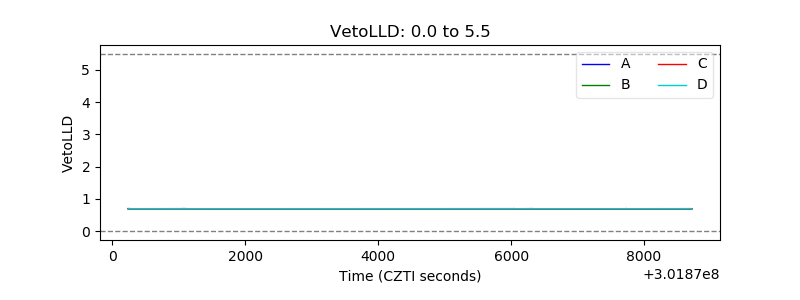 |
| Alpha Counter | 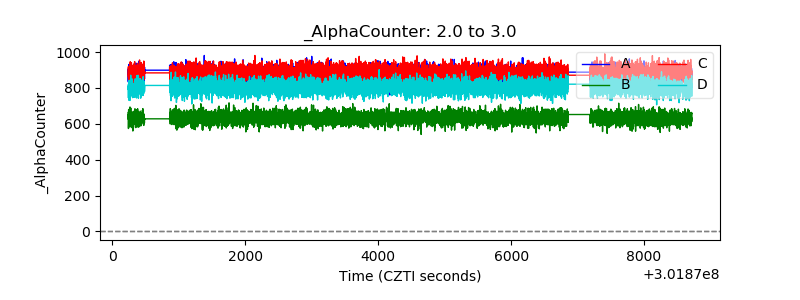 |
| _CPM_Rate | 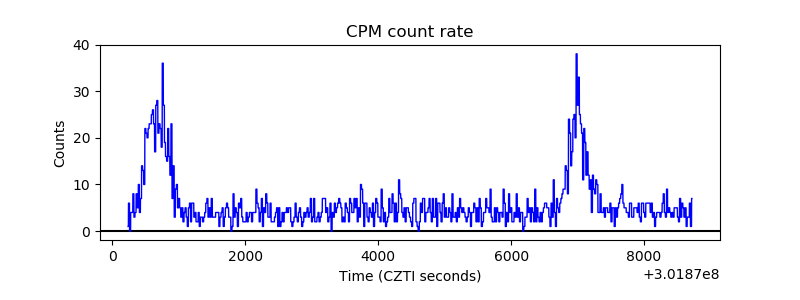 |
| CZT Counter | 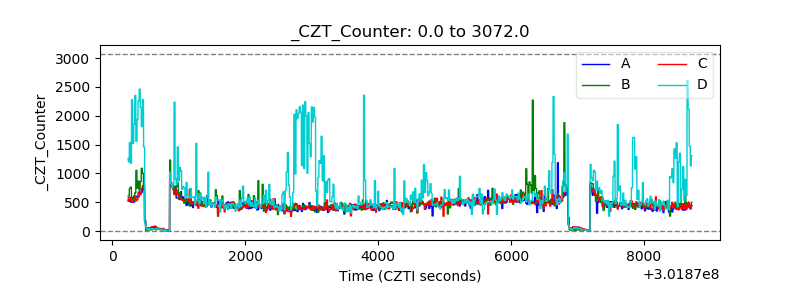 |
| +2.5 Volts monitor |  |
| +5 Volts monitor |  |
| _ROLL_ROT |  |
| _Roll_DEC | 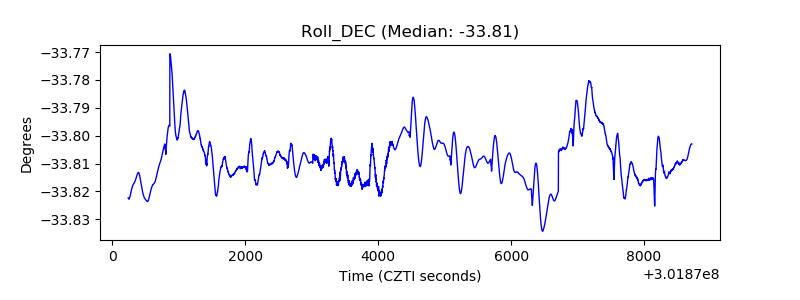 |
| _Roll_RA | 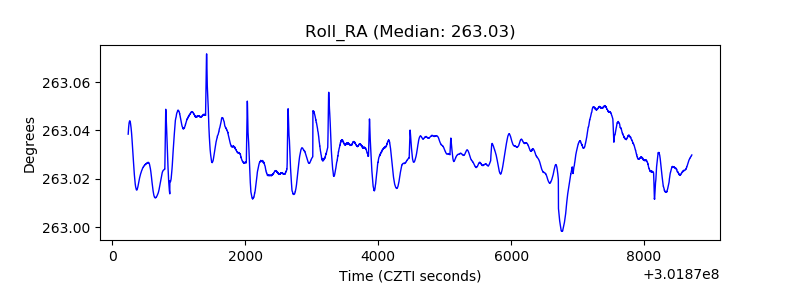 |
| Veto Counter |  |