| Param | Original file | Final file |
|---|---|---|
| Filename | modeM0/AS1A05_229T02_9000003060_20690cztM0_level2.evt | modeM0/AS1A05_229T02_9000003060_20690cztM0_level2_quad_clean.evt |
| Size (bytes) | 587,664,000 | 113,463,360 |
| Size | 560.4 MB | 108.2 MB |
| Events in quadrant A | 3,646,960 | 741,717 |
| Events in quadrant B | 3,932,405 | 742,476 |
| Events in quadrant C | 3,705,115 | 716,818 |
| Events in quadrant D | 5,976,444 | 685,161 |
| Mode M0 | |||
|---|---|---|---|
| Quadrant | BADHDUFLAG | Total packets | Discarded packets |
| A | 0 | 16199 | 2 |
| B | 0 | 16946 | 2 |
| C | 0 | 16232 | 2 |
| D | 0 | 23054 | 2 |
| Mode SS | |||
|---|---|---|---|
| Quadrant | BADHDUFLAG | Total packets | Discarded packets |
| A | 0 | 160 | 0 |
| B | 0 | 160 | 0 |
| C | 0 | 160 | 0 |
| D | 0 | 160 | 0 |
| Mode M9 | |||
|---|---|---|---|
| Quadrant | BADHDUFLAG | Total packets | Discarded packets |
| A | 0 | 9 | 0 |
| B | 0 | 9 | 0 |
| C | 0 | 9 | 0 |
| D | 0 | 9 | 0 |
| Quadrant | Total seconds | Saturated seconds | Saturation percentage |
|---|---|---|---|
| A | 7922 | 21 | 0.265085% |
| B | 7922 | 90 | 1.136077% |
| C | 7922 | 75 | 0.946731% |
| D | 7922 | 308 | 3.887907% |
Noise dominated data is calculated using 1-second bins in cleaned event files. If a bin has >2000 counts, and if more than 50% of those come from <1% of pixels, then it is considered to be noise-dominated and hence unusable.
| Quadrant | # 1 sec bins | Bins with >0 counts | Bins with >2000 counts | High rate bins dominated by noise | Noise dominated (total time) | Noise dominated (detector-on time) | Marked lightcurve |
|---|---|---|---|---|---|---|---|
| A | 8727 | 7924 | 0 | 0 | 0.00% | 0.00% | 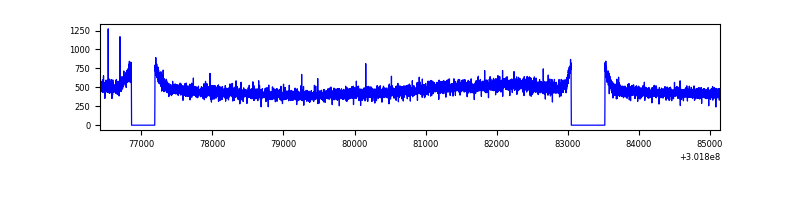 |
| B | 8727 | 7924 | 18 | 18 | 0.21% | 0.23% | 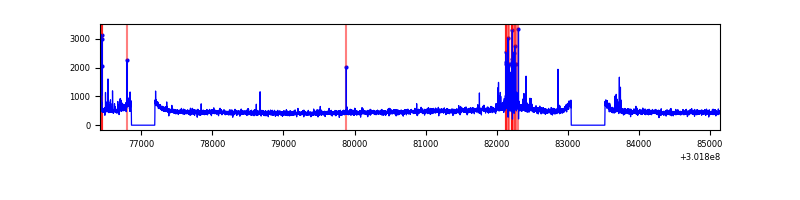 |
| C | 8727 | 7924 | 0 | 0 | 0.00% | 0.00% | 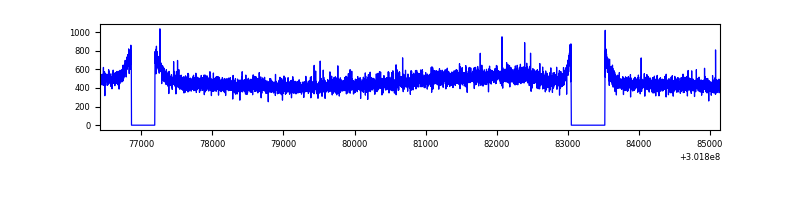 |
| D | 8727 | 7924 | 222 | 222 | 2.54% | 2.80% | 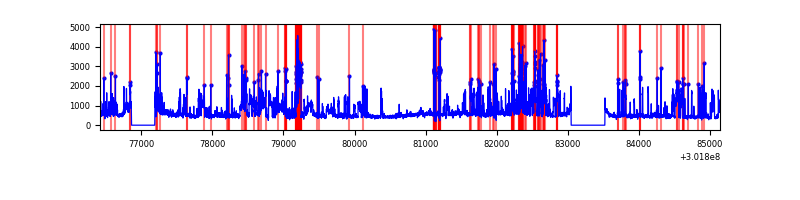 |
Top three noisy pixels from each quadrant. If the there are fewer than three noisy pixels in the level2.evt file, extra rows are filled as -1
| Pixel properties | Quadrant properties | ||||||
|---|---|---|---|---|---|---|---|
| Quadrant | DetID | PixID | Counts | Sigma | Mean | Median | Sigma |
| A | 0 | 226 | 8159 | 37.86 | 948 | 926 | 191.0 |
| A | 3 | 137 | 7743 | 35.68 | 948 | 926 | 191.0 |
| A | 12 | 194 | 6726 | 30.36 | 948 | 926 | 191.0 |
| B | 7 | 220 | 143085 | 781.98 | 944 | 921 | 181.8 |
| B | 0 | 229 | 32173 | 171.9 | 944 | 921 | 181.8 |
| B | 0 | 190 | 21970 | 115.78 | 944 | 921 | 181.8 |
| C | 14 | 238 | 140841 | 653.54 | 903 | 907 | 214.1 |
| C | 3 | 233 | 12661 | 54.9 | 903 | 907 | 214.1 |
| C | 8 | 128 | 11826 | 51.0 | 903 | 907 | 214.1 |
| D | 1 | 52 | 1788896 | 8108.18 | 901 | 871 | 220.5 |
| D | 5 | 222 | 426979 | 1932.28 | 901 | 871 | 220.5 |
| D | 1 | 20 | 110841 | 498.68 | 901 | 871 | 220.5 |
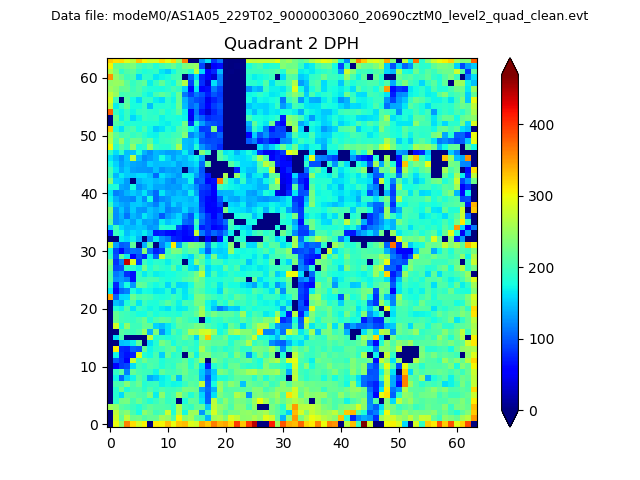
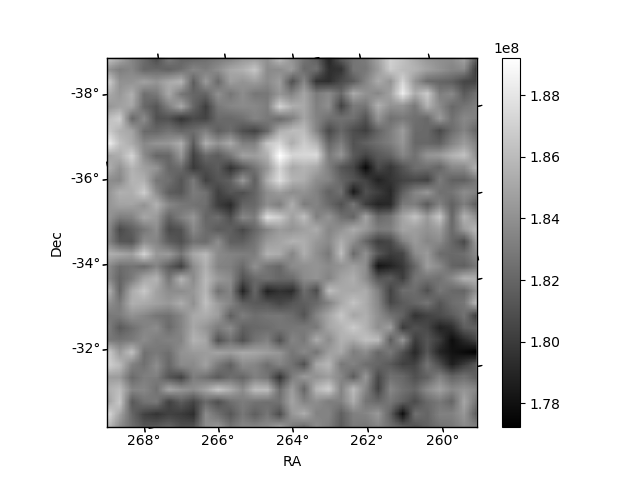
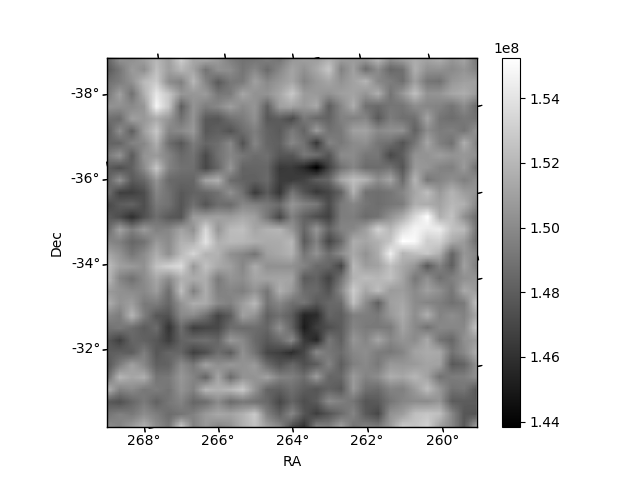
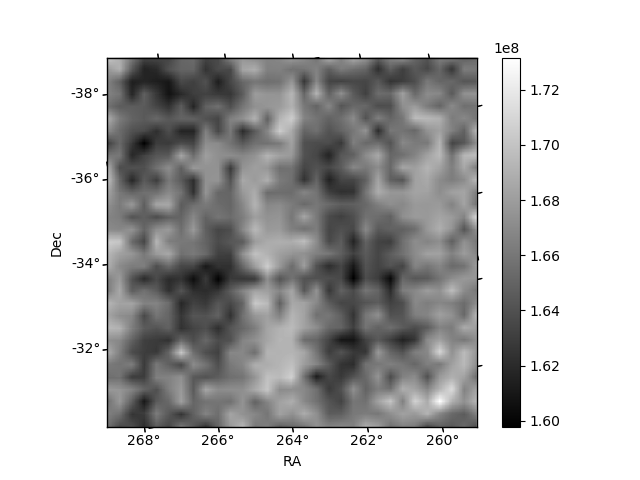
Histogram calculated using DETX and DETY for each event in the final _common_clean file
| Quadrant A | 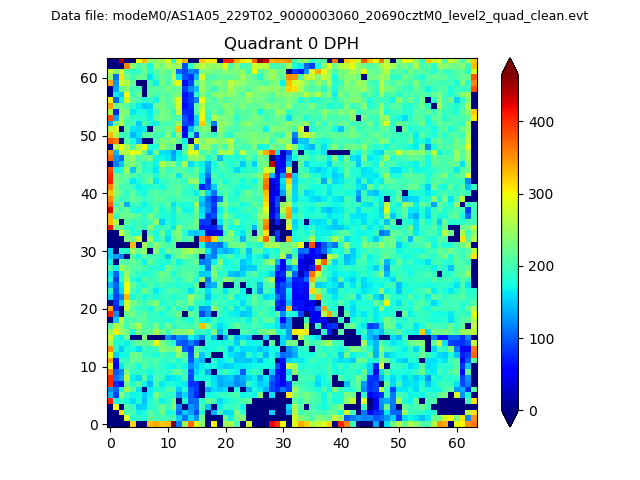 |
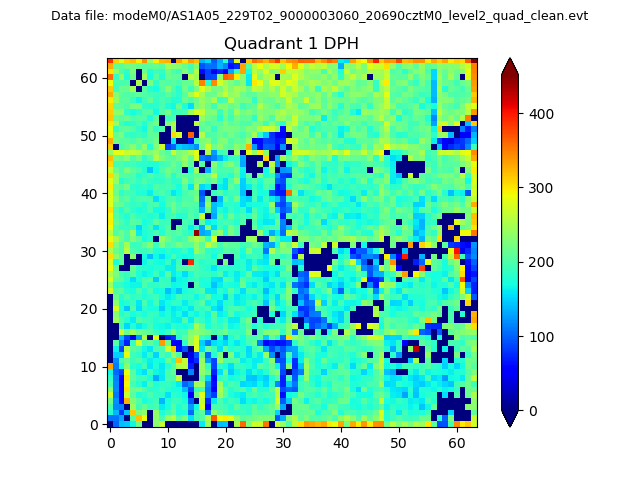 |
Quadrant B |
|---|---|---|---|
| Quadrant D | 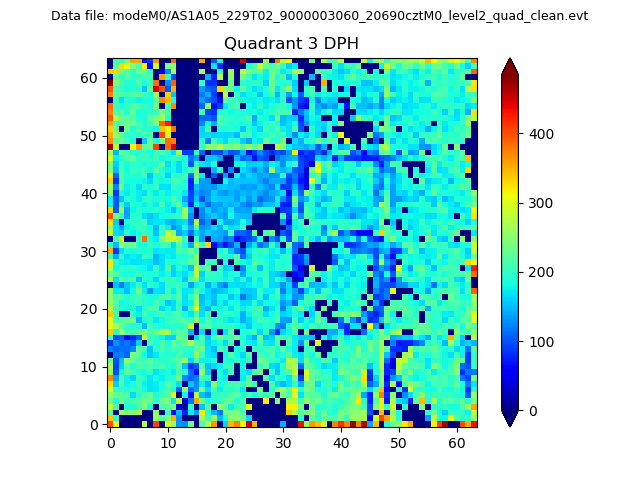 |
 |
Quadrant C |
| Plot type | Count rate plots | Images |
|---|---|---|
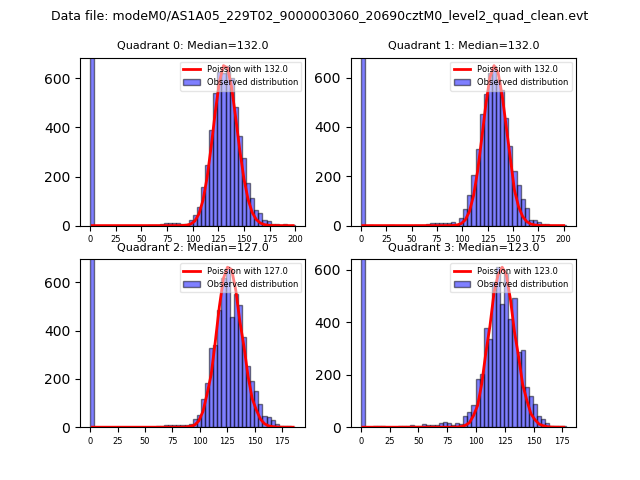
| Comparison with Poisson distribution Blue bars denote a histogram of data divided into 1 sec bins. Red curve is a Poisson curve with rate = median count rate of data. |
 |
 |
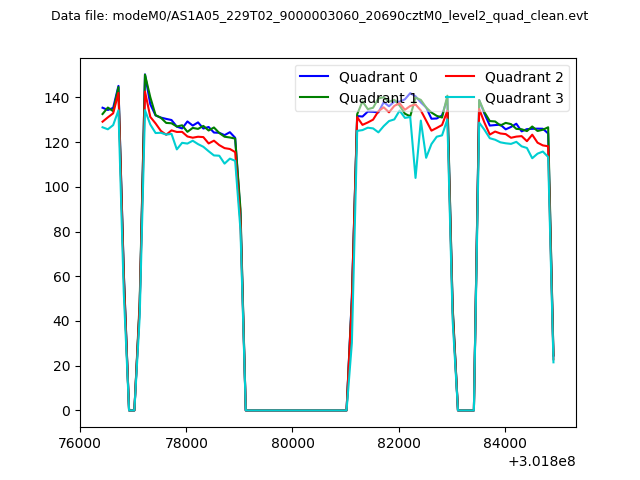
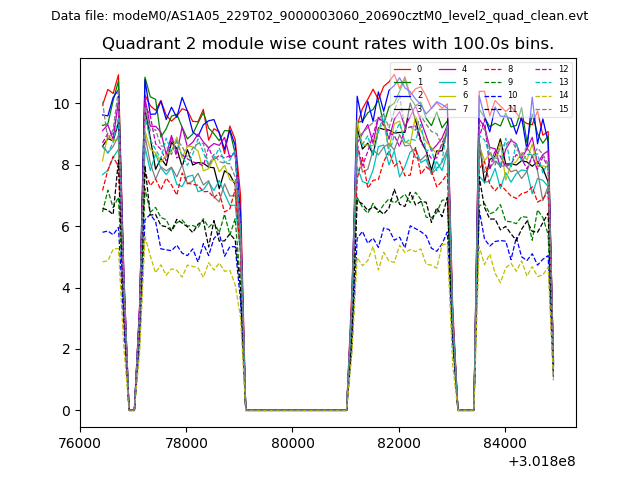
| Quadrant-wise count rates Data is divided into 100 sec bins |
 |
|
| Module-wise count rates for Quadrant A Data is divided into 100 sec bins |
 |
 |
| Module-wise count rates for Quadrant B Data is divided into 100 sec bins |
 |
 |
| Module-wise count rates for Quadrant C Data is divided into 100 sec bins |
 |
 |
| Module-wise count rates for Quadrant D Data is divided into 100 sec bins |
 |
 |
| Parameter | Plot |
|---|---|
| CZT HV Monitor | 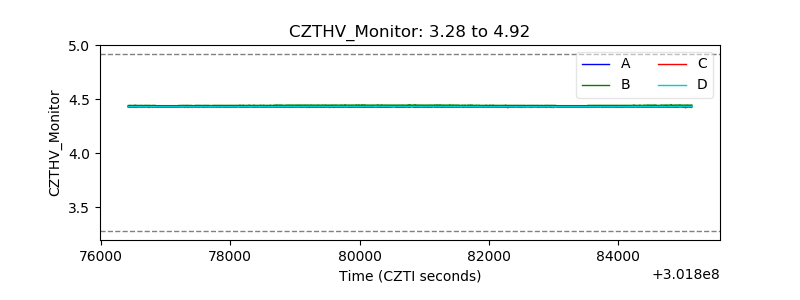 |
| D_VDD |  |
| Temperature 1 | 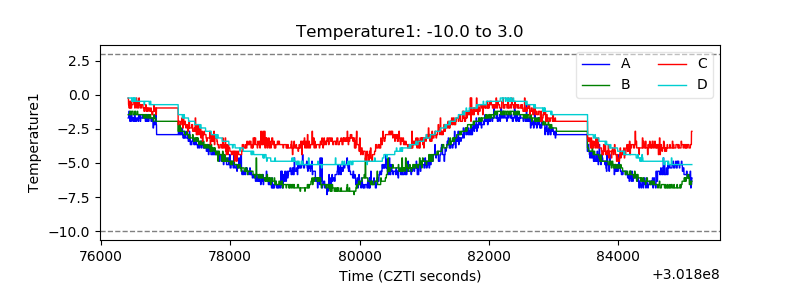 |
| Veto HV Monitor | 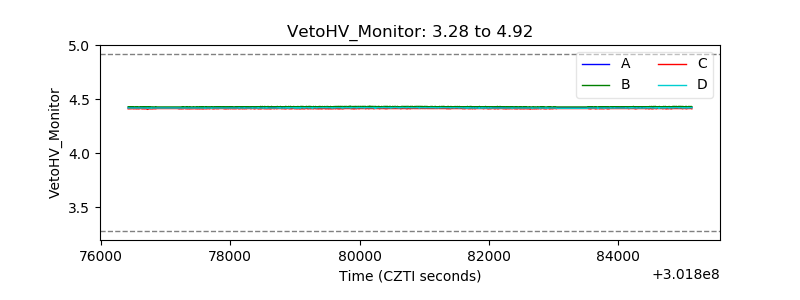 |
| Veto LLD |  |
| Alpha Counter | 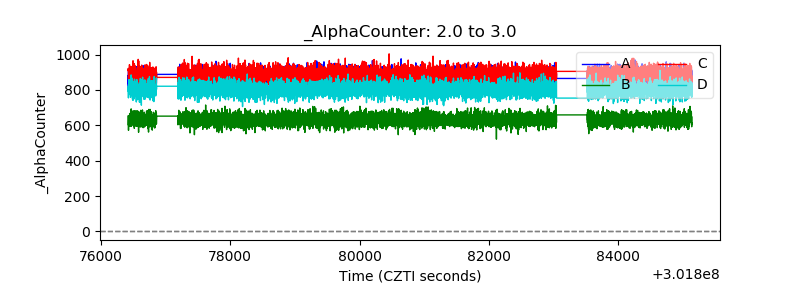 |
| _CPM_Rate | 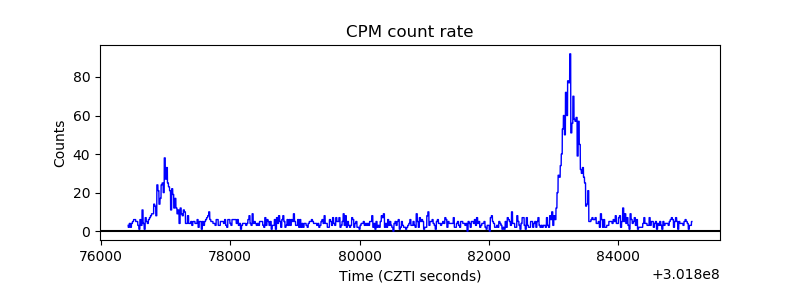 |
| CZT Counter | 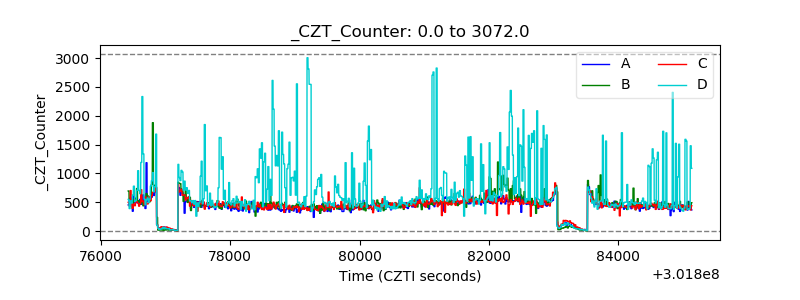 |
| +2.5 Volts monitor |  |
| +5 Volts monitor |  |
| _ROLL_ROT | 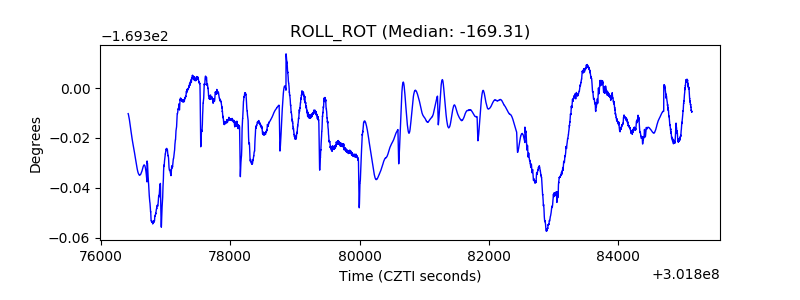 |
| _Roll_DEC | 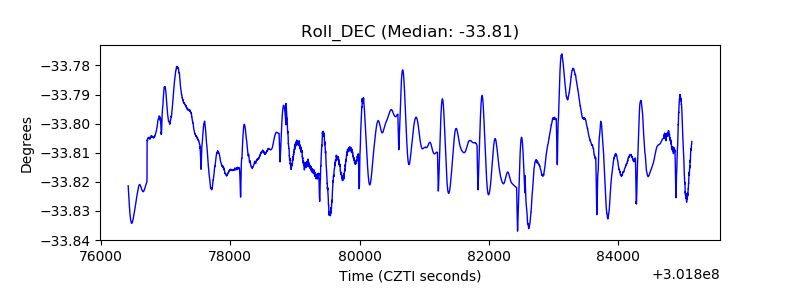 |
| _Roll_RA | 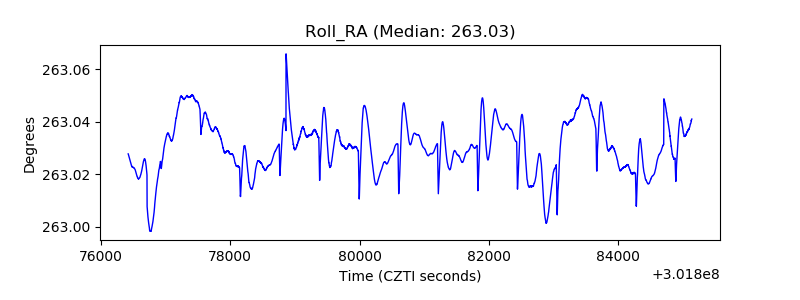 |
| Veto Counter | 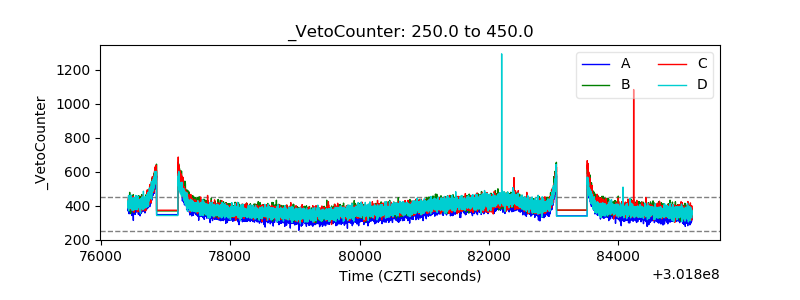 |