| Param | Original file | Final file |
|---|---|---|
| Filename | modeM0/AS1A05_229T02_9000003060_20692cztM0_level2.evt | modeM0/AS1A05_229T02_9000003060_20692cztM0_level2_quad_clean.evt |
| Size (bytes) | 962,429,760 | 158,083,200 |
| Size | 917.8 MB | 150.8 MB |
| Events in quadrant A | 5,881,284 | 1,016,423 |
| Events in quadrant B | 6,420,464 | 1,020,089 |
| Events in quadrant C | 6,022,145 | 988,999 |
| Events in quadrant D | 9,955,540 | 875,277 |
| Mode M0 | |||
|---|---|---|---|
| Quadrant | BADHDUFLAG | Total packets | Discarded packets |
| A | 0 | 26076 | 3 |
| B | 0 | 27405 | 3 |
| C | 0 | 26135 | 3 |
| D | 0 | 38298 | 3 |
| Mode SS | |||
|---|---|---|---|
| Quadrant | BADHDUFLAG | Total packets | Discarded packets |
| A | 0 | 262 | 0 |
| B | 0 | 262 | 0 |
| C | 0 | 262 | 0 |
| D | 0 | 262 | 0 |
| Mode M9 | |||
|---|---|---|---|
| Quadrant | BADHDUFLAG | Total packets | Discarded packets |
| A | 0 | 19 | 0 |
| B | 0 | 19 | 0 |
| C | 0 | 19 | 0 |
| D | 0 | 19 | 0 |
| Quadrant | Total seconds | Saturated seconds | Saturation percentage |
|---|---|---|---|
| A | 12827 | 53 | 0.413191% |
| B | 12828 | 140 | 1.091363% |
| C | 12828 | 103 | 0.802931% |
| D | 12828 | 1369 | 10.671968% |
Noise dominated data is calculated using 1-second bins in cleaned event files. If a bin has >2000 counts, and if more than 50% of those come from <1% of pixels, then it is considered to be noise-dominated and hence unusable.
| Quadrant | # 1 sec bins | Bins with >0 counts | Bins with >2000 counts | High rate bins dominated by noise | Noise dominated (total time) | Noise dominated (detector-on time) | Marked lightcurve |
|---|---|---|---|---|---|---|---|
| A | 14727 | 12830 | 0 | 0 | 0.00% | 0.00% | 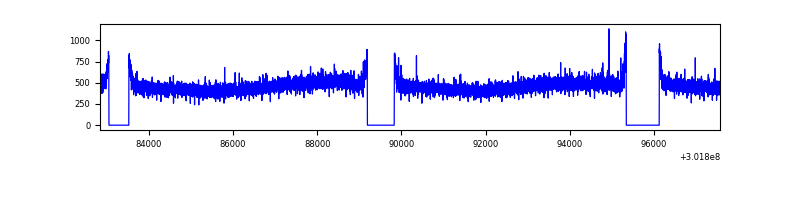 |
| B | 14728 | 12831 | 41 | 41 | 0.28% | 0.32% | 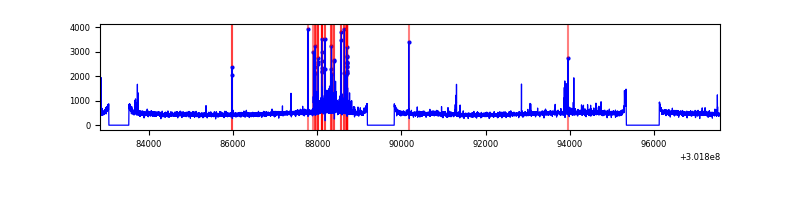 |
| C | 14728 | 12831 | 0 | 0 | 0.00% | 0.00% | 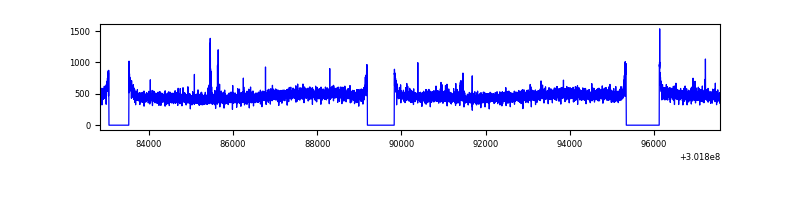 |
| D | 14728 | 12831 | 1137 | 1137 | 7.72% | 8.86% | 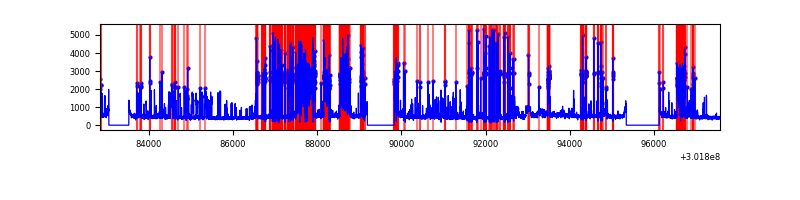 |
Top three noisy pixels from each quadrant. If the there are fewer than three noisy pixels in the level2.evt file, extra rows are filled as -1
| Pixel properties | Quadrant properties | ||||||
|---|---|---|---|---|---|---|---|
| Quadrant | DetID | PixID | Counts | Sigma | Mean | Median | Sigma |
| A | 0 | 226 | 13228 | 38.0 | 1528 | 1495 | 308.8 |
| A | 3 | 137 | 12818 | 36.67 | 1528 | 1495 | 308.8 |
| A | 12 | 194 | 10911 | 30.5 | 1528 | 1495 | 308.8 |
| B | 7 | 220 | 272528 | 941.08 | 1524 | 1486 | 288.0 |
| B | 3 | 64 | 54445 | 183.88 | 1524 | 1486 | 288.0 |
| B | 12 | 111 | 34966 | 116.24 | 1524 | 1486 | 288.0 |
| C | 14 | 238 | 228183 | 660.76 | 1463 | 1471 | 343.1 |
| C | 9 | 54 | 31226 | 86.72 | 1463 | 1471 | 343.1 |
| C | 7 | 247 | 29391 | 81.37 | 1463 | 1471 | 343.1 |
| D | 1 | 52 | 4036370 | 11933.24 | 1388 | 1346 | 338.1 |
| D | 5 | 222 | 382359 | 1126.81 | 1388 | 1346 | 338.1 |
| D | 7 | 238 | 105230 | 307.23 | 1388 | 1346 | 338.1 |
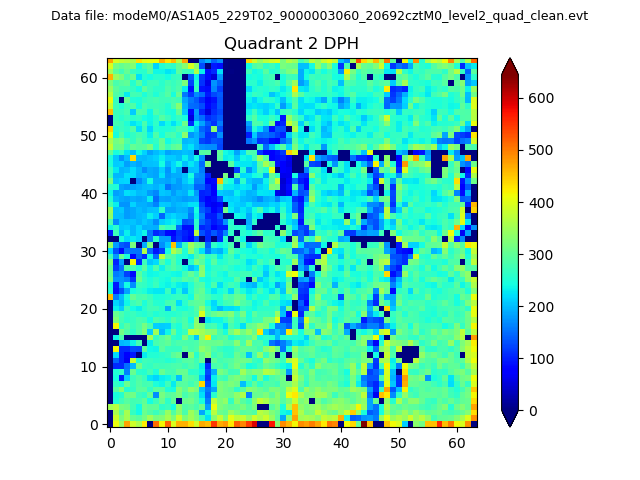
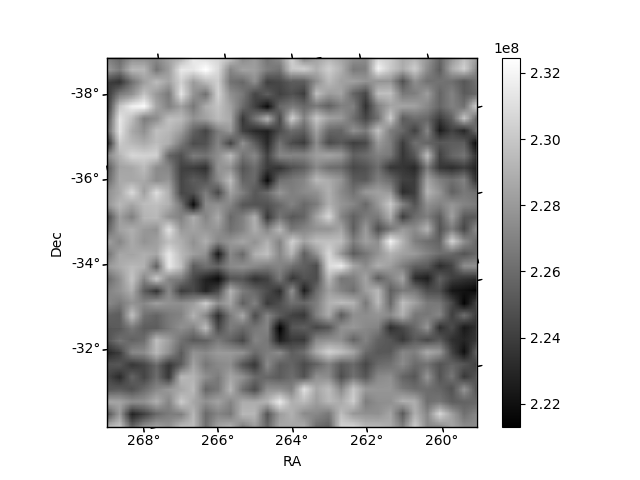
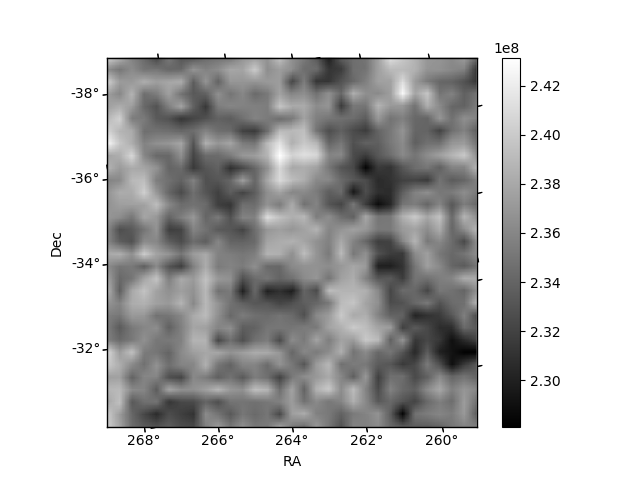
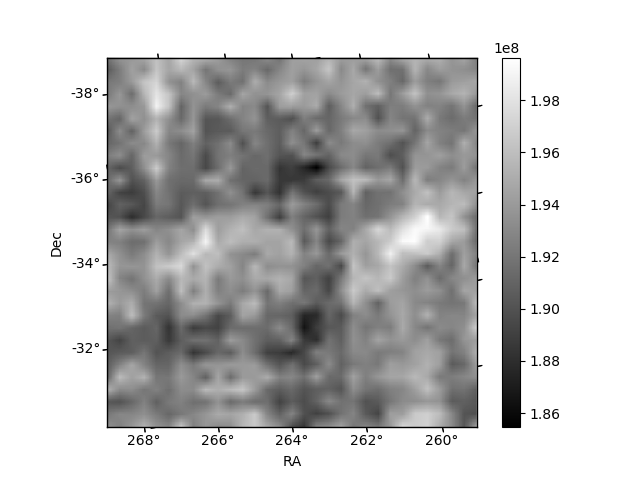
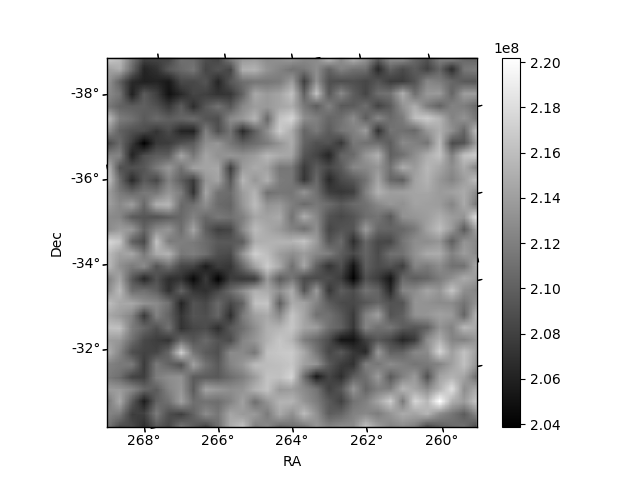
Histogram calculated using DETX and DETY for each event in the final _common_clean file
| Quadrant A | 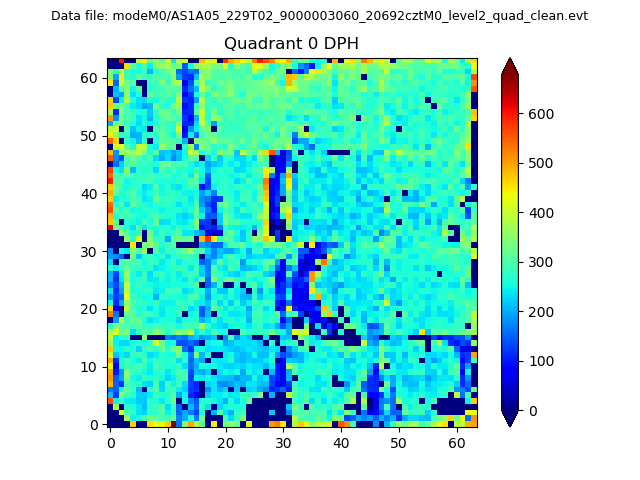 |
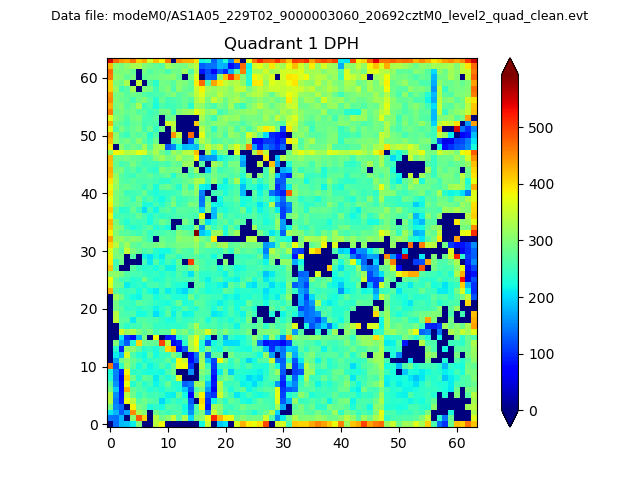 |
Quadrant B |
|---|---|---|---|
| Quadrant D | 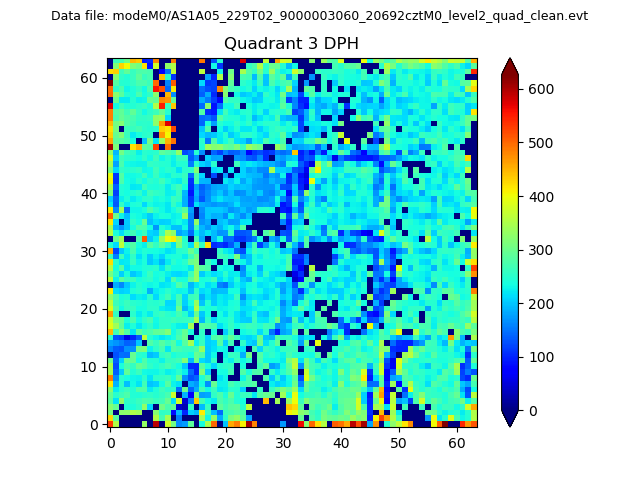 |
 |
Quadrant C |
| Plot type | Count rate plots | Images |
|---|---|---|
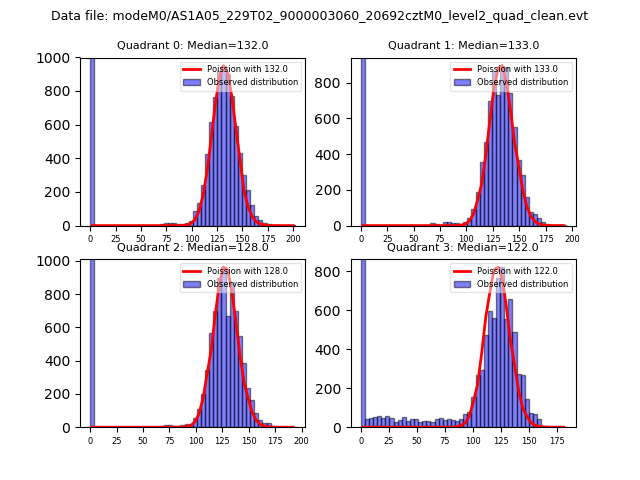
| Comparison with Poisson distribution Blue bars denote a histogram of data divided into 1 sec bins. Red curve is a Poisson curve with rate = median count rate of data. |
 |
 |
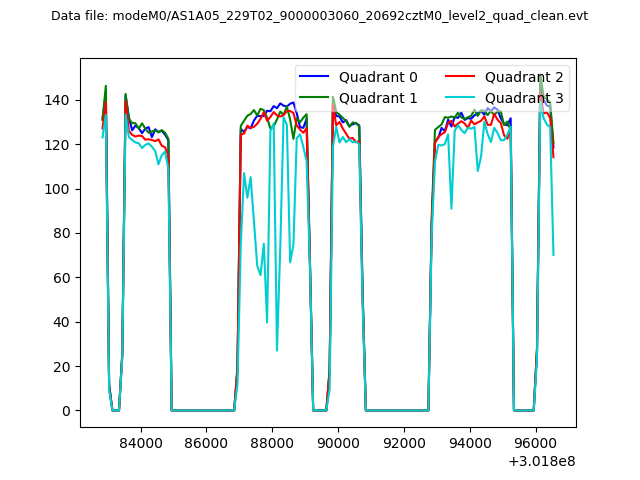
| Quadrant-wise count rates Data is divided into 100 sec bins |
 |
|
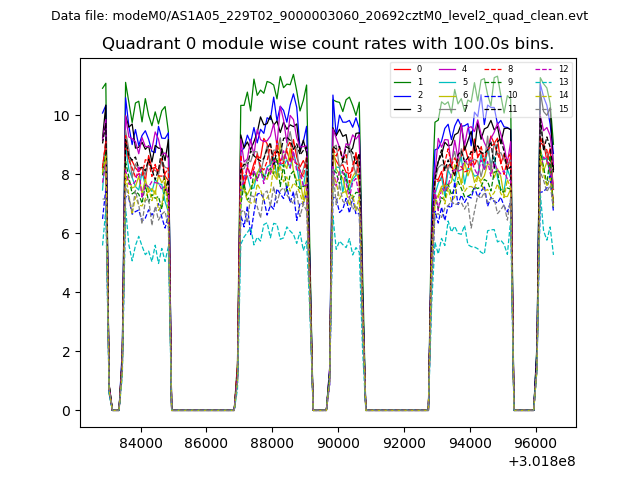
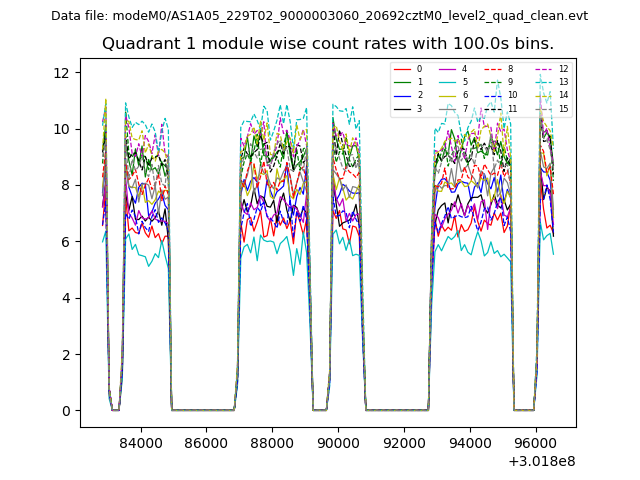
| Module-wise count rates for Quadrant A Data is divided into 100 sec bins |
 |
 |
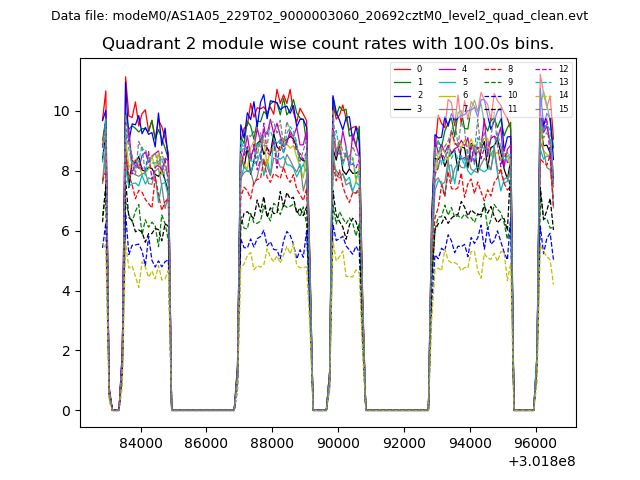
| Module-wise count rates for Quadrant B Data is divided into 100 sec bins |
 |
 |
| Module-wise count rates for Quadrant C Data is divided into 100 sec bins |
 |
 |
| Module-wise count rates for Quadrant D Data is divided into 100 sec bins |
 |
 |
| Parameter | Plot |
|---|---|
| CZT HV Monitor | 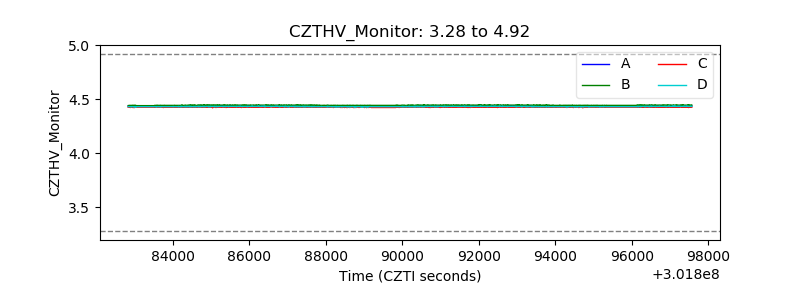 |
| D_VDD | 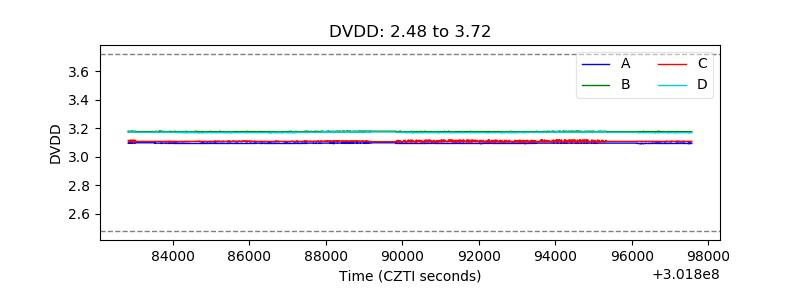 |
| Temperature 1 | 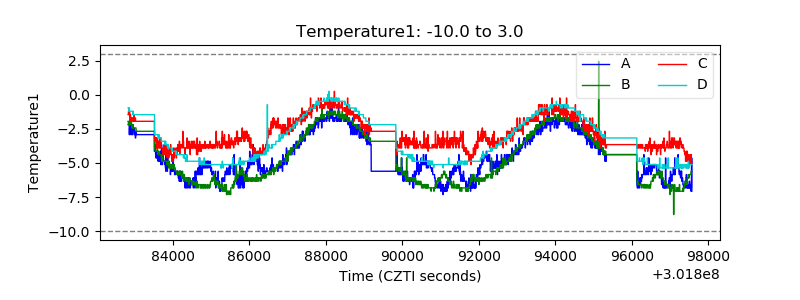 |
| Veto HV Monitor | 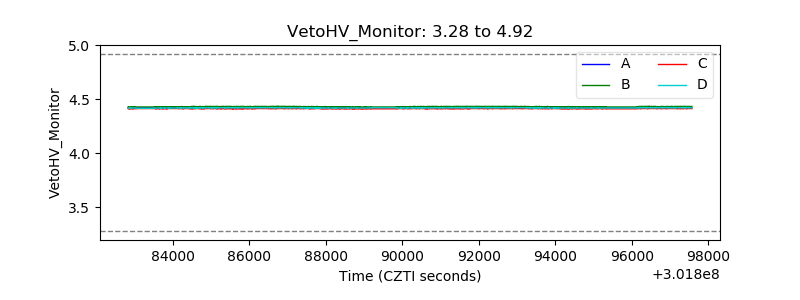 |
| Veto LLD | 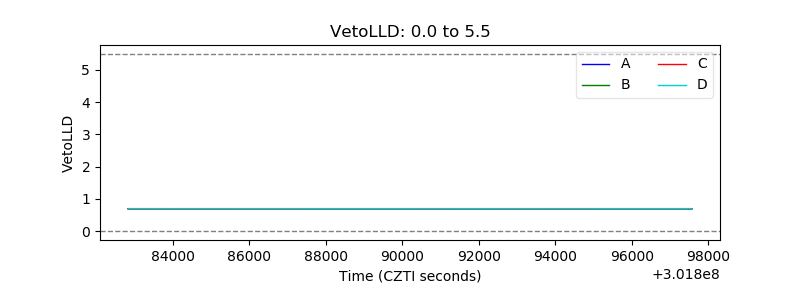 |
| Alpha Counter | 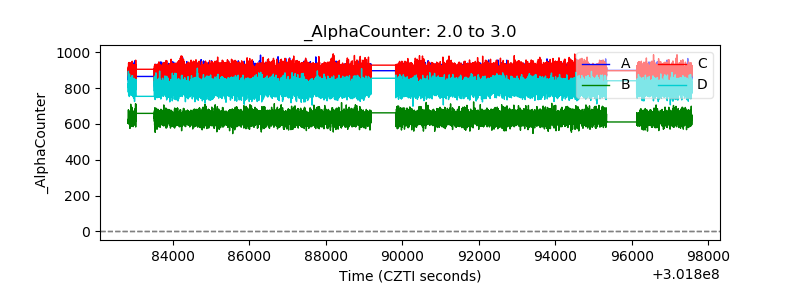 |
| _CPM_Rate | 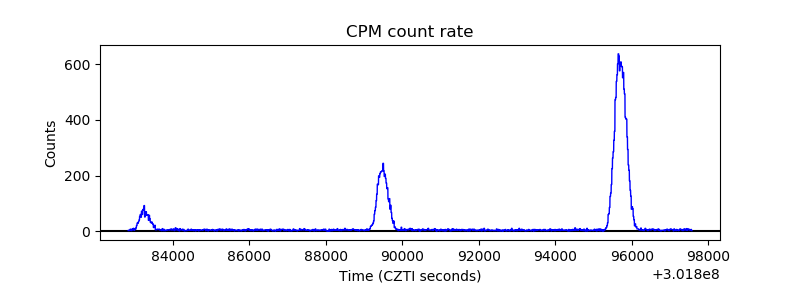 |
| CZT Counter | 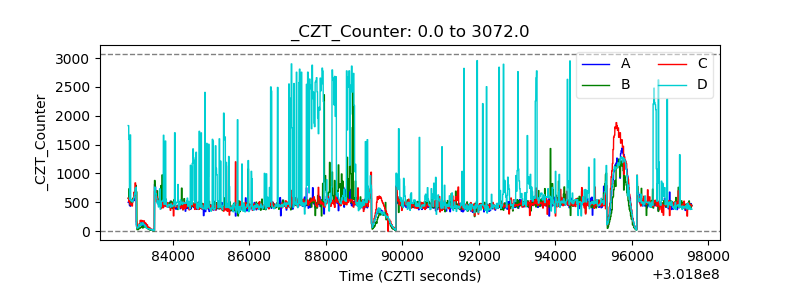 |
| +2.5 Volts monitor |  |
| +5 Volts monitor |  |
| _ROLL_ROT |  |
| _Roll_DEC | 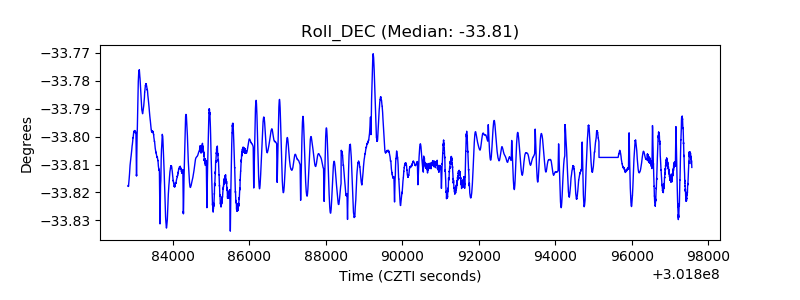 |
| _Roll_RA | 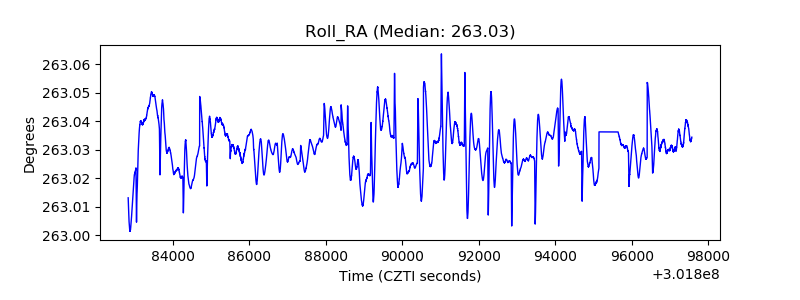 |
| Veto Counter |  |