| Param | Original file | Final file |
|---|---|---|
| Filename | modeM0/AS1A05_229T02_9000003060_20693cztM0_level2.evt | modeM0/AS1A05_229T02_9000003060_20693cztM0_level2_quad_clean.evt |
| Size (bytes) | 489,516,480 | 72,817,920 |
| Size | 466.8 MB | 69.4 MB |
| Events in quadrant A | 3,191,165 | 443,892 |
| Events in quadrant B | 3,787,469 | 436,323 |
| Events in quadrant C | 3,277,967 | 433,813 |
| Events in quadrant D | 4,108,172 | 418,372 |
| Mode M0 | |||
|---|---|---|---|
| Quadrant | BADHDUFLAG | Total packets | Discarded packets |
| A | 0 | 13857 | 2 |
| B | 0 | 15605 | 2 |
| C | 0 | 13921 | 2 |
| D | 0 | 16840 | 2 |
| Mode SS | |||
|---|---|---|---|
| Quadrant | BADHDUFLAG | Total packets | Discarded packets |
| A | 0 | 136 | 0 |
| B | 0 | 136 | 0 |
| C | 0 | 136 | 0 |
| D | 0 | 136 | 0 |
| Mode M9 | |||
|---|---|---|---|
| Quadrant | BADHDUFLAG | Total packets | Discarded packets |
| A | 0 | 10 | 0 |
| B | 0 | 11 | 0 |
| C | 0 | 11 | 0 |
| D | 0 | 11 | 0 |
| Quadrant | Total seconds | Saturated seconds | Saturation percentage |
|---|---|---|---|
| A | 6781 | 51 | 0.752101% |
| B | 6781 | 167 | 2.462764% |
| C | 6781 | 81 | 1.194514% |
| D | 6781 | 222 | 3.273853% |
Noise dominated data is calculated using 1-second bins in cleaned event files. If a bin has >2000 counts, and if more than 50% of those come from <1% of pixels, then it is considered to be noise-dominated and hence unusable.
| Quadrant | # 1 sec bins | Bins with >0 counts | Bins with >2000 counts | High rate bins dominated by noise | Noise dominated (total time) | Noise dominated (detector-on time) | Marked lightcurve |
|---|---|---|---|---|---|---|---|
| A | 7701 | 6782 | 0 | 0 | 0.00% | 0.00% | 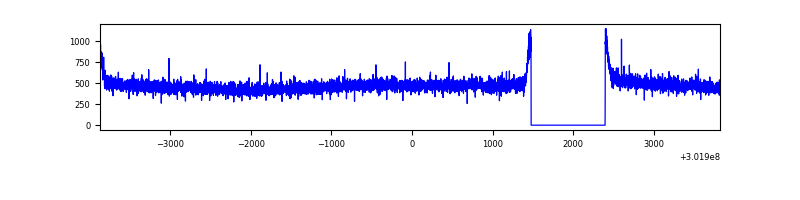 |
| B | 7701 | 6782 | 79 | 79 | 1.03% | 1.16% | 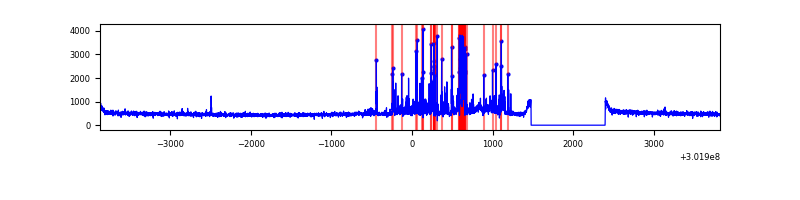 |
| C | 7701 | 6782 | 0 | 0 | 0.00% | 0.00% | 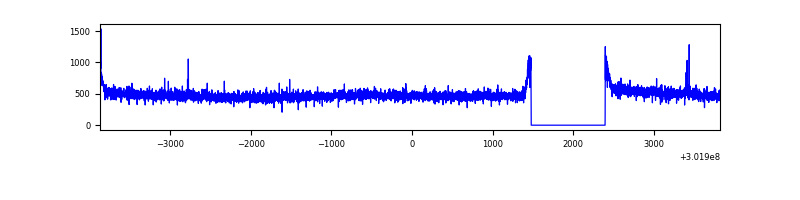 |
| D | 7701 | 6782 | 152 | 152 | 1.97% | 2.24% | 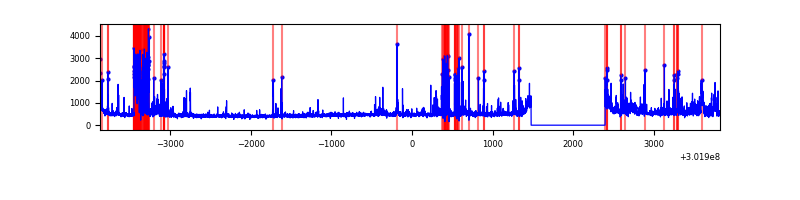 |
Top three noisy pixels from each quadrant. If the there are fewer than three noisy pixels in the level2.evt file, extra rows are filled as -1
| Pixel properties | Quadrant properties | ||||||
|---|---|---|---|---|---|---|---|
| Quadrant | DetID | PixID | Counts | Sigma | Mean | Median | Sigma |
| A | 0 | 226 | 7050 | 37.19 | 830 | 814 | 167.7 |
| A | 3 | 137 | 6688 | 35.03 | 830 | 814 | 167.7 |
| A | 12 | 194 | 5885 | 30.24 | 830 | 814 | 167.7 |
| B | 7 | 220 | 401639 | 2553.71 | 821 | 801 | 157.0 |
| B | 0 | 197 | 136629 | 865.35 | 821 | 801 | 157.0 |
| B | 12 | 111 | 19198 | 117.21 | 821 | 801 | 157.0 |
| C | 14 | 238 | 124036 | 660.35 | 797 | 801 | 186.6 |
| C | 3 | 233 | 19640 | 100.95 | 797 | 801 | 186.6 |
| C | 7 | 247 | 18754 | 96.2 | 797 | 801 | 186.6 |
| D | 1 | 52 | 880035 | 4561.29 | 795 | 773 | 192.8 |
| D | 5 | 222 | 94906 | 488.33 | 795 | 773 | 192.8 |
| D | 2 | 234 | 29206 | 147.5 | 795 | 773 | 192.8 |
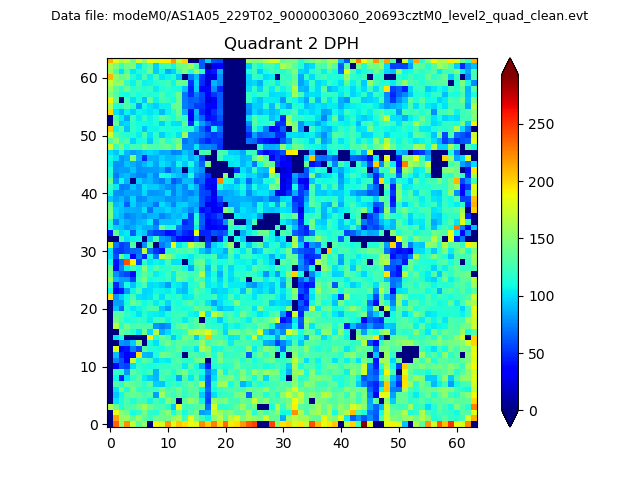
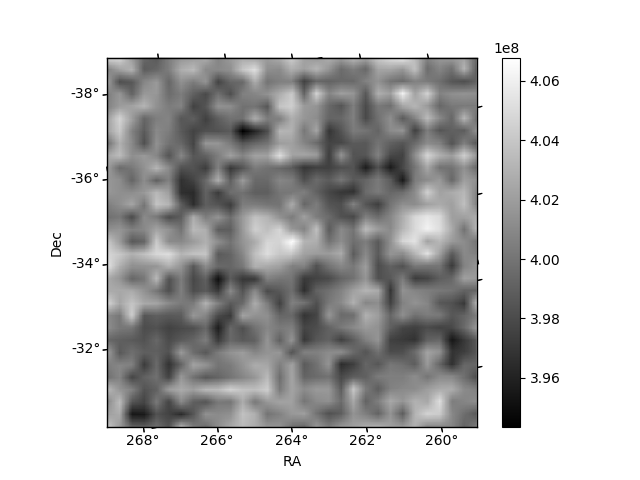
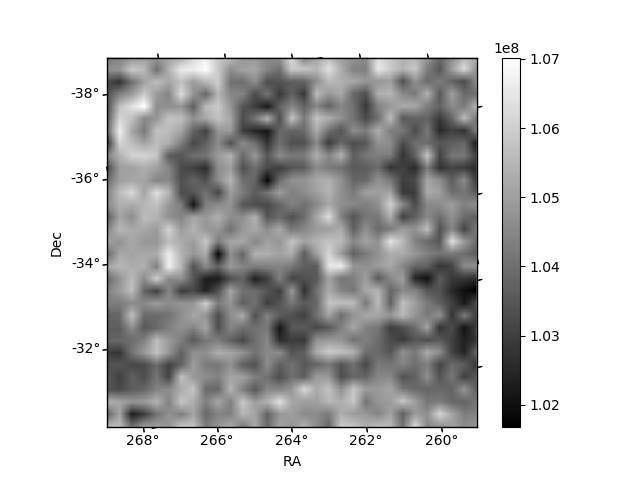
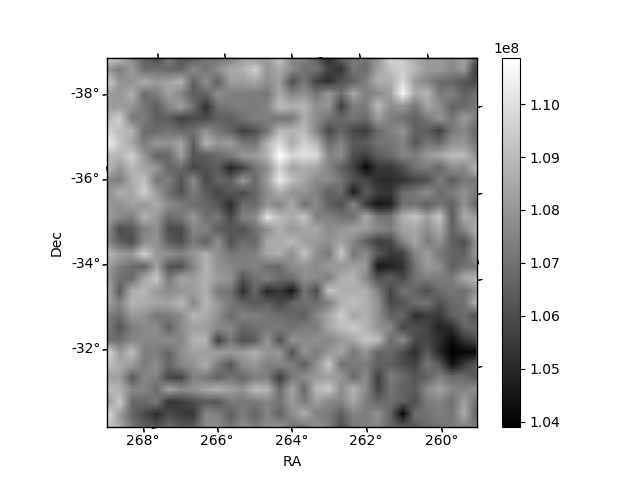
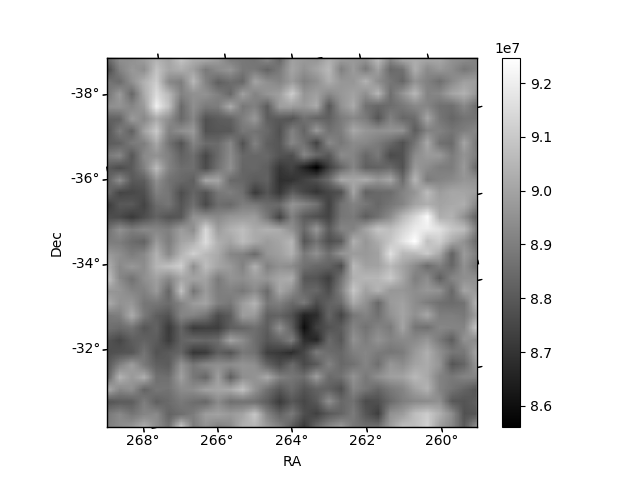
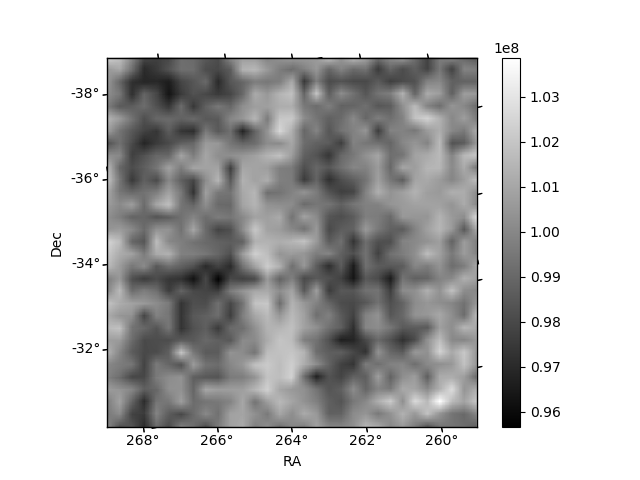
Histogram calculated using DETX and DETY for each event in the final _common_clean file
| Quadrant A | 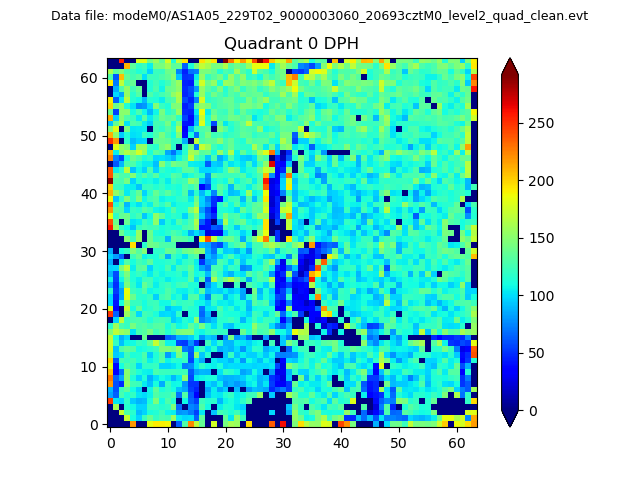 |
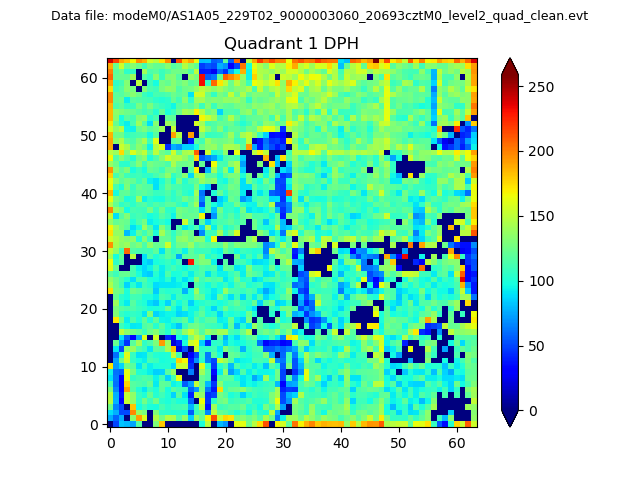 |
Quadrant B |
|---|---|---|---|
| Quadrant D | 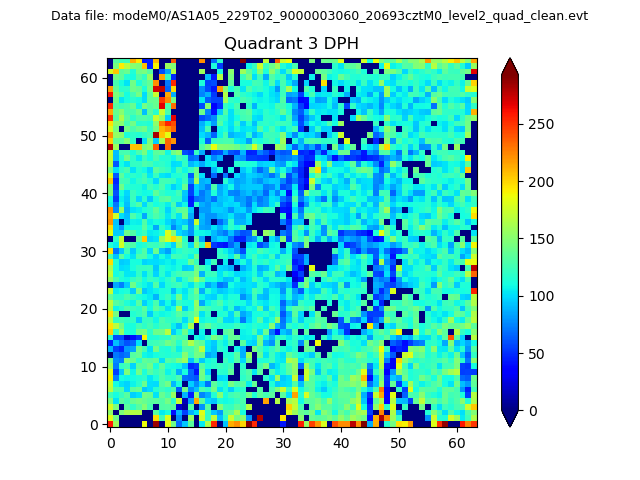 |
 |
Quadrant C |
| Plot type | Count rate plots | Images |
|---|---|---|
| Comparison with Poisson distribution Blue bars denote a histogram of data divided into 1 sec bins. Red curve is a Poisson curve with rate = median count rate of data. |
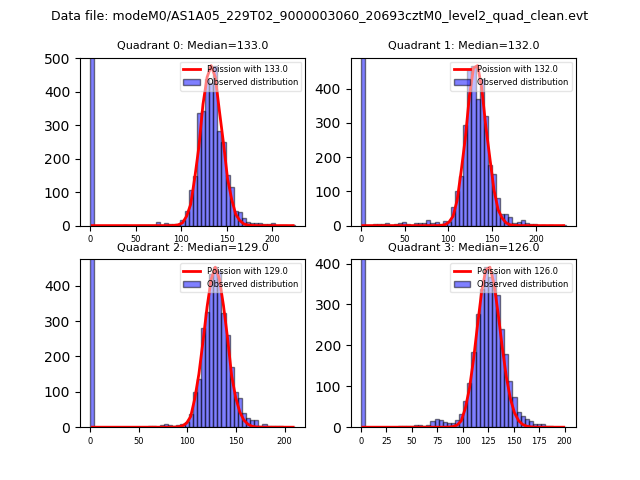 |
 |
| Quadrant-wise count rates Data is divided into 100 sec bins |
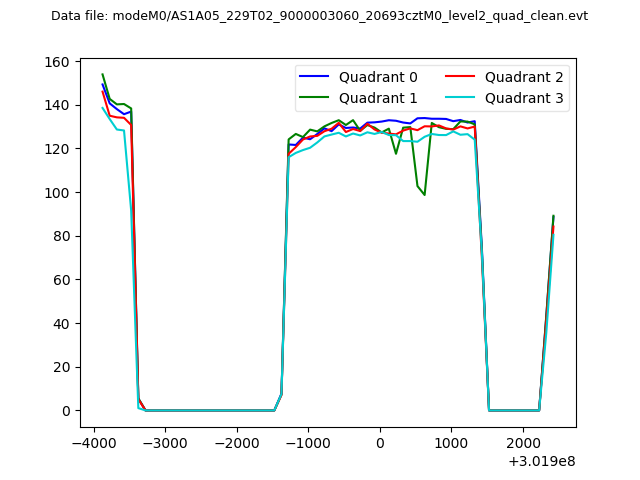 |
|
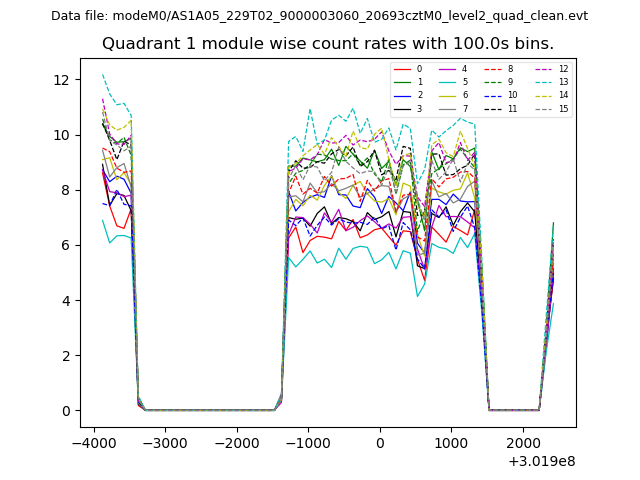
| Module-wise count rates for Quadrant A Data is divided into 100 sec bins |
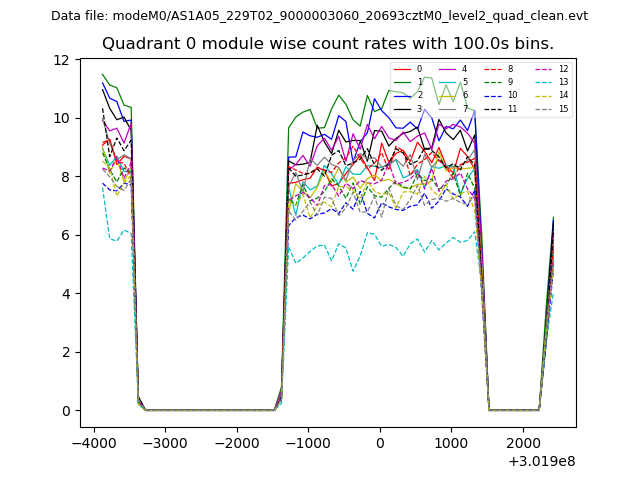 |
 |
| Module-wise count rates for Quadrant B Data is divided into 100 sec bins |
 |
 |
| Module-wise count rates for Quadrant C Data is divided into 100 sec bins |
 |
 |
| Module-wise count rates for Quadrant D Data is divided into 100 sec bins |
 |
 |
| Parameter | Plot |
|---|---|
| CZT HV Monitor | 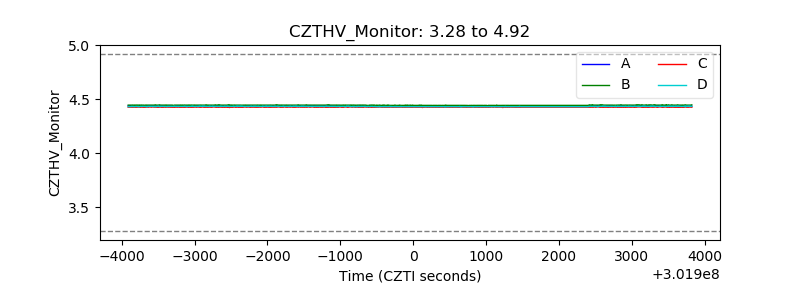 |
| D_VDD | 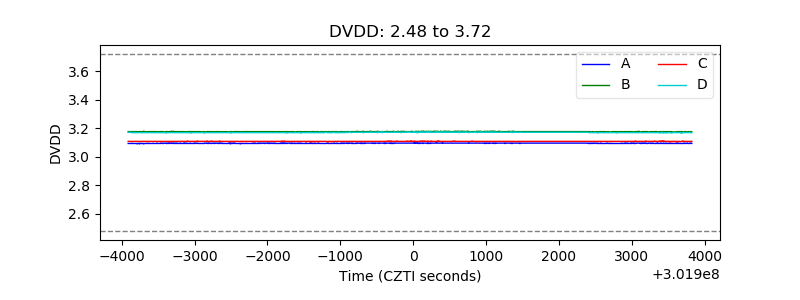 |
| Temperature 1 | 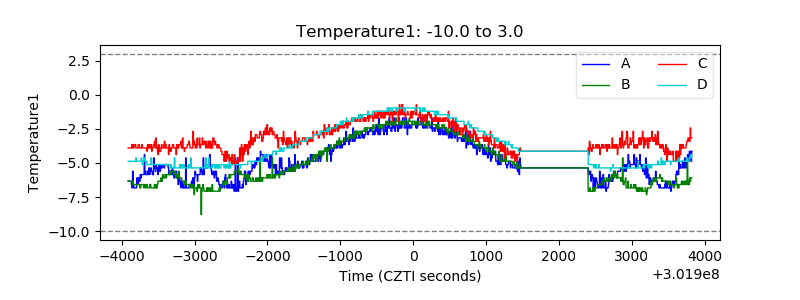 |
| Veto HV Monitor | 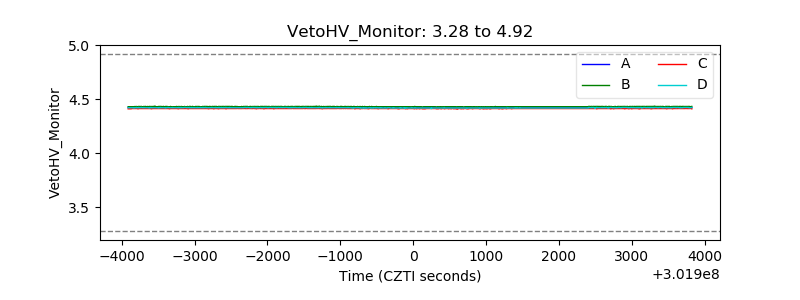 |
| Veto LLD |  |
| Alpha Counter | 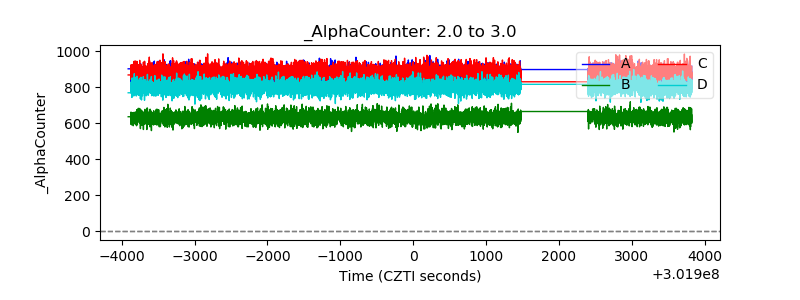 |
| _CPM_Rate | 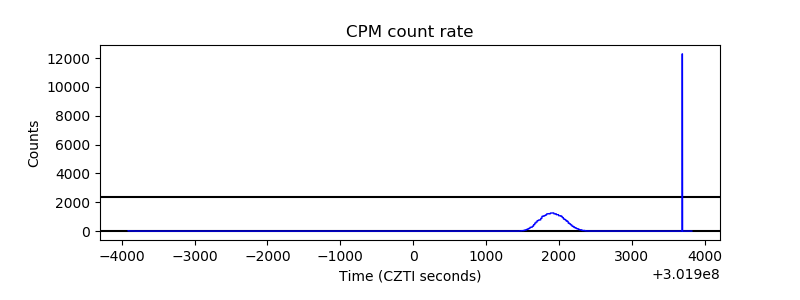 |
| CZT Counter | 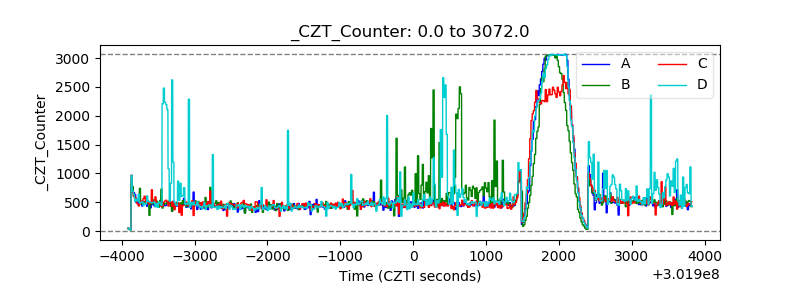 |
| +2.5 Volts monitor |  |
| +5 Volts monitor |  |
| _ROLL_ROT | 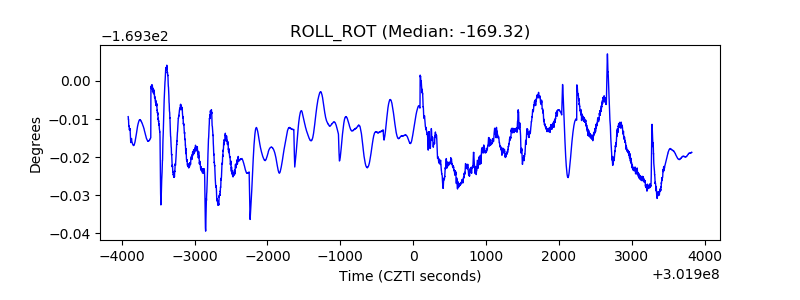 |
| _Roll_DEC | 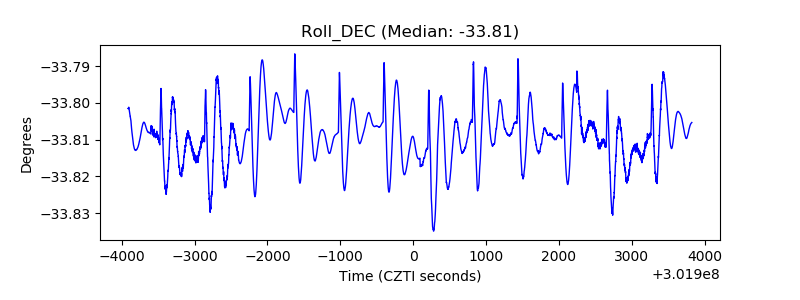 |
| _Roll_RA | 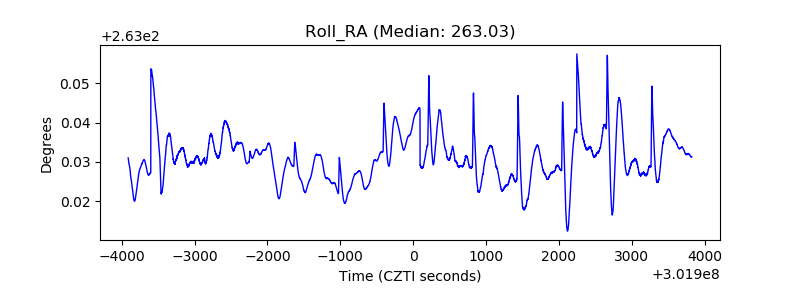 |
| Veto Counter |  |