| Param | Original file | Final file |
|---|---|---|
| Filename | modeM0/AS1A05_229T02_9000003060_20696cztM0_level2.evt | modeM0/AS1A05_229T02_9000003060_20696cztM0_level2_quad_clean.evt |
| Size (bytes) | 329,025,600 | 62,637,120 |
| Size | 313.8 MB | 59.7 MB |
| Events in quadrant A | 2,289,307 | 398,722 |
| Events in quadrant B | 2,642,888 | 399,265 |
| Events in quadrant C | 2,356,653 | 392,435 |
| Events in quadrant D | 2,360,754 | 381,631 |
| Mode M0 | |||
|---|---|---|---|
| Quadrant | BADHDUFLAG | Total packets | Discarded packets |
| A | 0 | 9584 | 1 |
| B | 0 | 10707 | 1 |
| C | 0 | 9785 | 1 |
| D | 0 | 9910 | 1 |
| Mode SS | |||
|---|---|---|---|
| Quadrant | BADHDUFLAG | Total packets | Discarded packets |
| A | 0 | 94 | 0 |
| B | 0 | 94 | 0 |
| C | 0 | 94 | 0 |
| D | 0 | 94 | 0 |
| Mode M9 | |||
|---|---|---|---|
| Quadrant | BADHDUFLAG | Total packets | Discarded packets |
| A | 0 | 11 | 0 |
| B | 0 | 11 | 0 |
| C | 0 | 11 | 0 |
| D | 0 | 11 | 0 |
| Quadrant | Total seconds | Saturated seconds | Saturation percentage |
|---|---|---|---|
| A | 4619 | 38 | 0.822689% |
| B | 4620 | 95 | 2.056277% |
| C | 4620 | 60 | 1.298701% |
| D | 4620 | 56 | 1.212121% |
Noise dominated data is calculated using 1-second bins in cleaned event files. If a bin has >2000 counts, and if more than 50% of those come from <1% of pixels, then it is considered to be noise-dominated and hence unusable.
| Quadrant | # 1 sec bins | Bins with >0 counts | Bins with >2000 counts | High rate bins dominated by noise | Noise dominated (total time) | Noise dominated (detector-on time) | Marked lightcurve |
|---|---|---|---|---|---|---|---|
| A | 5694 | 4620 | 0 | 0 | 0.00% | 0.00% | 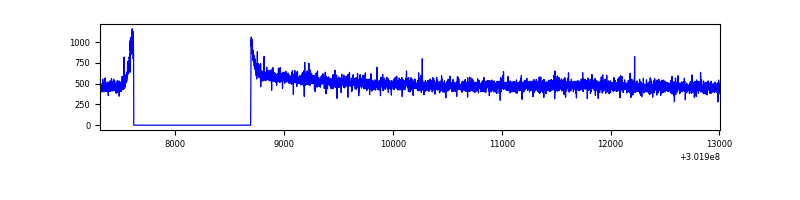 |
| B | 5695 | 4621 | 28 | 28 | 0.49% | 0.61% | 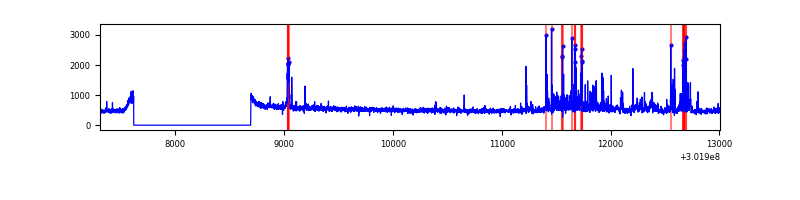 |
| C | 5695 | 4620 | 0 | 0 | 0.00% | 0.00% | 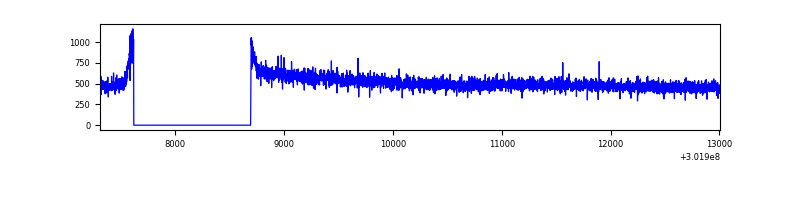 |
| D | 5695 | 4621 | 14 | 14 | 0.25% | 0.30% | 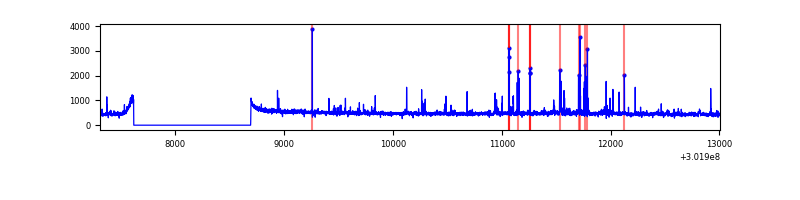 |
Top three noisy pixels from each quadrant. If the there are fewer than three noisy pixels in the level2.evt file, extra rows are filled as -1
| Pixel properties | Quadrant properties | ||||||
|---|---|---|---|---|---|---|---|
| Quadrant | DetID | PixID | Counts | Sigma | Mean | Median | Sigma |
| A | 0 | 226 | 5238 | 38.49 | 596 | 585 | 120.9 |
| A | 3 | 137 | 4535 | 32.67 | 596 | 585 | 120.9 |
| A | 12 | 194 | 4256 | 30.37 | 596 | 585 | 120.9 |
| B | 7 | 220 | 210533 | 1890.7 | 589 | 577 | 111.0 |
| B | 0 | 197 | 62778 | 560.14 | 589 | 577 | 111.0 |
| B | 3 | 64 | 38535 | 341.82 | 589 | 577 | 111.0 |
| C | 14 | 238 | 90076 | 675.33 | 572 | 576 | 132.5 |
| C | 7 | 247 | 31751 | 235.23 | 572 | 576 | 132.5 |
| C | 3 | 233 | 5621 | 38.07 | 572 | 576 | 132.5 |
| D | 5 | 222 | 66227 | 473.6 | 579 | 566 | 138.6 |
| D | 1 | 52 | 43340 | 308.52 | 579 | 566 | 138.6 |
| D | 2 | 234 | 21522 | 151.15 | 579 | 566 | 138.6 |
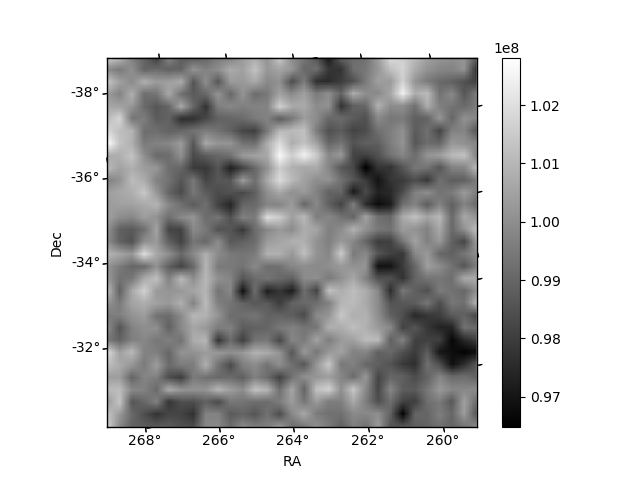
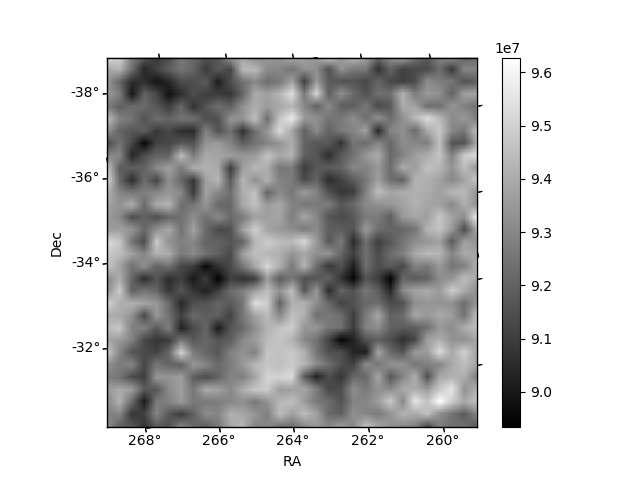
Histogram calculated using DETX and DETY for each event in the final _common_clean file
| Quadrant A | 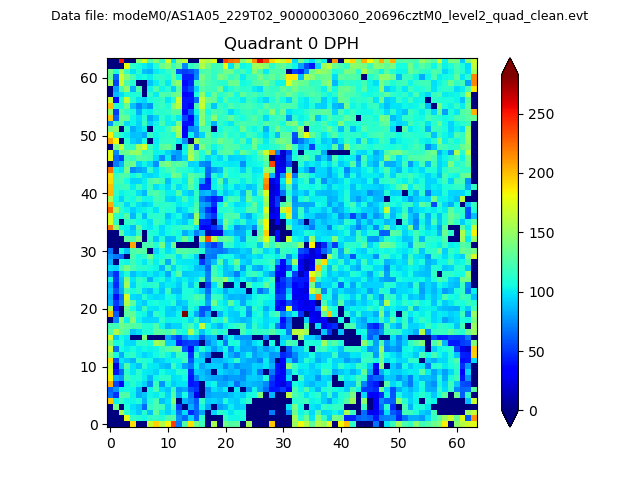 |
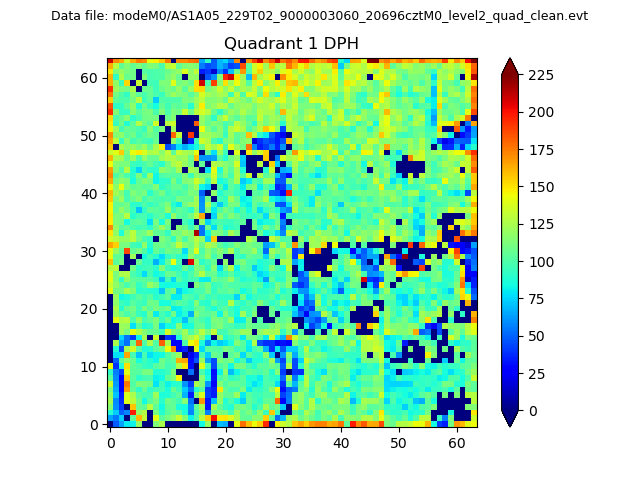 |
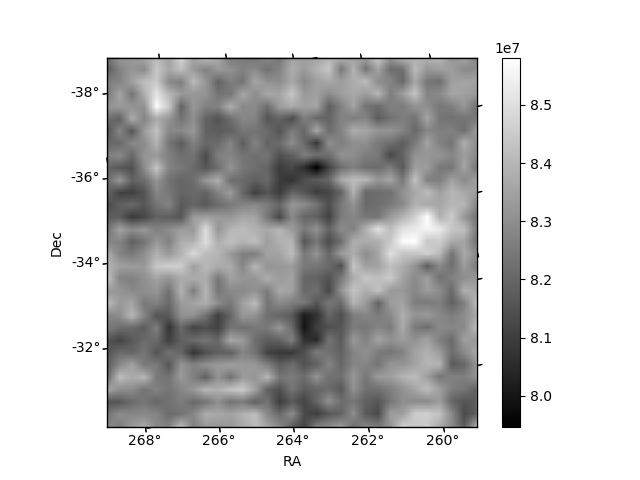
Quadrant B |
|---|---|---|---|
| Quadrant D | 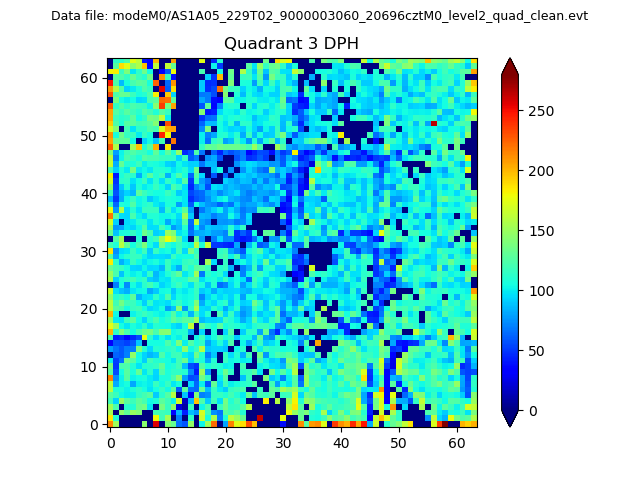 |
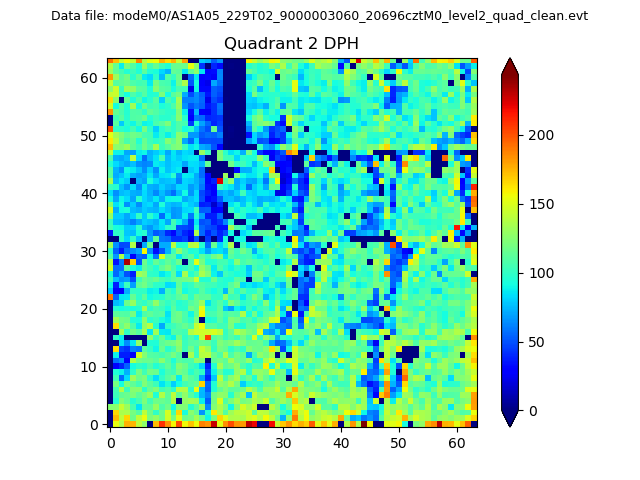 |
Quadrant C |
| Plot type | Count rate plots | Images |
|---|---|---|
| Comparison with Poisson distribution Blue bars denote a histogram of data divided into 1 sec bins. Red curve is a Poisson curve with rate = median count rate of data. |
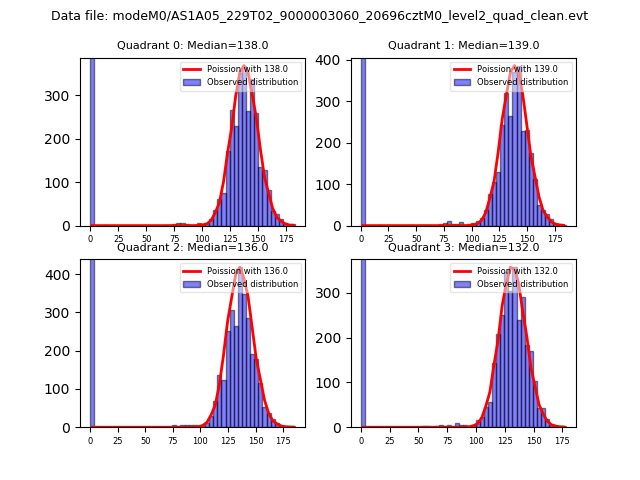 |
 |
| Quadrant-wise count rates Data is divided into 100 sec bins |
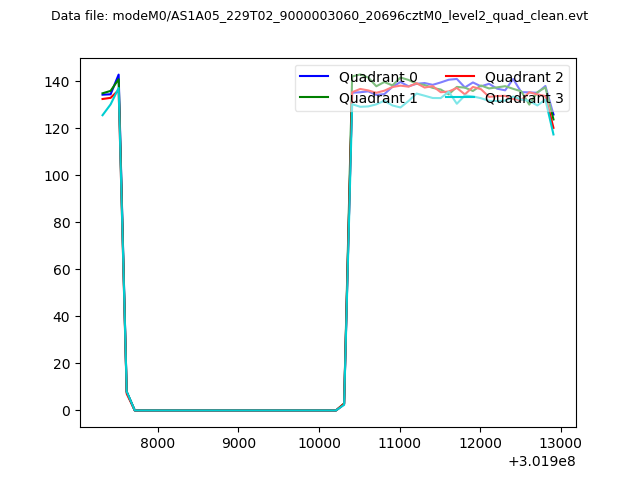 |
|
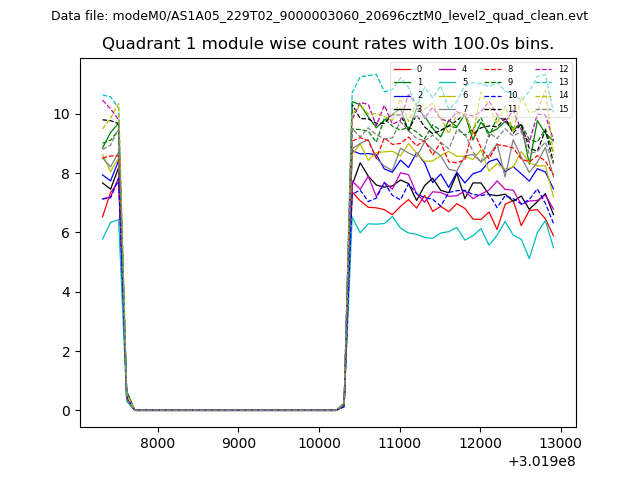
| Module-wise count rates for Quadrant A Data is divided into 100 sec bins |
 |
 |
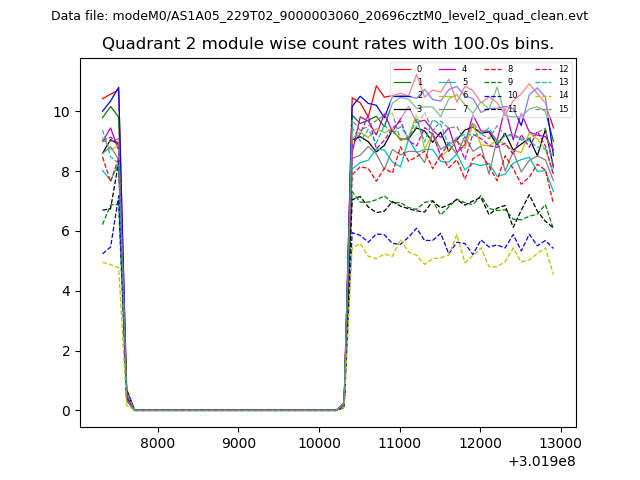
| Module-wise count rates for Quadrant B Data is divided into 100 sec bins |
 |
 |
| Module-wise count rates for Quadrant C Data is divided into 100 sec bins |
 |
 |
| Module-wise count rates for Quadrant D Data is divided into 100 sec bins |
 |
 |
| Parameter | Plot |
|---|---|
| CZT HV Monitor | 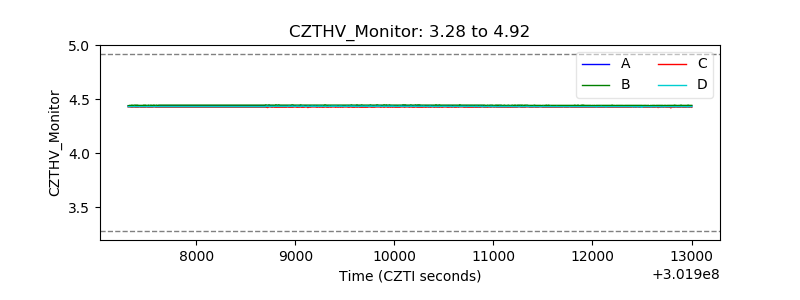 |
| D_VDD | 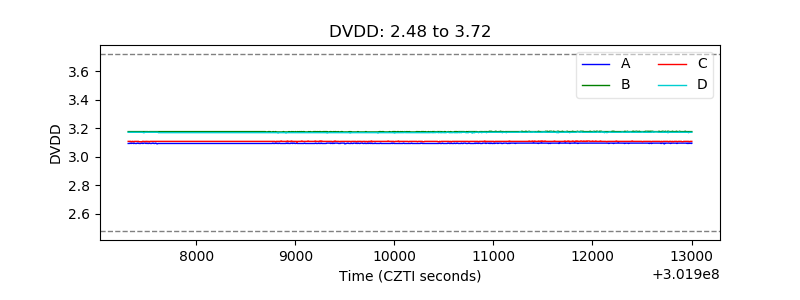 |
| Temperature 1 | 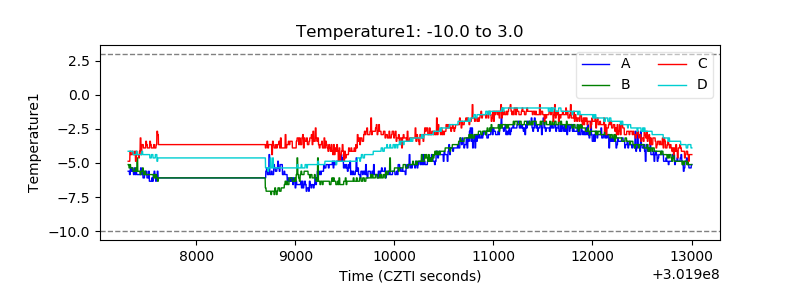 |
| Veto HV Monitor | 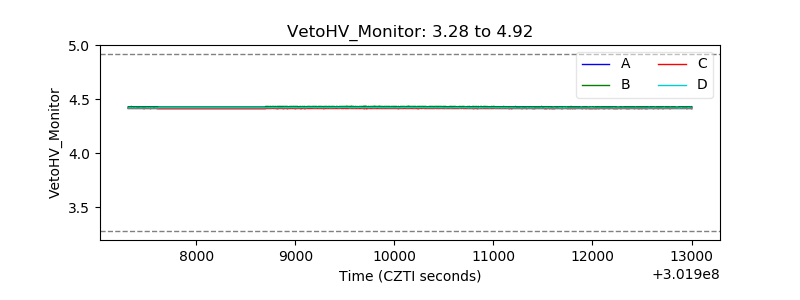 |
| Veto LLD |  |
| Alpha Counter | 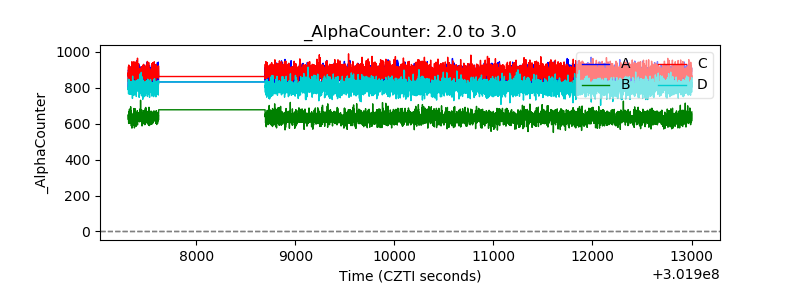 |
| _CPM_Rate | 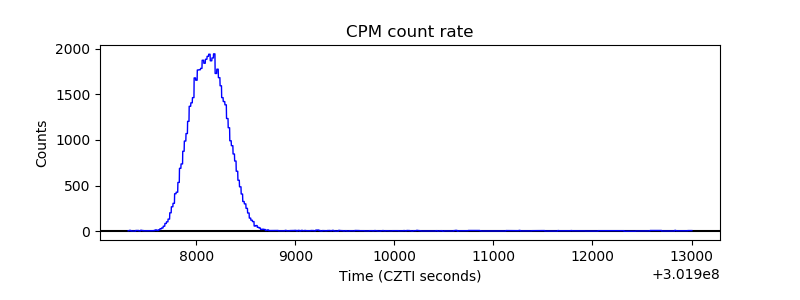 |
| CZT Counter | 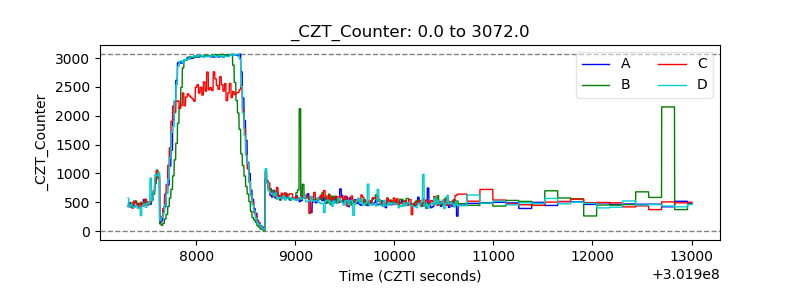 |
| +2.5 Volts monitor |  |
| +5 Volts monitor |  |
| _ROLL_ROT | 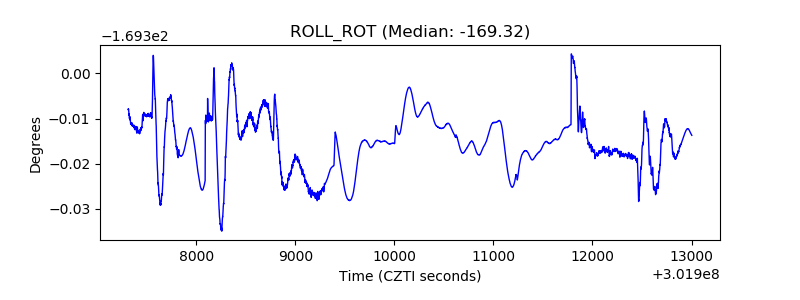 |
| _Roll_DEC | 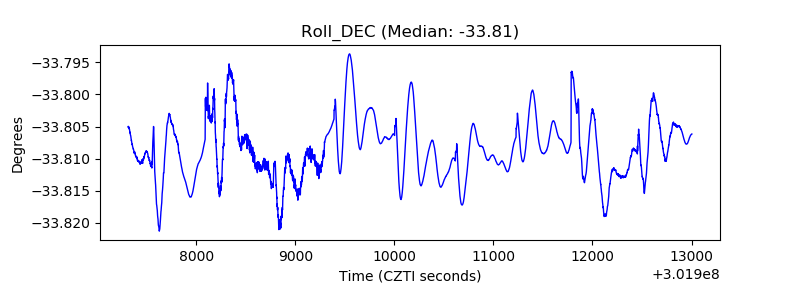 |
| _Roll_RA | 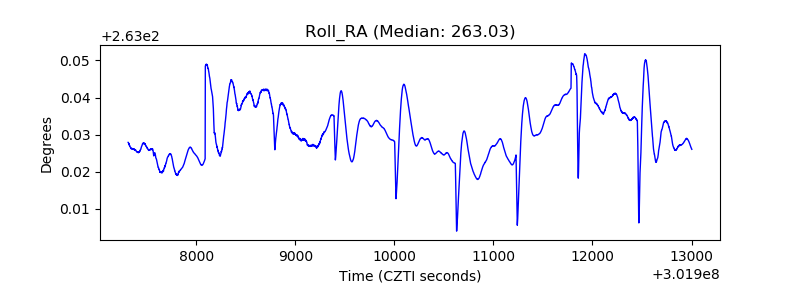 |
| Veto Counter |  |