| Param | Original file | Final file |
|---|---|---|
| Filename | modeM0/AS1A05_229T02_9000003060_20698cztM0_level2.evt | modeM0/AS1A05_229T02_9000003060_20698cztM0_level2_quad_clean.evt |
| Size (bytes) | 665,853,120 | 120,919,680 |
| Size | 635.0 MB | 115.3 MB |
| Events in quadrant A | 4,541,184 | 762,356 |
| Events in quadrant B | 5,179,426 | 764,043 |
| Events in quadrant C | 4,655,234 | 750,802 |
| Events in quadrant D | 5,147,852 | 728,265 |
| Mode M0 | |||
|---|---|---|---|
| Quadrant | BADHDUFLAG | Total packets | Discarded packets |
| A | 0 | 19351 | 2 |
| B | 0 | 21286 | 2 |
| C | 0 | 19589 | 2 |
| D | 0 | 21390 | 2 |
| Mode SS | |||
|---|---|---|---|
| Quadrant | BADHDUFLAG | Total packets | Discarded packets |
| A | 0 | 192 | 0 |
| B | 0 | 192 | 0 |
| C | 0 | 192 | 0 |
| D | 0 | 192 | 0 |
| Mode M9 | |||
|---|---|---|---|
| Quadrant | BADHDUFLAG | Total packets | Discarded packets |
| A | 0 | 11 | 0 |
| B | 0 | 11 | 0 |
| C | 0 | 11 | 0 |
| D | 0 | 11 | 0 |
| Quadrant | Total seconds | Saturated seconds | Saturation percentage |
|---|---|---|---|
| A | 9468 | 40 | 0.422476% |
| B | 9468 | 107 | 1.130123% |
| C | 9468 | 82 | 0.866075% |
| D | 9468 | 94 | 0.992818% |
Noise dominated data is calculated using 1-second bins in cleaned event files. If a bin has >2000 counts, and if more than 50% of those come from <1% of pixels, then it is considered to be noise-dominated and hence unusable.
| Quadrant | # 1 sec bins | Bins with >0 counts | Bins with >2000 counts | High rate bins dominated by noise | Noise dominated (total time) | Noise dominated (detector-on time) | Marked lightcurve |
|---|---|---|---|---|---|---|---|
| A | 10543 | 9469 | 0 | 0 | 0.00% | 0.00% | 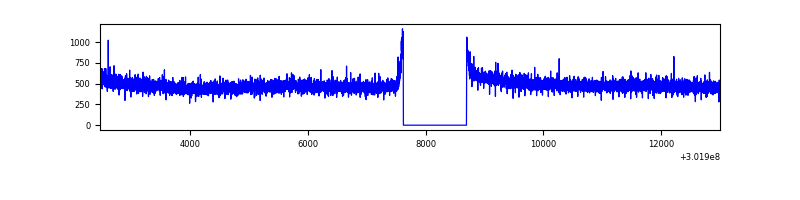 |
| B | 10543 | 9469 | 32 | 32 | 0.30% | 0.34% | 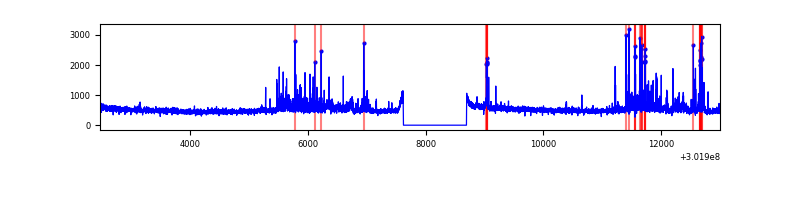 |
| C | 10543 | 9468 | 0 | 0 | 0.00% | 0.00% | 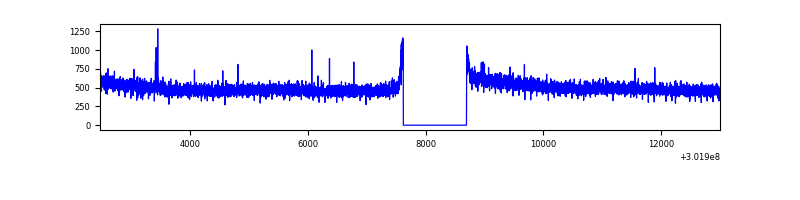 |
| D | 10543 | 9469 | 43 | 43 | 0.41% | 0.45% | 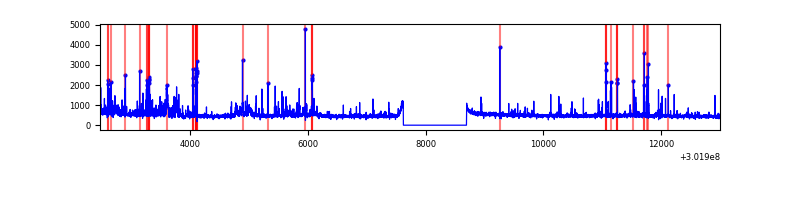 |
Top three noisy pixels from each quadrant. If the there are fewer than three noisy pixels in the level2.evt file, extra rows are filled as -1
| Pixel properties | Quadrant properties | ||||||
|---|---|---|---|---|---|---|---|
| Quadrant | DetID | PixID | Counts | Sigma | Mean | Median | Sigma |
| A | 0 | 226 | 10375 | 38.99 | 1182 | 1159 | 236.4 |
| A | 3 | 137 | 9392 | 34.83 | 1182 | 1159 | 236.4 |
| A | 12 | 194 | 8381 | 30.55 | 1182 | 1159 | 236.4 |
| B | 7 | 220 | 335734 | 1524.34 | 1175 | 1151 | 219.5 |
| B | 0 | 197 | 163106 | 737.86 | 1175 | 1151 | 219.5 |
| B | 3 | 64 | 41816 | 185.27 | 1175 | 1151 | 219.5 |
| C | 14 | 238 | 178157 | 674.66 | 1134 | 1142 | 262.4 |
| C | 7 | 247 | 43083 | 159.85 | 1134 | 1142 | 262.4 |
| C | 3 | 233 | 11163 | 38.19 | 1134 | 1142 | 262.4 |
| D | 1 | 52 | 413321 | 1506.98 | 1145 | 1118 | 273.5 |
| D | 5 | 222 | 179144 | 650.85 | 1145 | 1118 | 273.5 |
| D | 12 | 227 | 66328 | 238.4 | 1145 | 1118 | 273.5 |
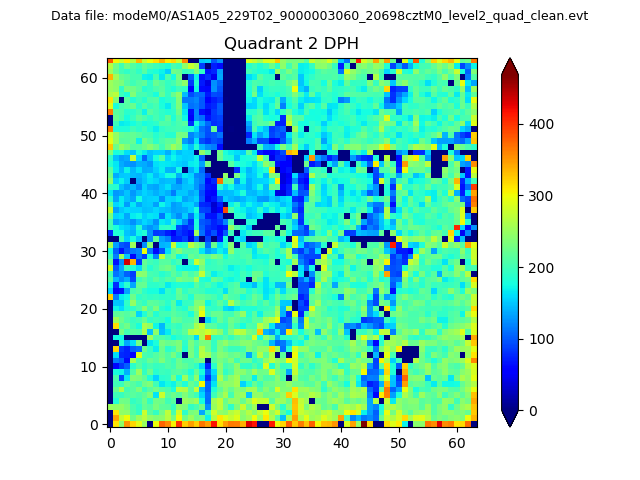
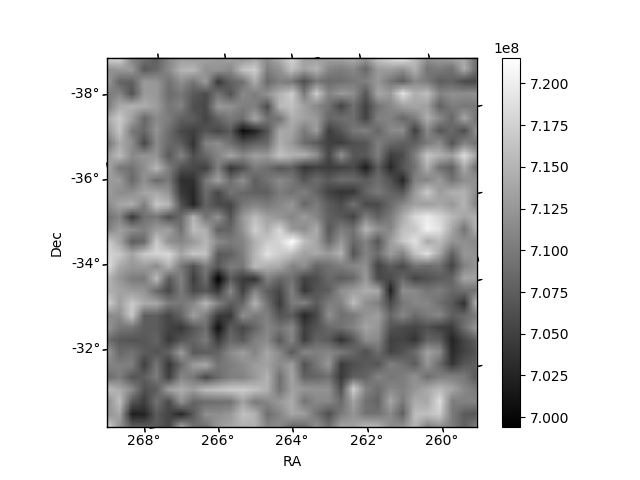
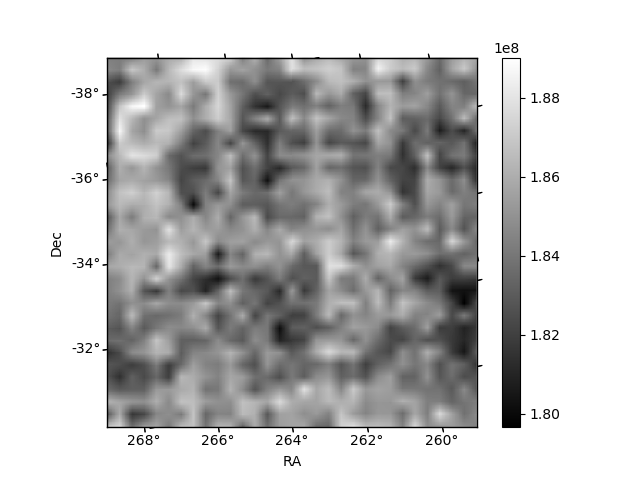
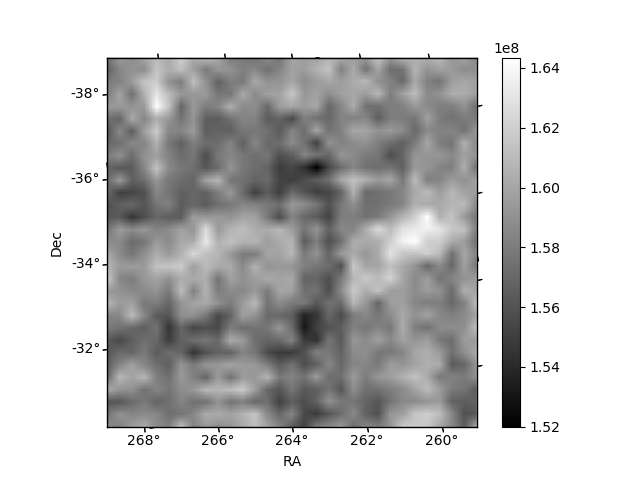
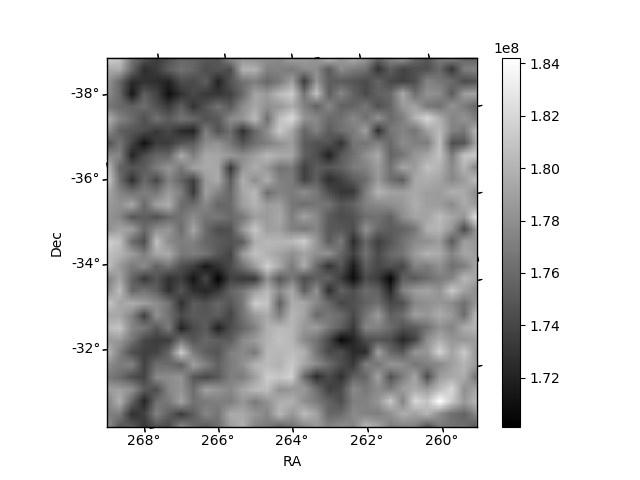
Histogram calculated using DETX and DETY for each event in the final _common_clean file
| Quadrant A | 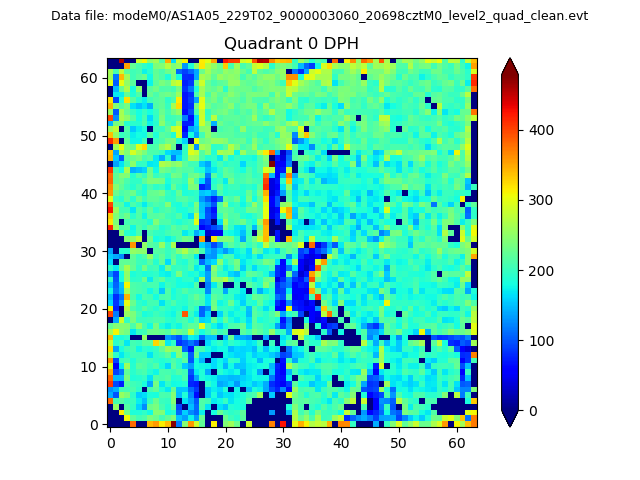 |
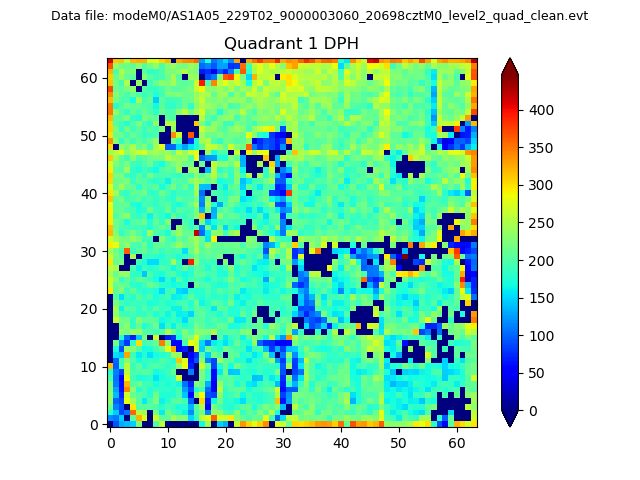 |
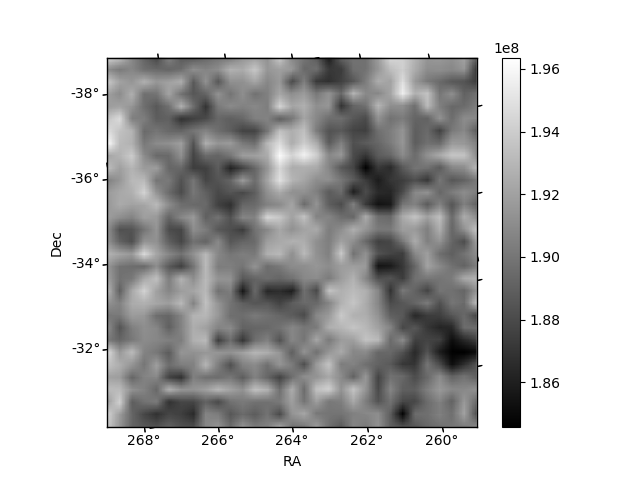
Quadrant B |
|---|---|---|---|
| Quadrant D | 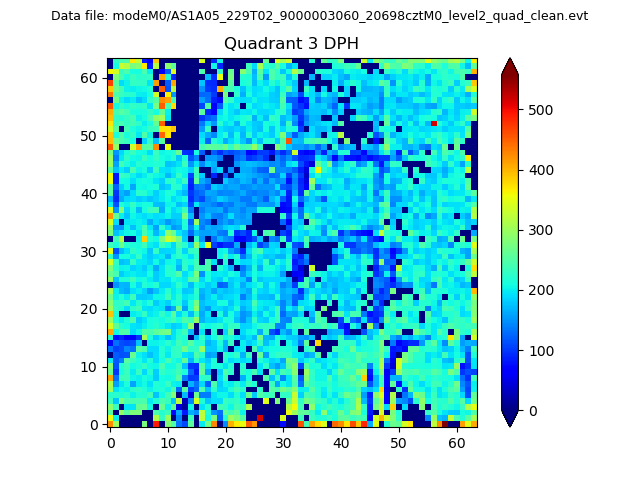 |
 |
Quadrant C |
| Plot type | Count rate plots | Images |
|---|---|---|
| Comparison with Poisson distribution Blue bars denote a histogram of data divided into 1 sec bins. Red curve is a Poisson curve with rate = median count rate of data. |
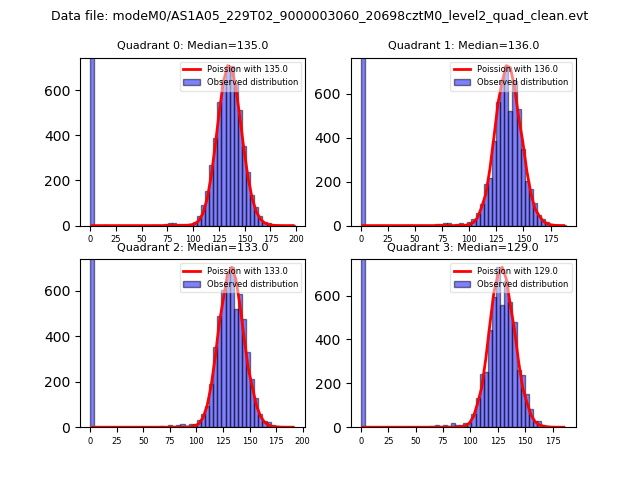 |
 |
| Quadrant-wise count rates Data is divided into 100 sec bins |
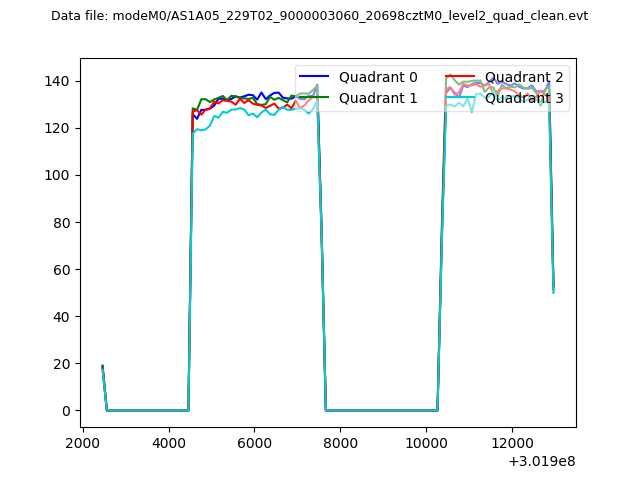 |
|
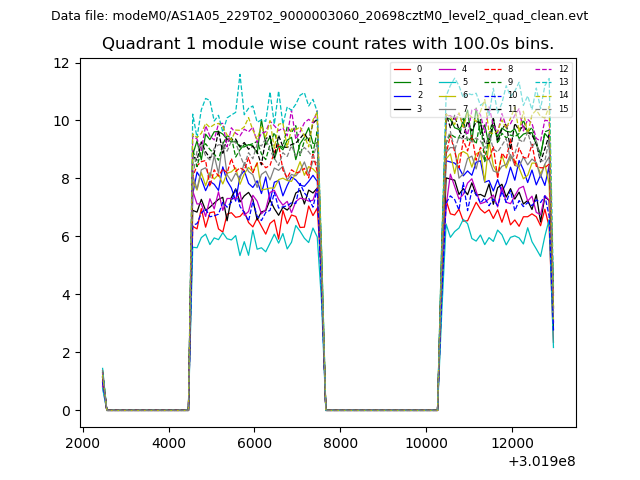
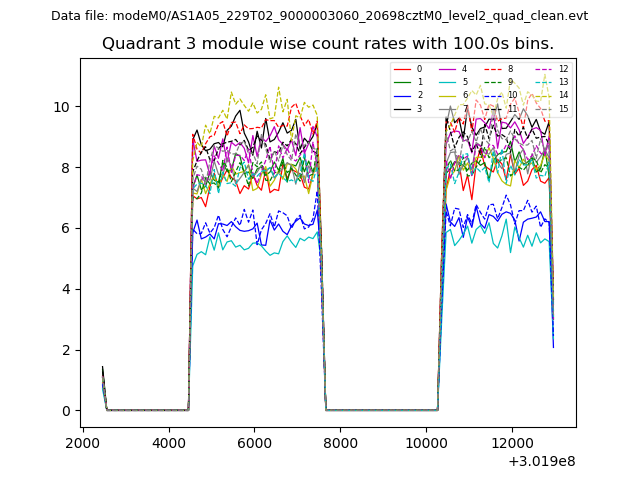
| Module-wise count rates for Quadrant A Data is divided into 100 sec bins |
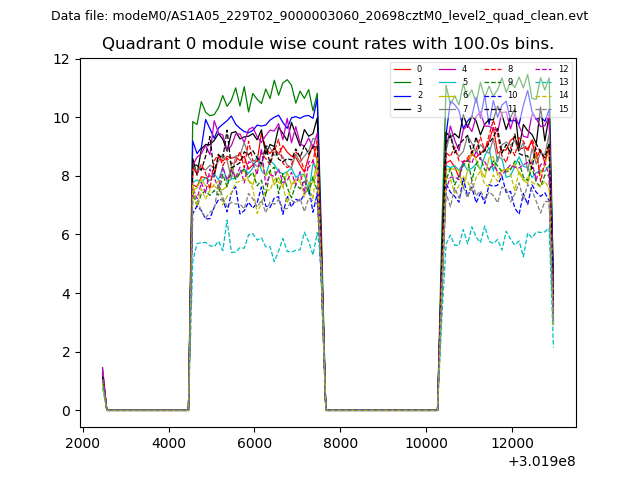 |
 |
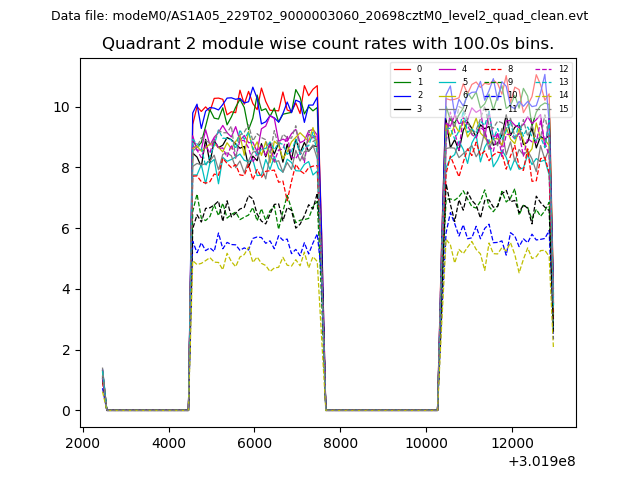
| Module-wise count rates for Quadrant B Data is divided into 100 sec bins |
 |
 |
| Module-wise count rates for Quadrant C Data is divided into 100 sec bins |
 |
 |
| Module-wise count rates for Quadrant D Data is divided into 100 sec bins |
 |
 |
| Parameter | Plot |
|---|---|
| CZT HV Monitor |  |
| D_VDD | 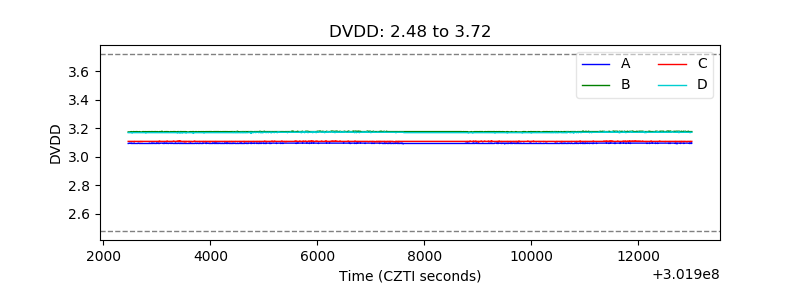 |
| Temperature 1 | 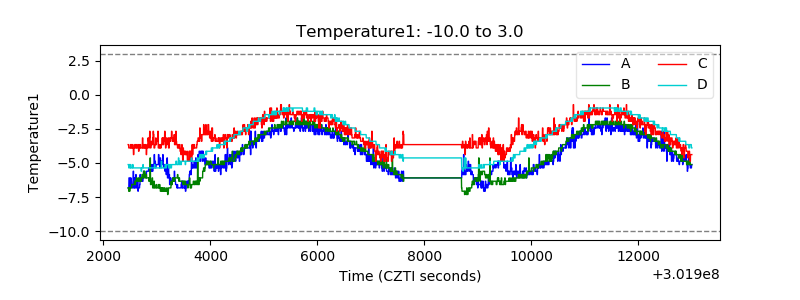 |
| Veto HV Monitor | 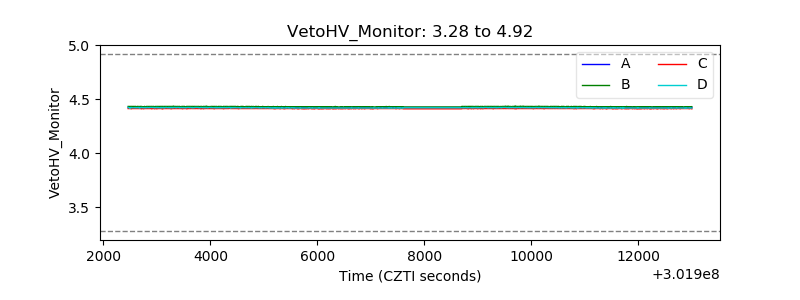 |
| Veto LLD |  |
| Alpha Counter | 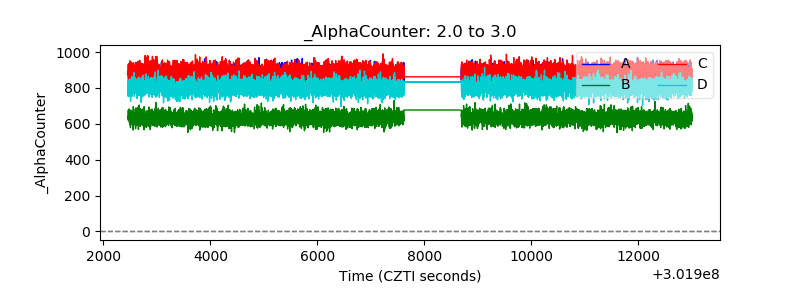 |
| _CPM_Rate | 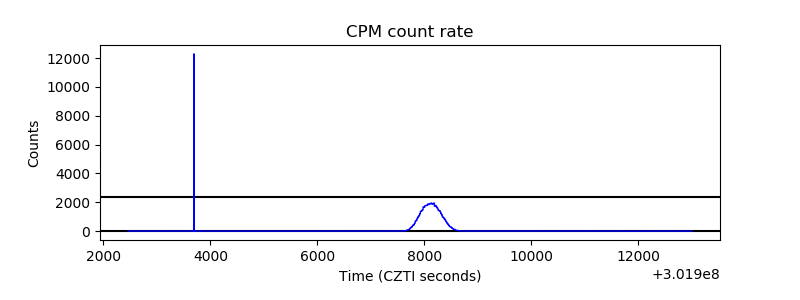 |
| CZT Counter | 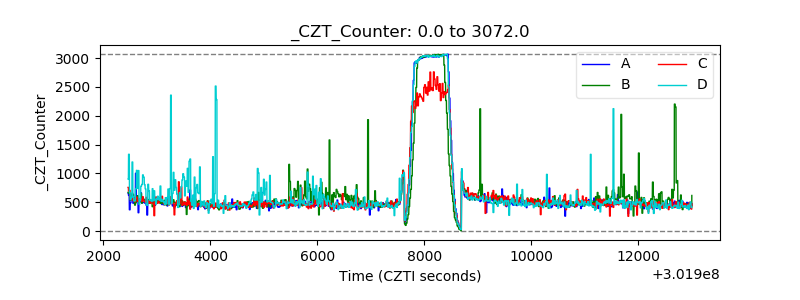 |
| +2.5 Volts monitor |  |
| +5 Volts monitor |  |
| _ROLL_ROT |  |
| _Roll_DEC | 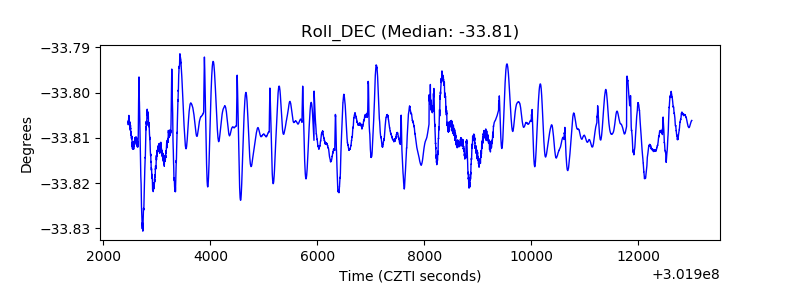 |
| _Roll_RA | 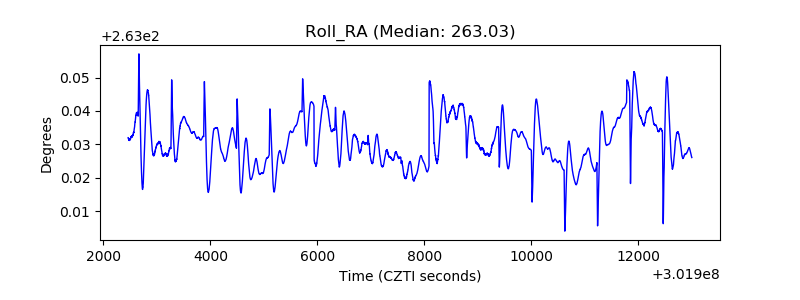 |
| Veto Counter | 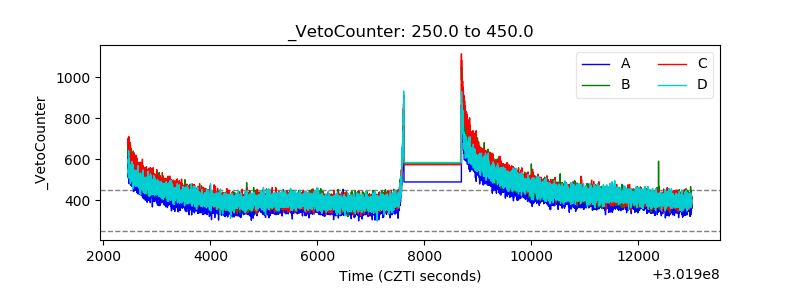 |