| Param | Original file | Final file |
|---|---|---|
| Filename | modeM0/AS1A05_229T02_9000003060_20866cztM0_level2.evt | modeM0/AS1A05_229T02_9000003060_20866cztM0_level2_quad_clean.evt |
| Size (bytes) | 1,775,439,360 | 204,408,000 |
| Size | 1.7 GB | 194.9 MB |
| Events in quadrant A | 7,540,294 | 1,384,958 |
| Events in quadrant B | 7,933,341 | 1,412,337 |
| Events in quadrant C | 7,719,637 | 1,336,132 |
| Events in quadrant D | 29,483,464 | 937,341 |
| Mode M0 | |||
|---|---|---|---|
| Quadrant | BADHDUFLAG | Total packets | Discarded packets |
| A | 0 | 37009 | 3691 |
| B | 0 | 37860 | 3821 |
| C | 0 | 37216 | 3762 |
| D | 0 | 113439 | 15153 |
| Mode SS | |||
|---|---|---|---|
| Quadrant | BADHDUFLAG | Total packets | Discarded packets |
| A | 0 | 371 | 39 |
| B | 0 | 374 | 42 |
| C | 0 | 372 | 26 |
| D | 0 | 371 | 35 |
| Mode M9 | |||
|---|---|---|---|
| Quadrant | BADHDUFLAG | Total packets | Discarded packets |
| A | 0 | 19 | 1 |
| B | 0 | 18 | 0 |
| C | 0 | 18 | 0 |
| D | 0 | 19 | 1 |
| Quadrant | Total seconds | Saturated seconds | Saturation percentage |
|---|---|---|---|
| A | 16335 | 79 | 0.483624% |
| B | 16330 | 126 | 0.771586% |
| C | 16328 | 166 | 1.016659% |
| D | 15699 | 8550 | 54.462068% |
Noise dominated data is calculated using 1-second bins in cleaned event files. If a bin has >2000 counts, and if more than 50% of those come from <1% of pixels, then it is considered to be noise-dominated and hence unusable.
| Quadrant | # 1 sec bins | Bins with >0 counts | Bins with >2000 counts | High rate bins dominated by noise | Noise dominated (total time) | Noise dominated (detector-on time) | Marked lightcurve |
|---|---|---|---|---|---|---|---|
| A | 19424 | 16927 | 0 | 0 | 0.00% | 0.00% | 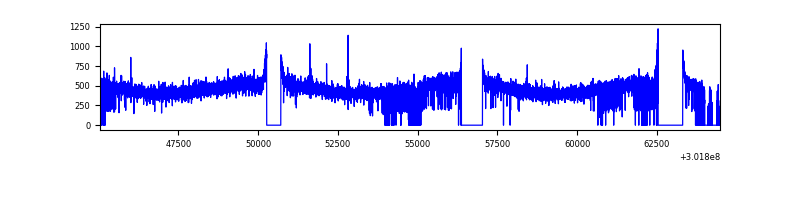 |
| B | 19432 | 16882 | 13 | 13 | 0.07% | 0.08% |  |
| C | 19415 | 16865 | 0 | 0 | 0.00% | 0.00% | 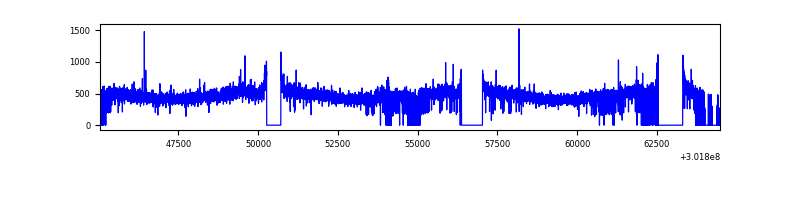 |
| D | 19393 | 16306 | 7843 | 7843 | 40.44% | 48.10% | 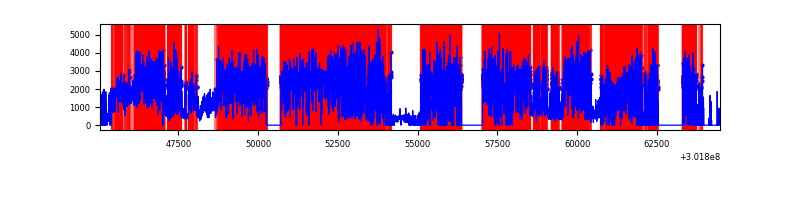 |
Top three noisy pixels from each quadrant. If the there are fewer than three noisy pixels in the level2.evt file, extra rows are filled as -1
| Pixel properties | Quadrant properties | ||||||
|---|---|---|---|---|---|---|---|
| Quadrant | DetID | PixID | Counts | Sigma | Mean | Median | Sigma |
| A | 0 | 226 | 16751 | 37.67 | 1959 | 1920 | 393.7 |
| A | 3 | 137 | 16478 | 36.98 | 1959 | 1920 | 393.7 |
| A | 12 | 194 | 13629 | 29.74 | 1959 | 1920 | 393.7 |
| B | 0 | 189 | 111654 | 295.06 | 1958 | 1912 | 371.9 |
| B | 12 | 111 | 46905 | 120.97 | 1958 | 1912 | 371.9 |
| B | 11 | 111 | 41447 | 106.3 | 1958 | 1912 | 371.9 |
| C | 14 | 238 | 293669 | 667.28 | 1874 | 1887 | 437.3 |
| C | 3 | 233 | 79648 | 177.83 | 1874 | 1887 | 437.3 |
| C | 9 | 54 | 23247 | 48.85 | 1874 | 1887 | 437.3 |
| D | 1 | 52 | 21912246 | 68702.02 | 1328 | 1293 | 318.9 |
| D | 1 | 239 | 1840616 | 5767.22 | 1328 | 1293 | 318.9 |
| D | 7 | 223 | 294021 | 917.85 | 1328 | 1293 | 318.9 |
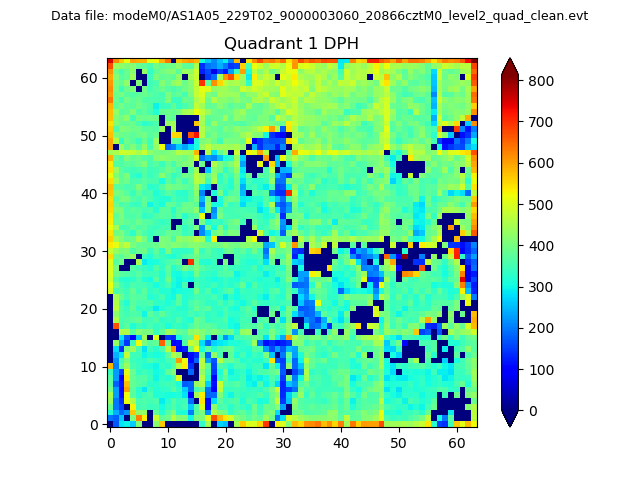
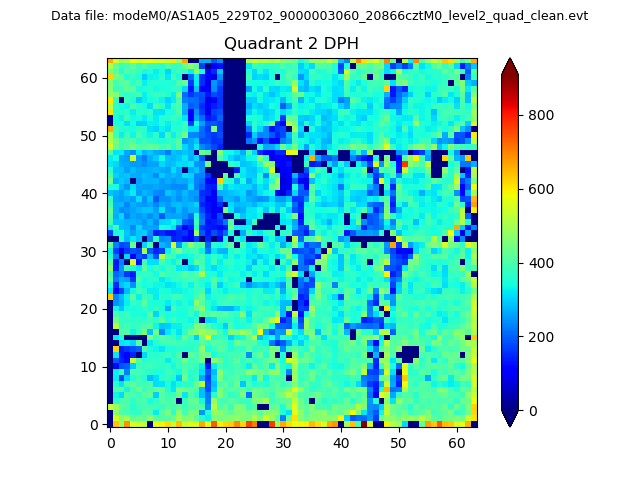
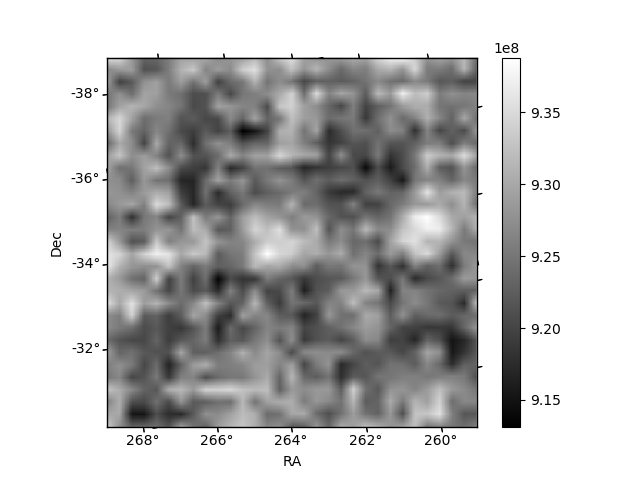
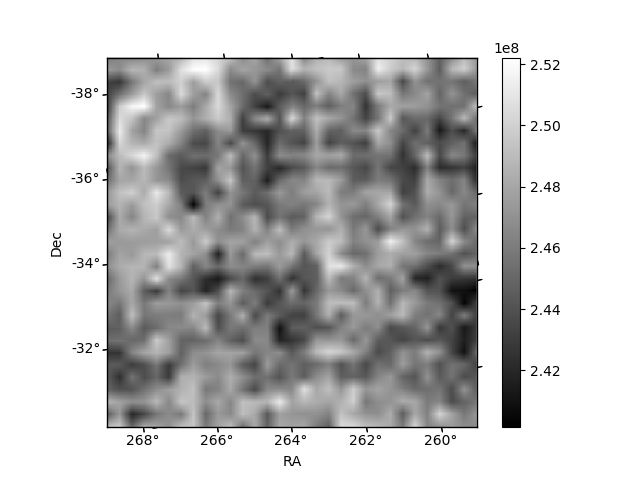
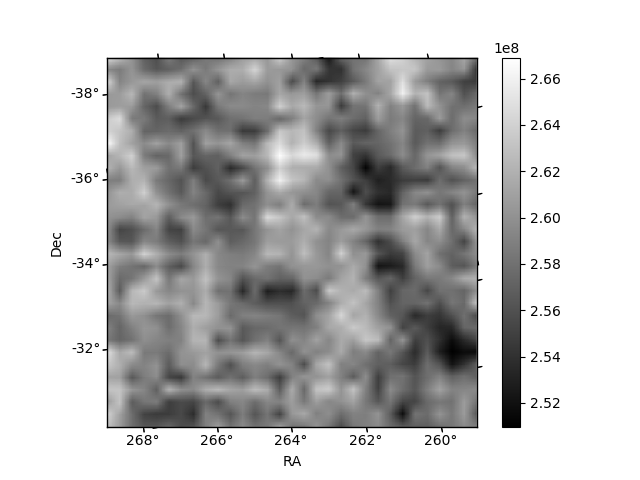
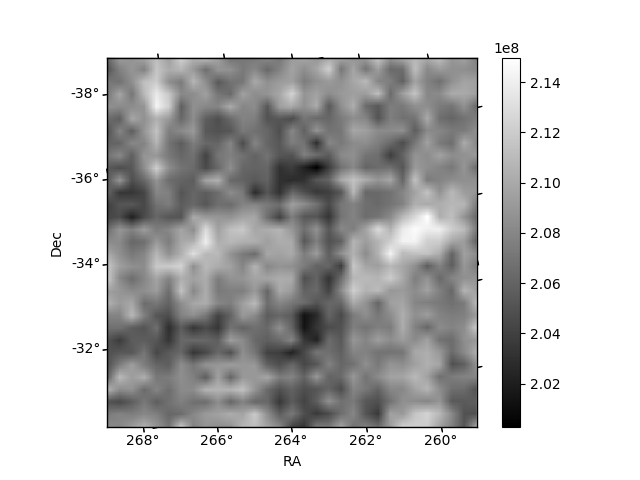
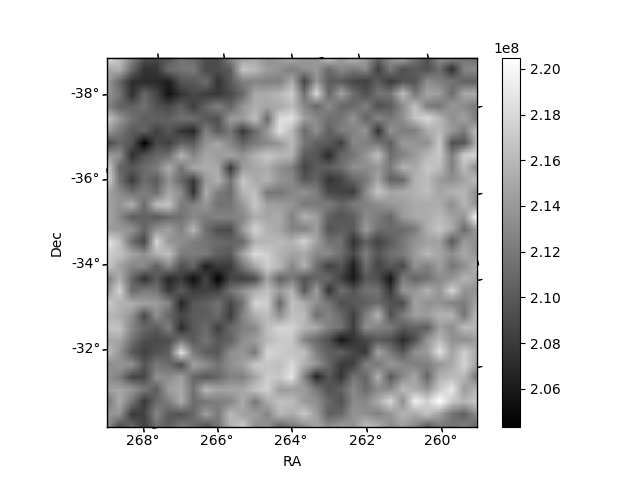
Histogram calculated using DETX and DETY for each event in the final _common_clean file
| Quadrant A | 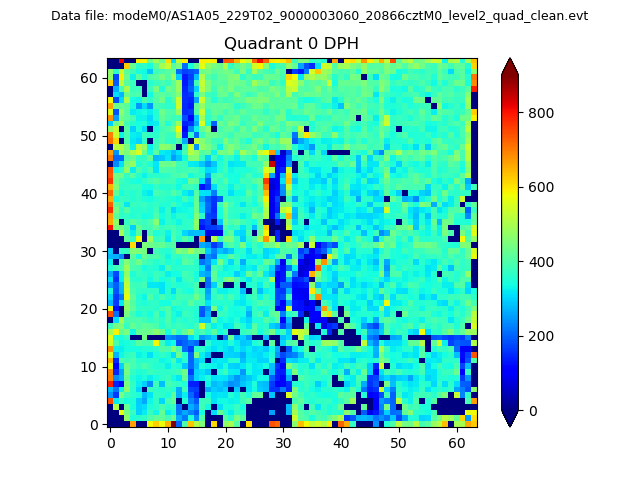 |
 |
Quadrant B |
|---|---|---|---|
| Quadrant D | 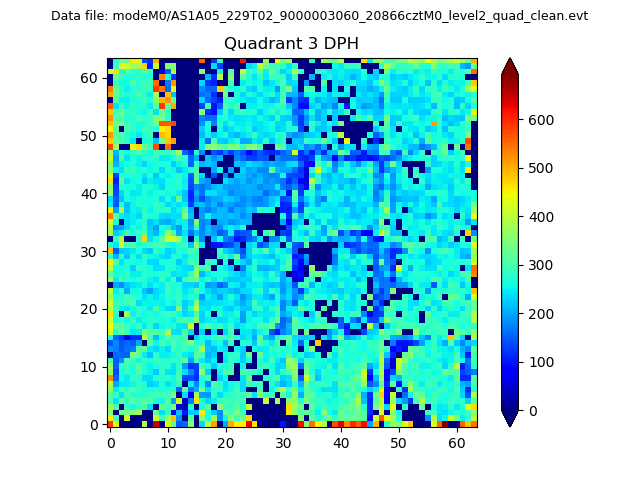 |
 |
Quadrant C |
| Plot type | Count rate plots | Images |
|---|---|---|
| Comparison with Poisson distribution Blue bars denote a histogram of data divided into 1 sec bins. Red curve is a Poisson curve with rate = median count rate of data. |
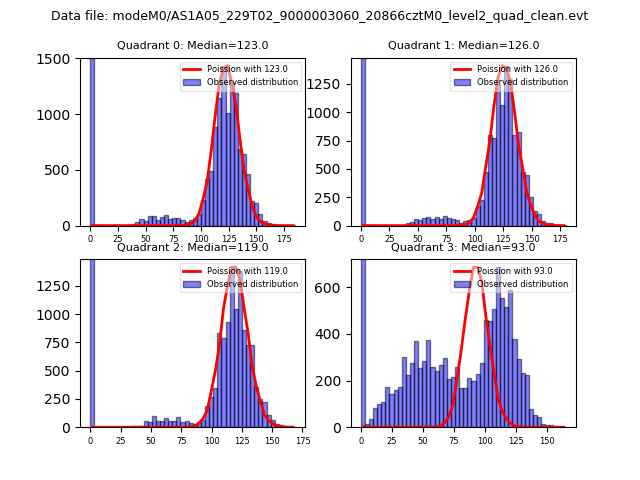 |
 |
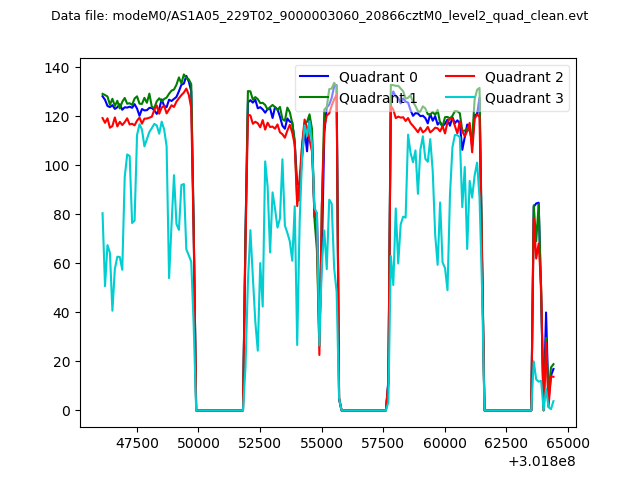
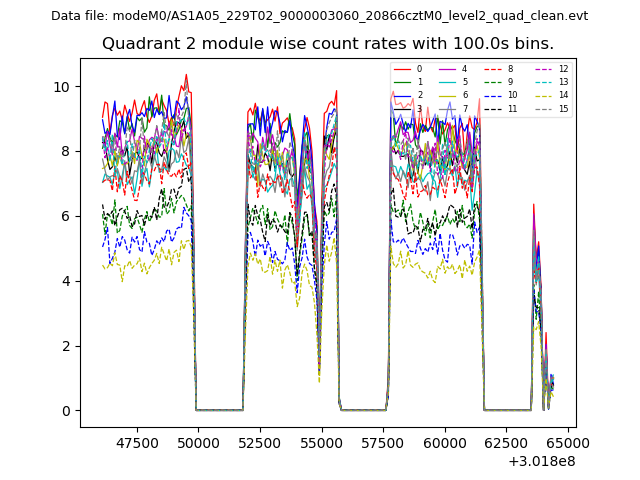
| Quadrant-wise count rates Data is divided into 100 sec bins |
 |
|
| Module-wise count rates for Quadrant A Data is divided into 100 sec bins |
 |
 |
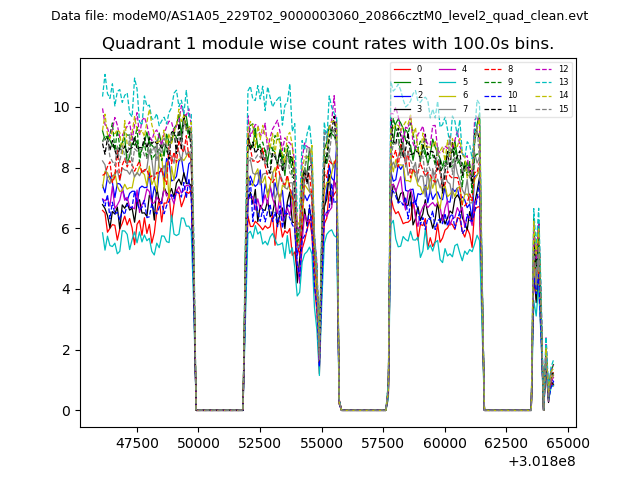
| Module-wise count rates for Quadrant B Data is divided into 100 sec bins |
 |
 |
| Module-wise count rates for Quadrant C Data is divided into 100 sec bins |
 |
 |
| Module-wise count rates for Quadrant D Data is divided into 100 sec bins |
 |
 |
| Parameter | Plot |
|---|---|
| CZT HV Monitor | 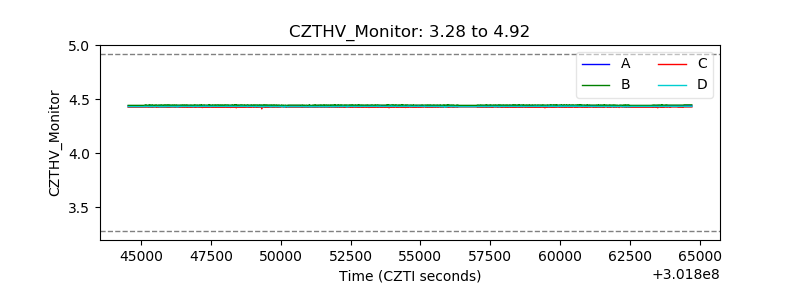 |
| D_VDD | 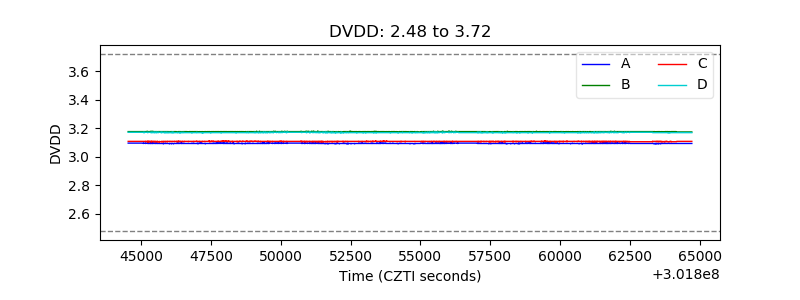 |
| Temperature 1 | 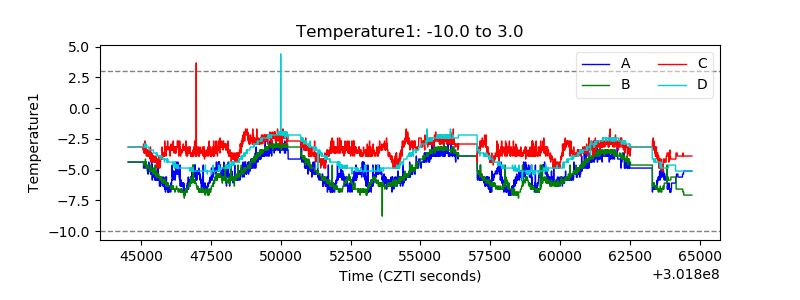 |
| Veto HV Monitor | 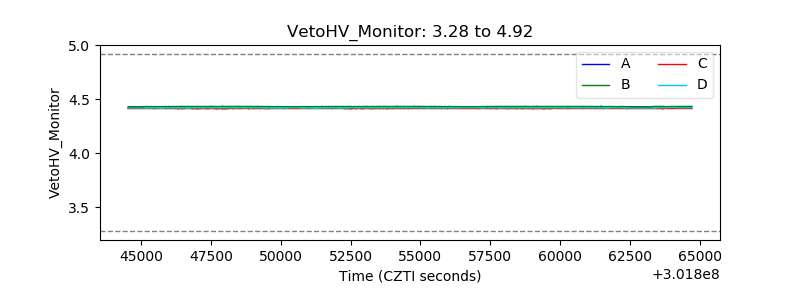 |
| Veto LLD | 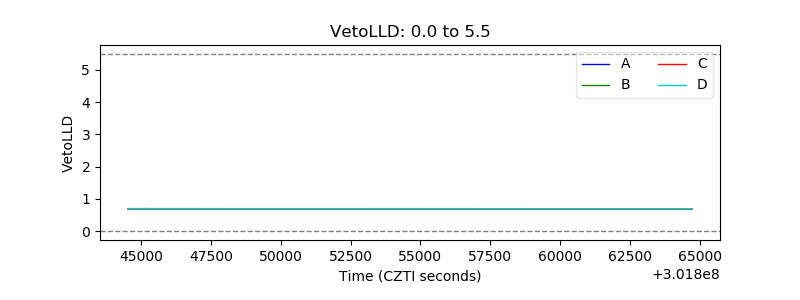 |
| Alpha Counter | 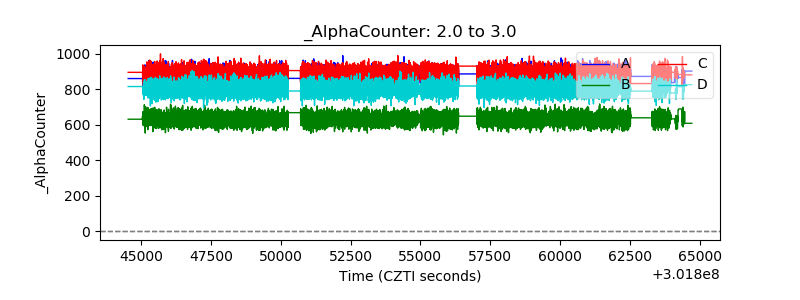 |
| _CPM_Rate | 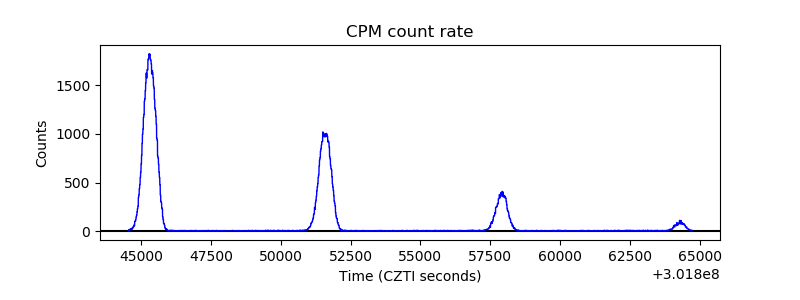 |
| CZT Counter | 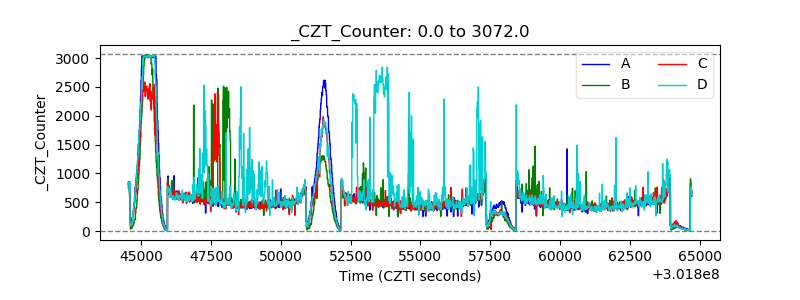 |
| +2.5 Volts monitor |  |
| +5 Volts monitor |  |
| _ROLL_ROT |  |
| _Roll_DEC |  |
| _Roll_RA | 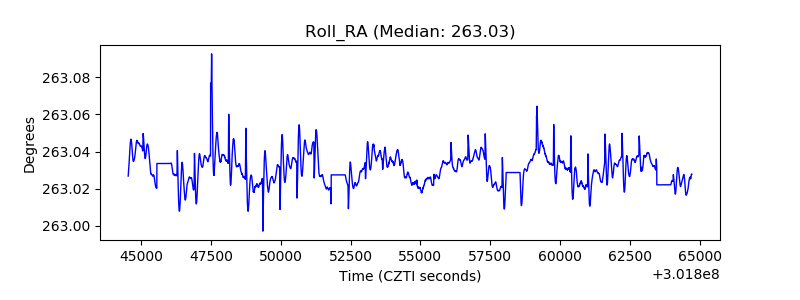 |
| Veto Counter |  |