| Param | Original file | Final file |
|---|---|---|
| Filename | modeM0/AS1A05_165T07_9000003062_20697cztM0_level2.evt | modeM0/AS1A05_165T07_9000003062_20697cztM0_level2_quad_clean.evt |
| Size (bytes) | 547,364,160 | 123,845,760 |
| Size | 522.0 MB | 118.1 MB |
| Events in quadrant A | 3,368,748 | 863,570 |
| Events in quadrant B | 3,750,901 | 851,995 |
| Events in quadrant C | 3,328,589 | 809,453 |
| Events in quadrant D | 5,699,811 | 784,313 |
| Mode SS | |||
|---|---|---|---|
| Quadrant | BADHDUFLAG | Total packets | Discarded packets |
| A | 0 | 128 | 0 |
| B | 0 | 128 | 0 |
| C | 0 | 128 | 0 |
| D | 0 | 128 | 0 |
| Mode M0 | |||
|---|---|---|---|
| Quadrant | BADHDUFLAG | Total packets | Discarded packets |
| A | 0 | 14064 | 1 |
| B | 0 | 15256 | 1 |
| C | 0 | 13997 | 2 |
| D | 0 | 21291 | 1 |
| Mode M9 | |||
|---|---|---|---|
| Quadrant | BADHDUFLAG | Total packets | Discarded packets |
| A | 0 | 13 | 0 |
| B | 0 | 13 | 0 |
| C | 0 | 13 | 0 |
| D | 0 | 13 | 0 |
| Quadrant | Total seconds | Saturated seconds | Saturation percentage |
|---|---|---|---|
| A | 6331 | 75 | 1.184647% |
| B | 6332 | 145 | 2.289956% |
| C | 6331 | 119 | 1.879640% |
| D | 6331 | 455 | 7.186858% |
Noise dominated data is calculated using 1-second bins in cleaned event files. If a bin has >2000 counts, and if more than 50% of those come from <1% of pixels, then it is considered to be noise-dominated and hence unusable.
| Quadrant | # 1 sec bins | Bins with >0 counts | Bins with >2000 counts | High rate bins dominated by noise | Noise dominated (total time) | Noise dominated (detector-on time) | Marked lightcurve |
|---|---|---|---|---|---|---|---|
| A | 7591 | 6332 | 1 | 1 | 0.01% | 0.02% | 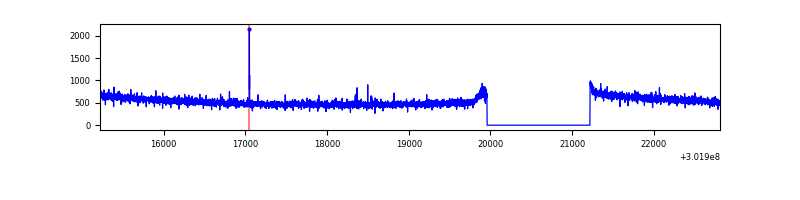 |
| B | 7592 | 6333 | 40 | 40 | 0.53% | 0.63% | 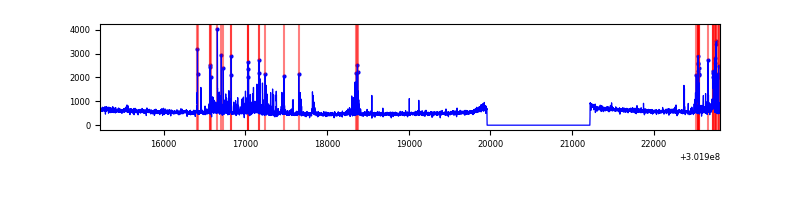 |
| C | 7591 | 6332 | 0 | 0 | 0.00% | 0.00% |  |
| D | 7591 | 6331 | 390 | 390 | 5.14% | 6.16% |  |
Top three noisy pixels from each quadrant. If the there are fewer than three noisy pixels in the level2.evt file, extra rows are filled as -1
| Pixel properties | Quadrant properties | ||||||
|---|---|---|---|---|---|---|---|
| Quadrant | DetID | PixID | Counts | Sigma | Mean | Median | Sigma |
| A | 0 | 226 | 7896 | 40.2 | 874 | 858 | 175.1 |
| A | 5 | 16 | 7560 | 38.28 | 874 | 858 | 175.1 |
| A | 3 | 137 | 6460 | 32.0 | 874 | 858 | 175.1 |
| B | 7 | 220 | 328703 | 2072.0 | 848 | 832 | 158.2 |
| B | 0 | 190 | 38831 | 240.14 | 848 | 832 | 158.2 |
| B | 0 | 229 | 22278 | 135.53 | 848 | 832 | 158.2 |
| C | 14 | 238 | 130655 | 696.6 | 816 | 824 | 186.4 |
| C | 7 | 247 | 12778 | 64.14 | 816 | 824 | 186.4 |
| C | 13 | 61 | 5811 | 26.76 | 816 | 824 | 186.4 |
| D | 5 | 222 | 2143708 | 10831.47 | 830 | 806 | 197.8 |
| D | 7 | 38 | 144647 | 727.06 | 830 | 806 | 197.8 |
| D | 1 | 52 | 67103 | 335.1 | 830 | 806 | 197.8 |
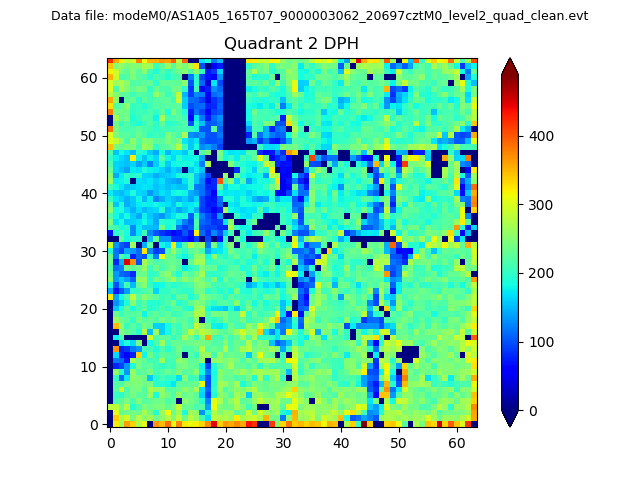
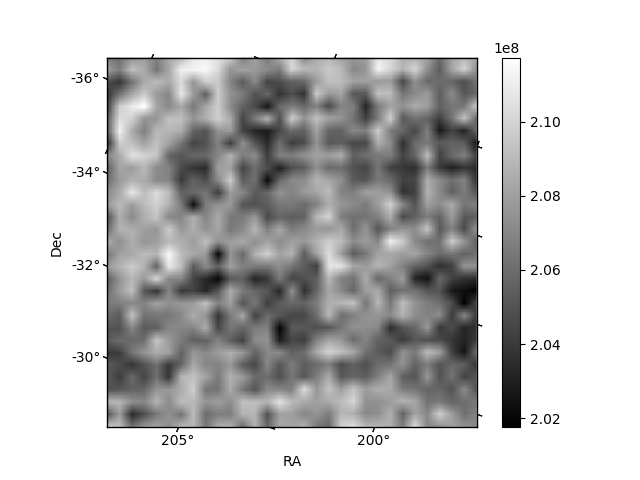
Histogram calculated using DETX and DETY for each event in the final _common_clean file
| Quadrant A | 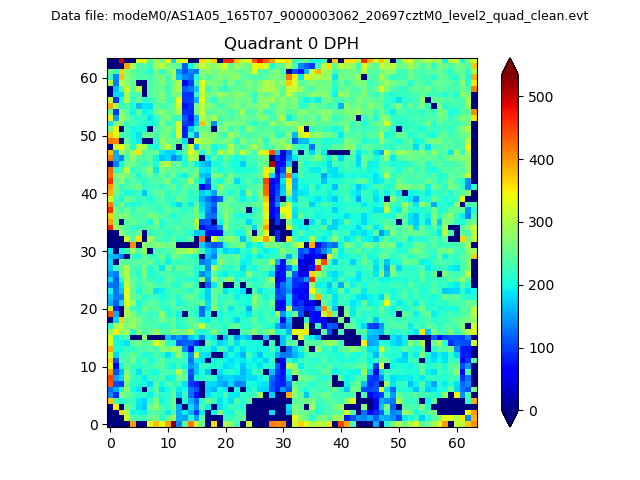 |
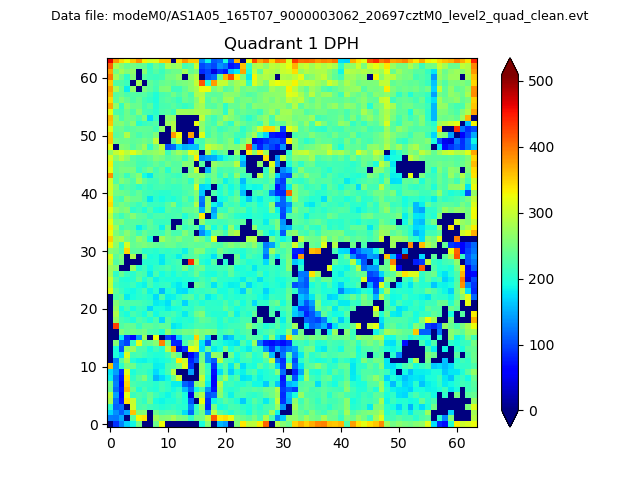 |
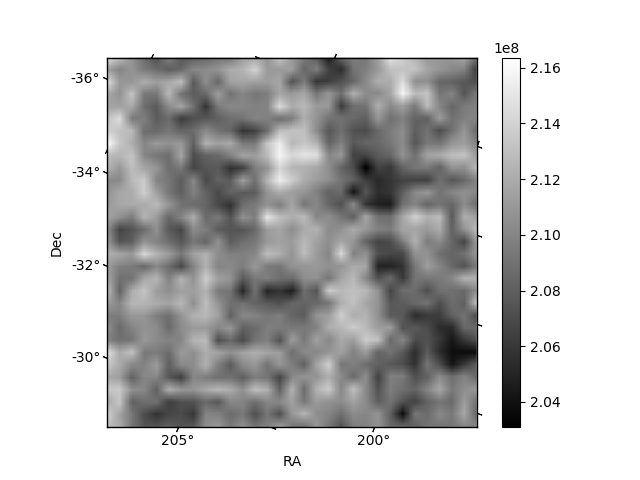
Quadrant B |
|---|---|---|---|
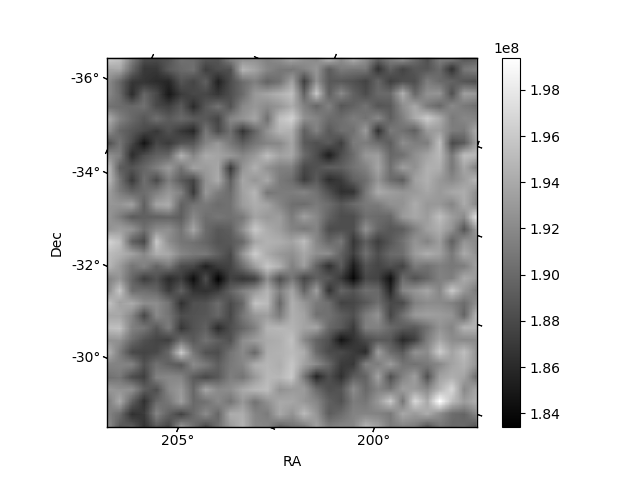
| Quadrant D | 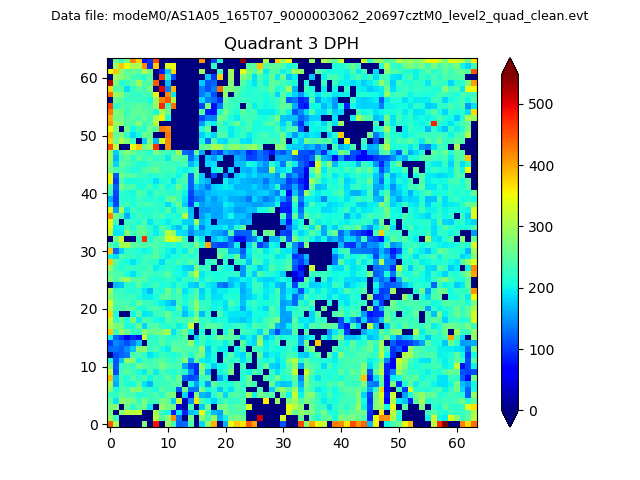 |
 |
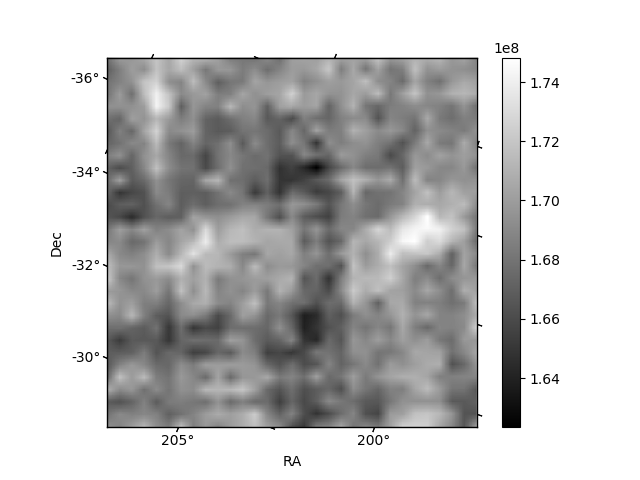
Quadrant C |
| Plot type | Count rate plots | Images |
|---|---|---|
| Comparison with Poisson distribution Blue bars denote a histogram of data divided into 1 sec bins. Red curve is a Poisson curve with rate = median count rate of data. |
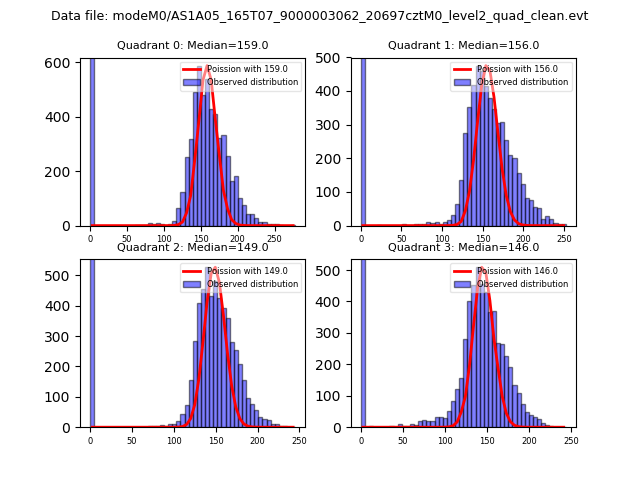 |
 |
| Quadrant-wise count rates Data is divided into 100 sec bins |
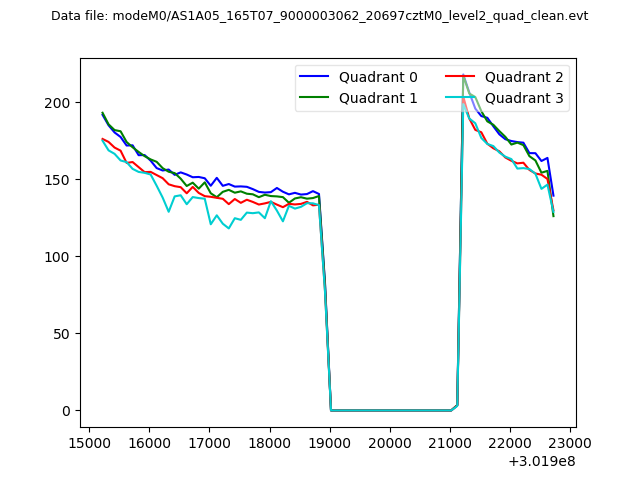 |
|
| Module-wise count rates for Quadrant A Data is divided into 100 sec bins |
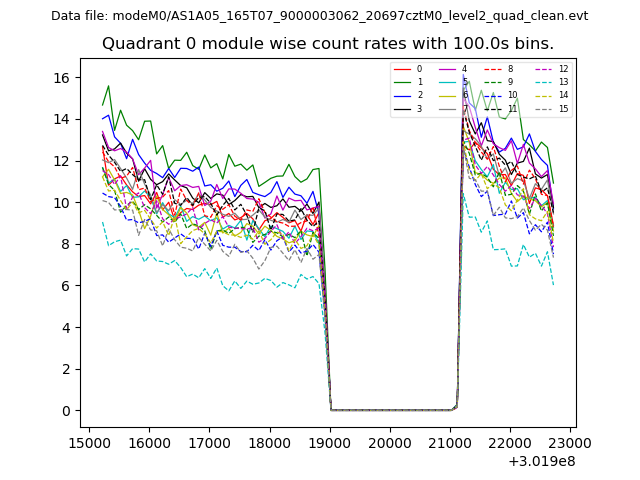 |
 |
| Module-wise count rates for Quadrant B Data is divided into 100 sec bins |
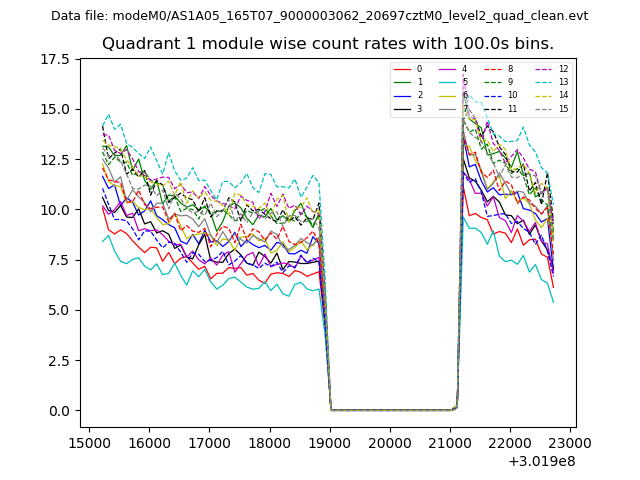 |
 |
| Module-wise count rates for Quadrant C Data is divided into 100 sec bins |
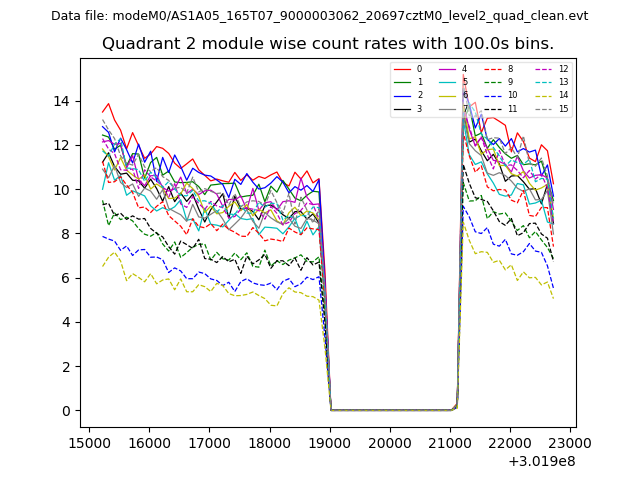 |
 |
| Module-wise count rates for Quadrant D Data is divided into 100 sec bins |
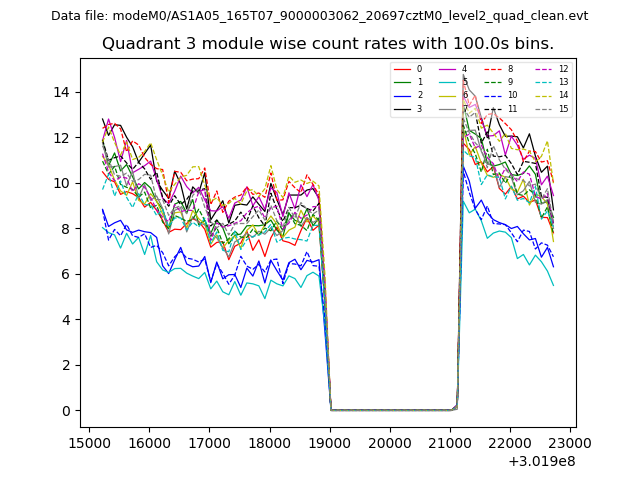 |
 |
| Parameter | Plot |
|---|---|
| CZT HV Monitor | 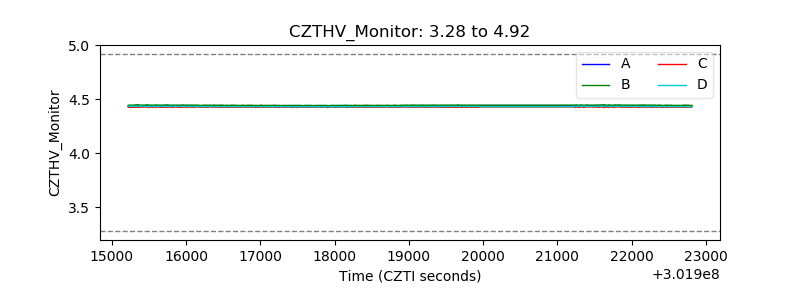 |
| D_VDD | 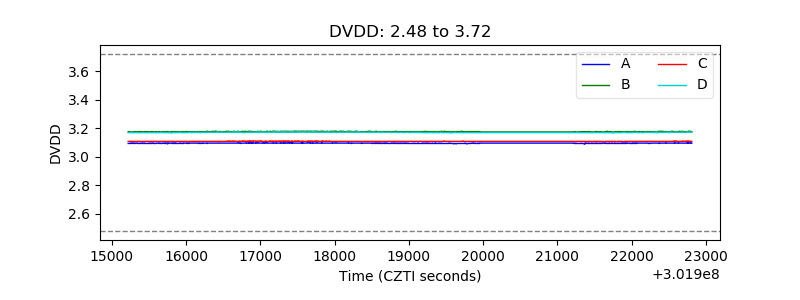 |
| Temperature 1 | 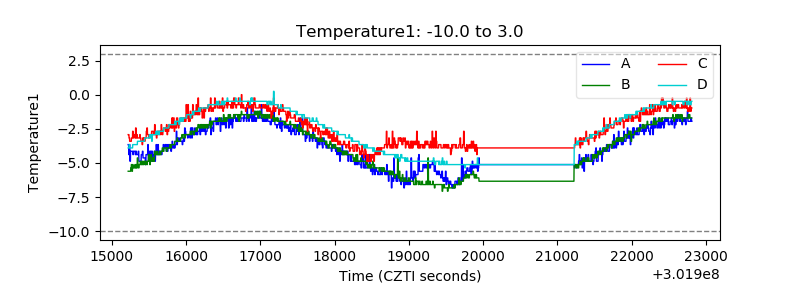 |
| Veto HV Monitor | 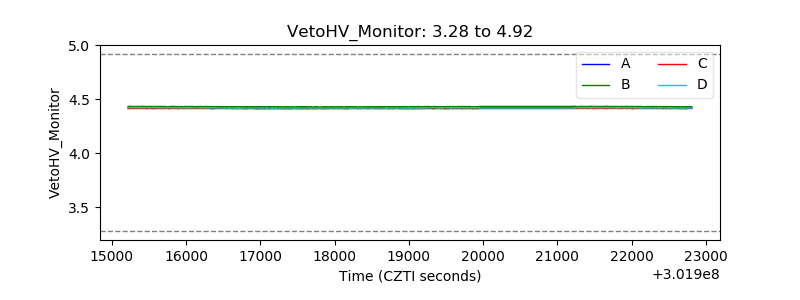 |
| Veto LLD | 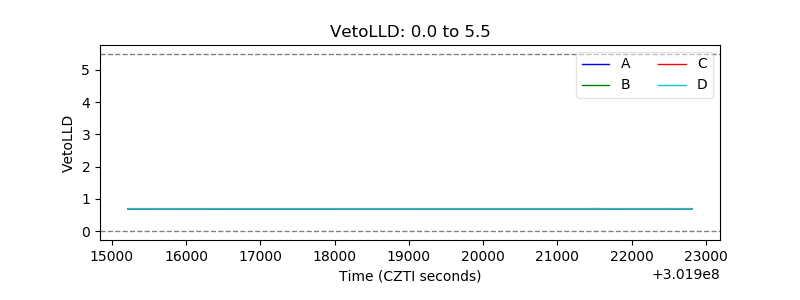 |
| Alpha Counter | 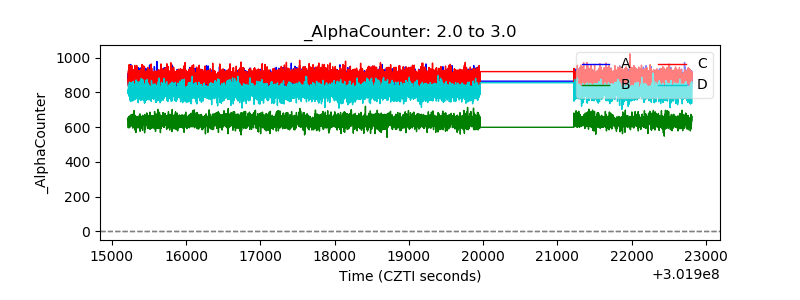 |
| _CPM_Rate | 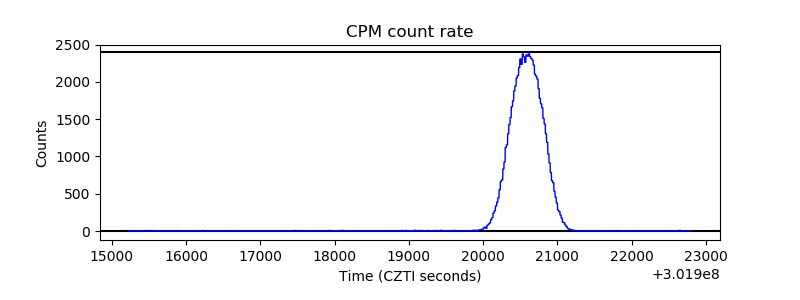 |
| CZT Counter |  |
| +2.5 Volts monitor |  |
| +5 Volts monitor | 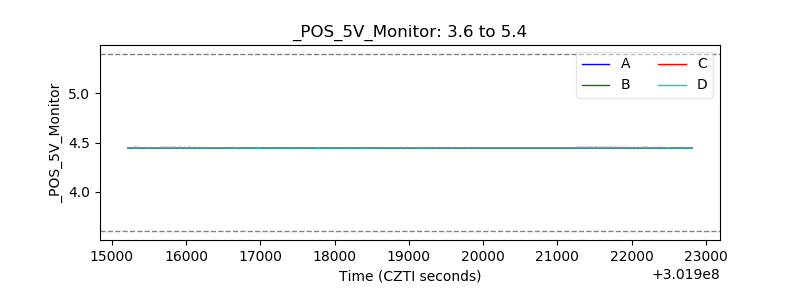 |
| _ROLL_ROT | 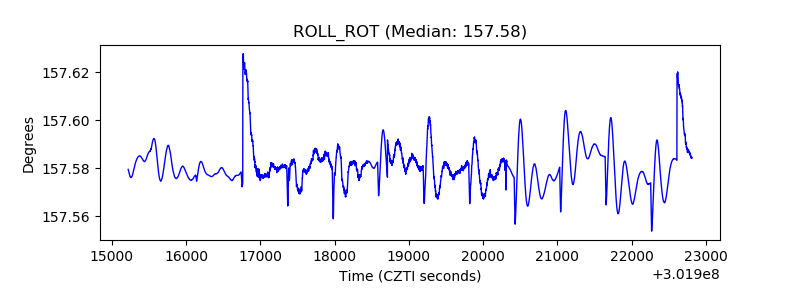 |
| _Roll_DEC | 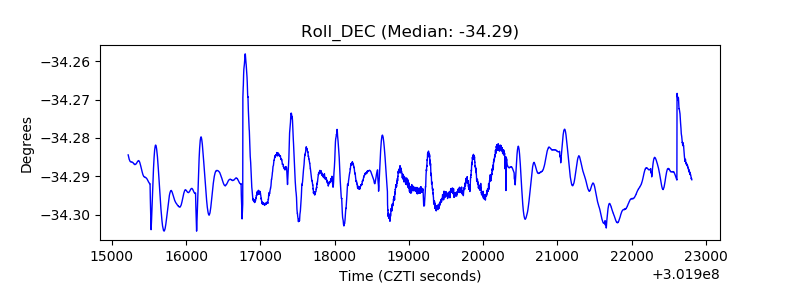 |
| _Roll_RA |  |
| Veto Counter | 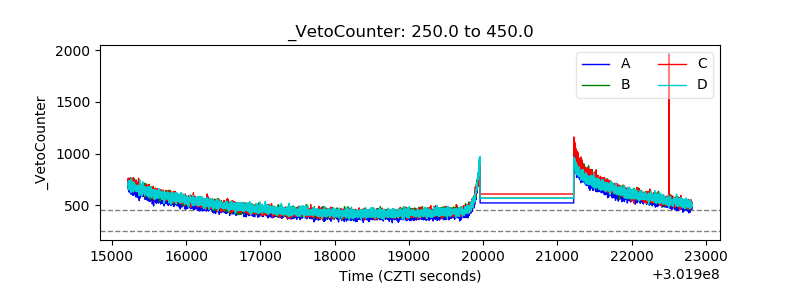 |