| Param | Original file | Final file |
|---|---|---|
| Filename | modeM0/AS1A05_165T07_9000003062_20698cztM0_level2.evt | modeM0/AS1A05_165T07_9000003062_20698cztM0_level2_quad_clean.evt |
| Size (bytes) | 965,090,880 | 209,329,920 |
| Size | 920.4 MB | 199.6 MB |
| Events in quadrant A | 6,218,425 | 1,447,098 |
| Events in quadrant B | 6,824,534 | 1,414,860 |
| Events in quadrant C | 6,118,970 | 1,347,792 |
| Events in quadrant D | 9,277,996 | 1,323,845 |
| Mode SS | |||
|---|---|---|---|
| Quadrant | BADHDUFLAG | Total packets | Discarded packets |
| A | 0 | 238 | 0 |
| B | 0 | 238 | 0 |
| C | 0 | 238 | 0 |
| D | 0 | 238 | 0 |
| Mode M0 | |||
|---|---|---|---|
| Quadrant | BADHDUFLAG | Total packets | Discarded packets |
| A | 0 | 25928 | 3 |
| B | 0 | 27890 | 3 |
| C | 0 | 25752 | 3 |
| D | 0 | 35542 | 3 |
| Mode M9 | |||
|---|---|---|---|
| Quadrant | BADHDUFLAG | Total packets | Discarded packets |
| A | 0 | 38 | 0 |
| B | 0 | 38 | 0 |
| C | 0 | 38 | 0 |
| D | 0 | 38 | 0 |
| Quadrant | Total seconds | Saturated seconds | Saturation percentage |
|---|---|---|---|
| A | 11671 | 228 | 1.953560% |
| B | 11670 | 324 | 2.776350% |
| C | 11670 | 292 | 2.502142% |
| D | 11670 | 621 | 5.321337% |
Noise dominated data is calculated using 1-second bins in cleaned event files. If a bin has >2000 counts, and if more than 50% of those come from <1% of pixels, then it is considered to be noise-dominated and hence unusable.
| Quadrant | # 1 sec bins | Bins with >0 counts | Bins with >2000 counts | High rate bins dominated by noise | Noise dominated (total time) | Noise dominated (detector-on time) | Marked lightcurve |
|---|---|---|---|---|---|---|---|
| A | 15411 | 11674 | 2 | 2 | 0.01% | 0.02% |  |
| B | 15410 | 11673 | 61 | 61 | 0.40% | 0.52% |  |
| C | 15410 | 11673 | 0 | 0 | 0.00% | 0.00% |  |
| D | 15410 | 11672 | 426 | 426 | 2.76% | 3.65% |  |
Top three noisy pixels from each quadrant. If the there are fewer than three noisy pixels in the level2.evt file, extra rows are filled as -1
| Pixel properties | Quadrant properties | ||||||
|---|---|---|---|---|---|---|---|
| Quadrant | DetID | PixID | Counts | Sigma | Mean | Median | Sigma |
| A | 5 | 16 | 15369 | 43.03 | 1613 | 1585 | 320.4 |
| A | 0 | 226 | 14484 | 40.26 | 1613 | 1585 | 320.4 |
| A | 3 | 137 | 11940 | 32.32 | 1613 | 1585 | 320.4 |
| B | 7 | 220 | 480791 | 1663.08 | 1564 | 1533 | 288.2 |
| B | 0 | 190 | 54295 | 183.09 | 1564 | 1533 | 288.2 |
| B | 3 | 64 | 46572 | 156.29 | 1564 | 1533 | 288.2 |
| C | 14 | 238 | 241036 | 698.87 | 1500 | 1514 | 342.7 |
| C | 7 | 247 | 20974 | 56.78 | 1500 | 1514 | 342.7 |
| C | 13 | 61 | 10582 | 26.46 | 1500 | 1514 | 342.7 |
| D | 5 | 222 | 2161010 | 5956.5 | 1539 | 1498 | 362.5 |
| D | 7 | 238 | 601775 | 1655.72 | 1539 | 1498 | 362.5 |
| D | 7 | 38 | 233197 | 639.09 | 1539 | 1498 | 362.5 |
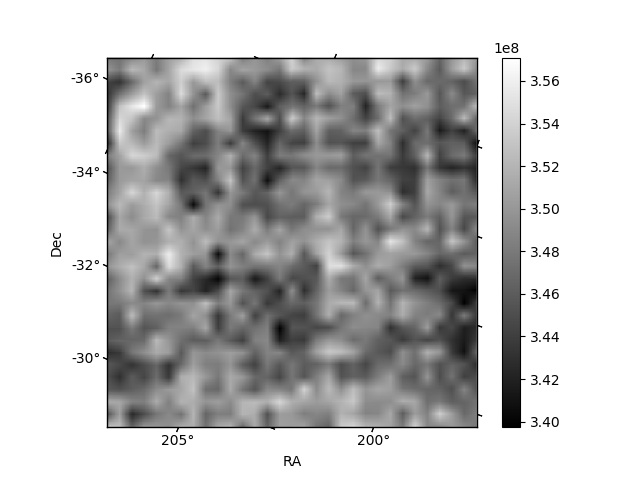
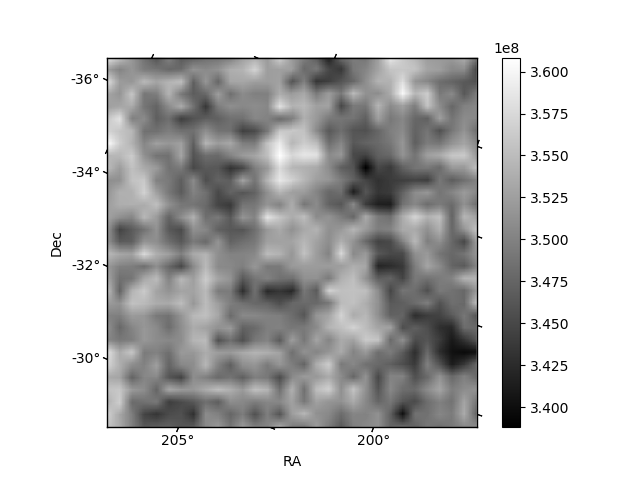
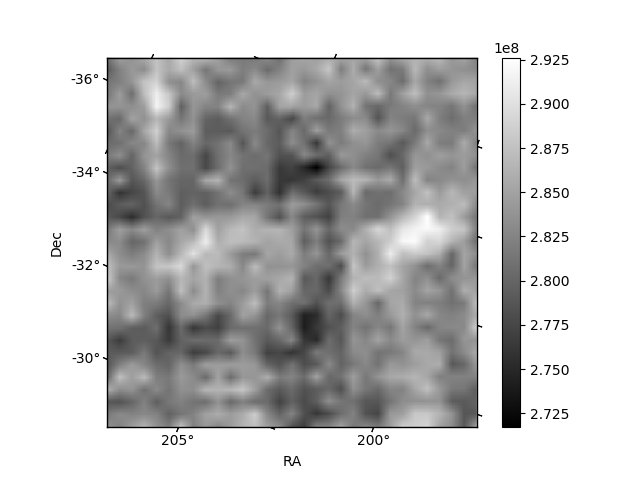
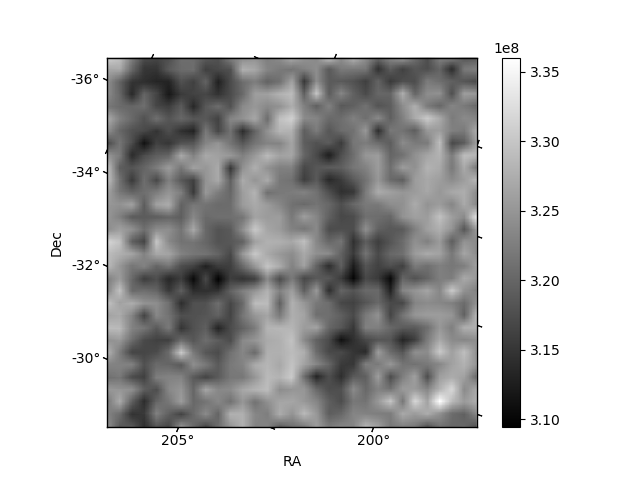
Histogram calculated using DETX and DETY for each event in the final _common_clean file
| Quadrant A | 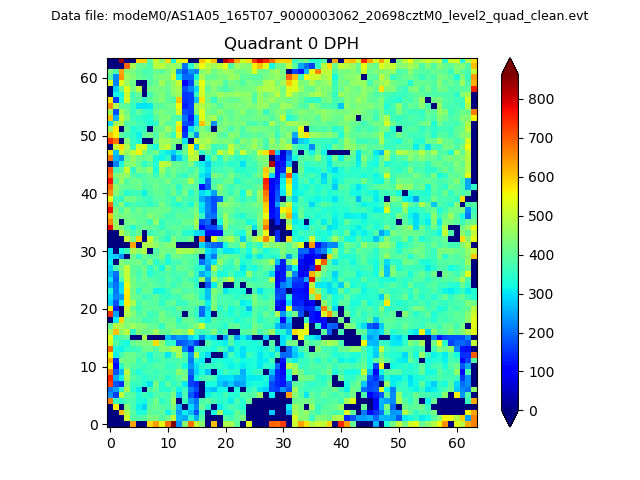 |
 |
Quadrant B |
|---|---|---|---|
| Quadrant D | 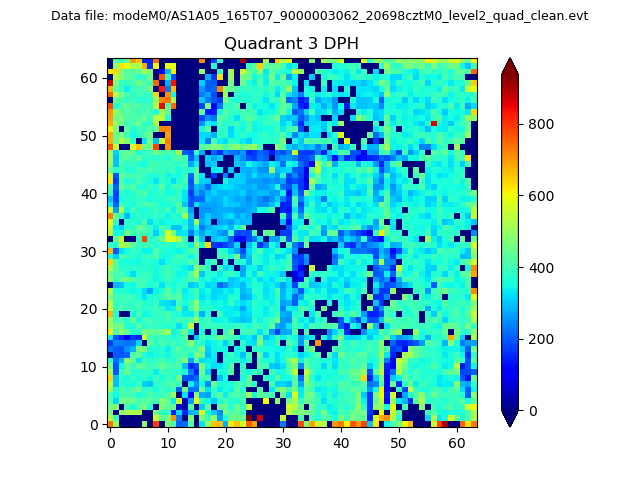 |
 |
Quadrant C |
| Plot type | Count rate plots | Images |
|---|---|---|
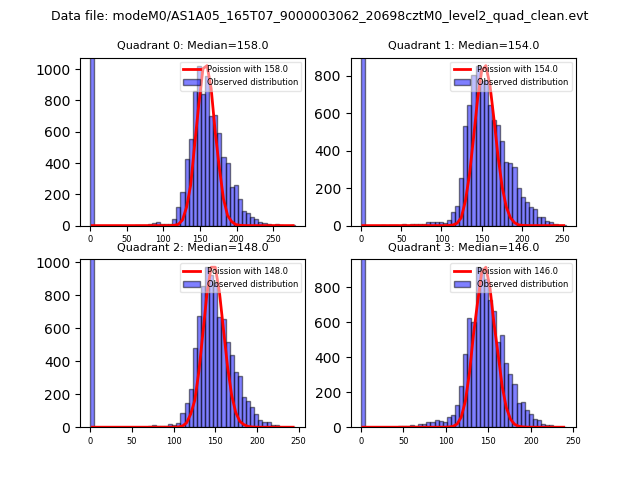
| Comparison with Poisson distribution Blue bars denote a histogram of data divided into 1 sec bins. Red curve is a Poisson curve with rate = median count rate of data. |
 |
 |
| Quadrant-wise count rates Data is divided into 100 sec bins |
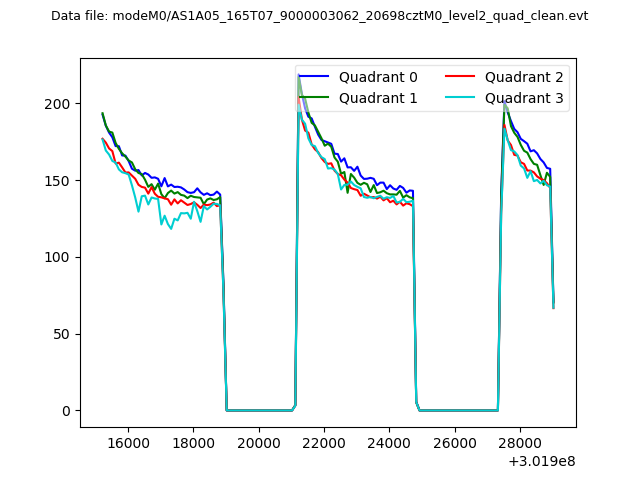 |
|
| Module-wise count rates for Quadrant A Data is divided into 100 sec bins |
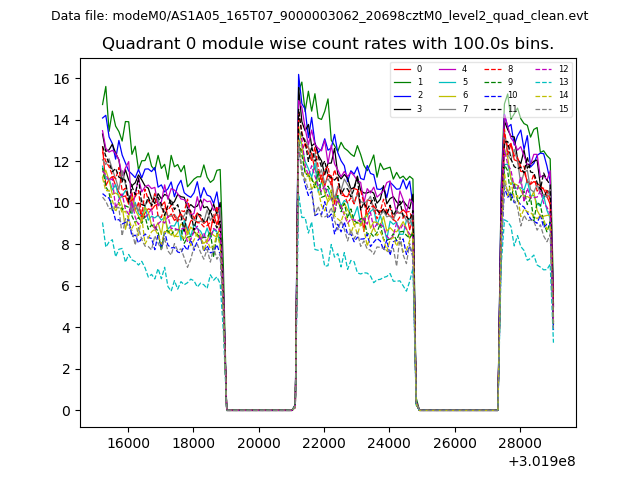 |
 |
| Module-wise count rates for Quadrant B Data is divided into 100 sec bins |
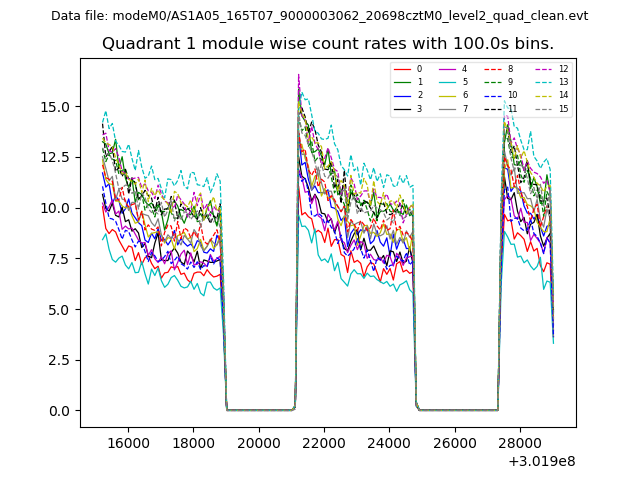 |
 |
| Module-wise count rates for Quadrant C Data is divided into 100 sec bins |
 |
 |
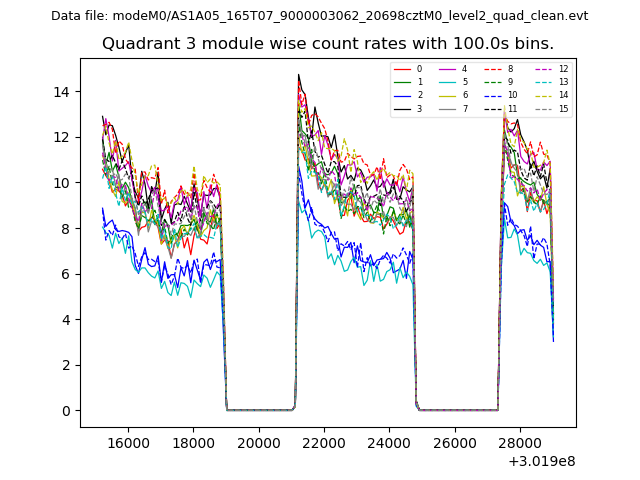
| Module-wise count rates for Quadrant D Data is divided into 100 sec bins |
 |
 |
| Parameter | Plot |
|---|---|
| CZT HV Monitor | 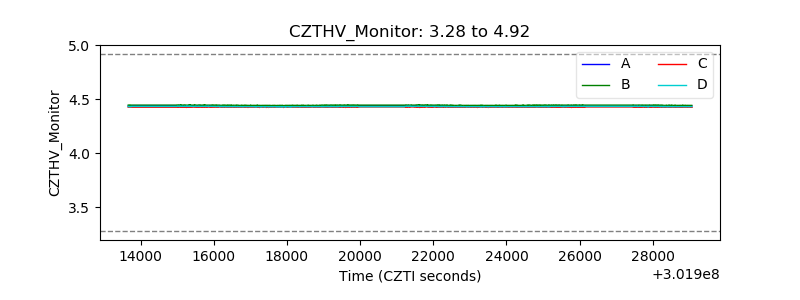 |
| D_VDD | 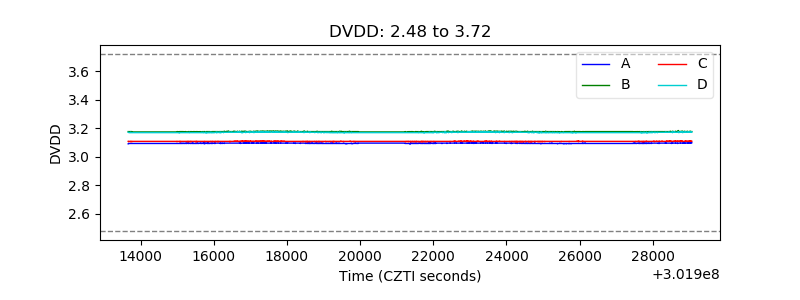 |
| Temperature 1 | 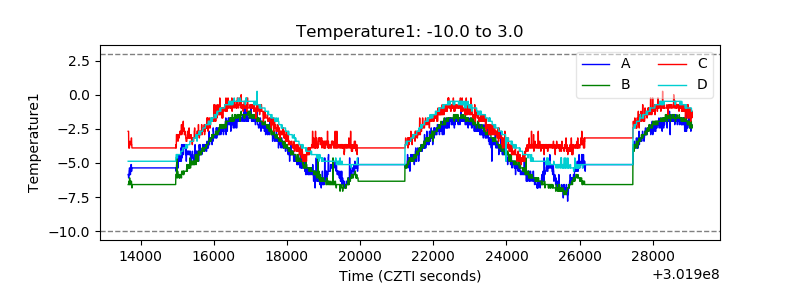 |
| Veto HV Monitor | 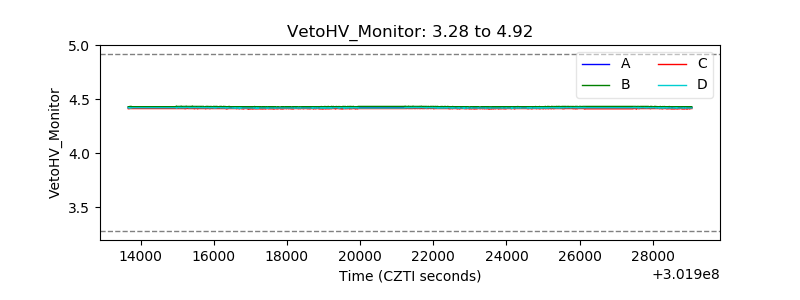 |
| Veto LLD |  |
| Alpha Counter | 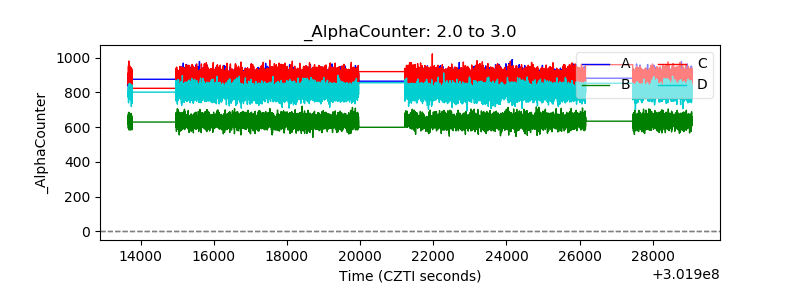 |
| _CPM_Rate | 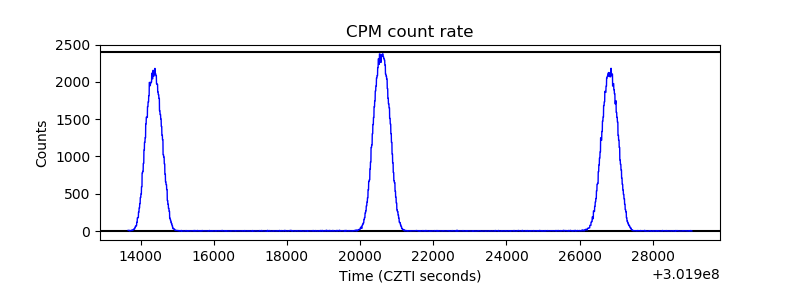 |
| CZT Counter | 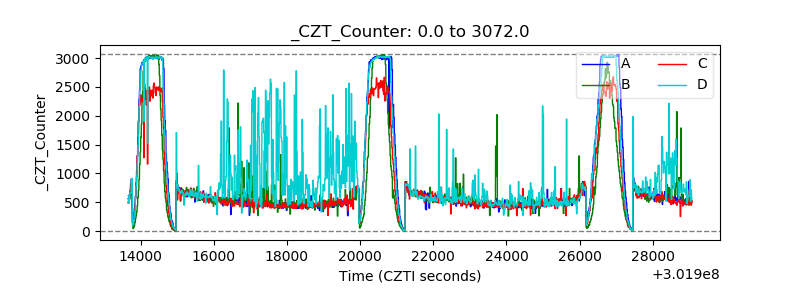 |
| +2.5 Volts monitor | 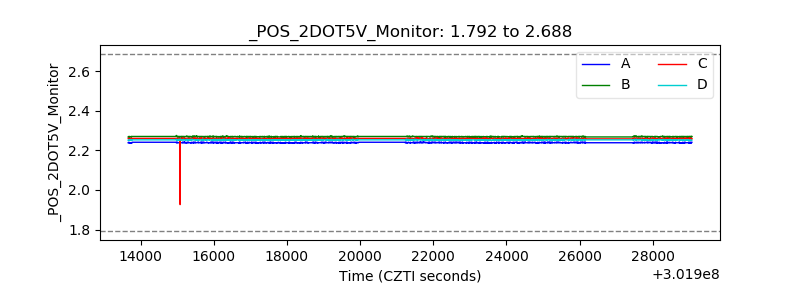 |
| +5 Volts monitor | 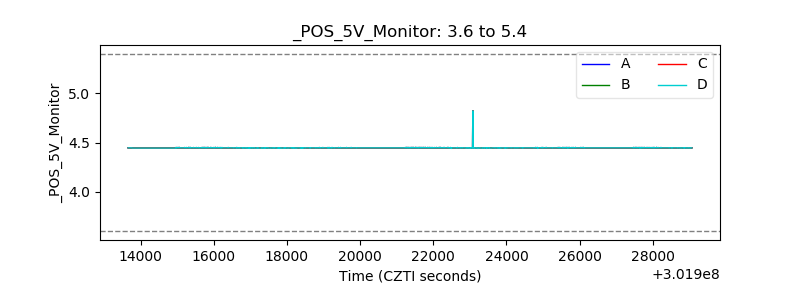 |
| _ROLL_ROT | 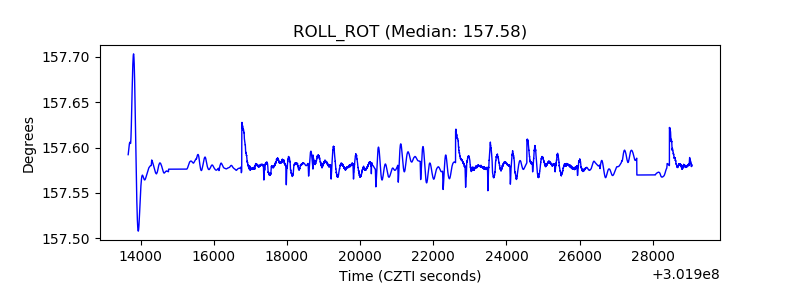 |
| _Roll_DEC | 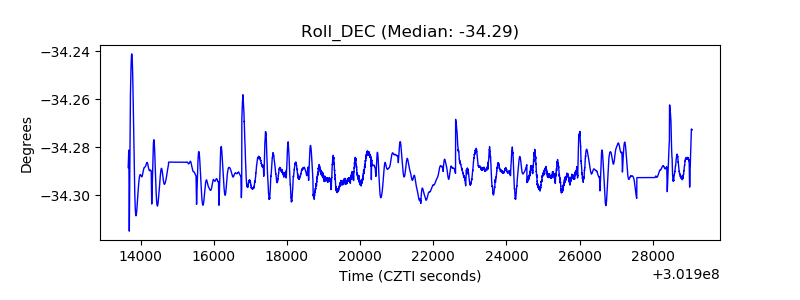 |
| _Roll_RA | 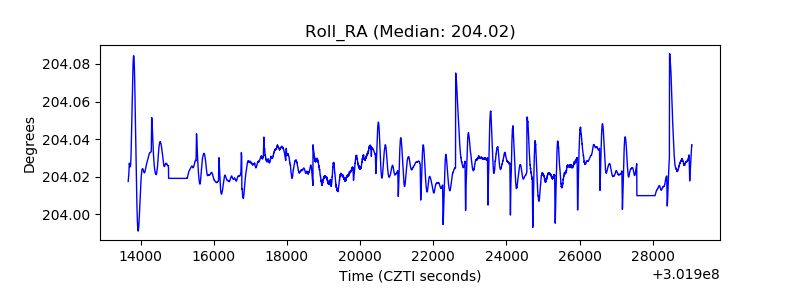 |
| Veto Counter | 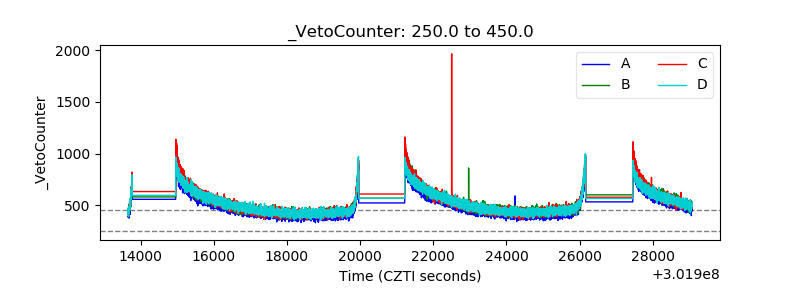 |