| Param | Original file | Final file |
|---|---|---|
| Filename | modeM0/AS1A05_165T07_9000003062_20699cztM0_level2.evt | modeM0/AS1A05_165T07_9000003062_20699cztM0_level2_quad_clean.evt |
| Size (bytes) | 453,481,920 | 97,004,160 |
| Size | 432.5 MB | 92.5 MB |
| Events in quadrant A | 3,085,664 | 661,004 |
| Events in quadrant B | 3,395,240 | 640,483 |
| Events in quadrant C | 2,992,823 | 611,053 |
| Events in quadrant D | 3,856,313 | 610,024 |
| Mode SS | |||
|---|---|---|---|
| Quadrant | BADHDUFLAG | Total packets | Discarded packets |
| A | 0 | 122 | 0 |
| B | 0 | 122 | 0 |
| C | 0 | 122 | 0 |
| D | 0 | 122 | 0 |
| Mode M0 | |||
|---|---|---|---|
| Quadrant | BADHDUFLAG | Total packets | Discarded packets |
| A | 0 | 12740 | 1 |
| B | 0 | 13957 | 1 |
| C | 0 | 12553 | 1 |
| D | 0 | 15348 | 1 |
| Mode M9 | |||
|---|---|---|---|
| Quadrant | BADHDUFLAG | Total packets | Discarded packets |
| A | 0 | 13 | 0 |
| B | 0 | 13 | 0 |
| C | 0 | 13 | 0 |
| D | 0 | 13 | 0 |
| Quadrant | Total seconds | Saturated seconds | Saturation percentage |
|---|---|---|---|
| A | 5940 | 95 | 1.599327% |
| B | 5941 | 161 | 2.709981% |
| C | 5941 | 119 | 2.003030% |
| D | 5941 | 183 | 3.080290% |
Noise dominated data is calculated using 1-second bins in cleaned event files. If a bin has >2000 counts, and if more than 50% of those come from <1% of pixels, then it is considered to be noise-dominated and hence unusable.
| Quadrant | # 1 sec bins | Bins with >0 counts | Bins with >2000 counts | High rate bins dominated by noise | Noise dominated (total time) | Noise dominated (detector-on time) | Marked lightcurve |
|---|---|---|---|---|---|---|---|
| A | 7240 | 5941 | 3 | 3 | 0.04% | 0.05% | 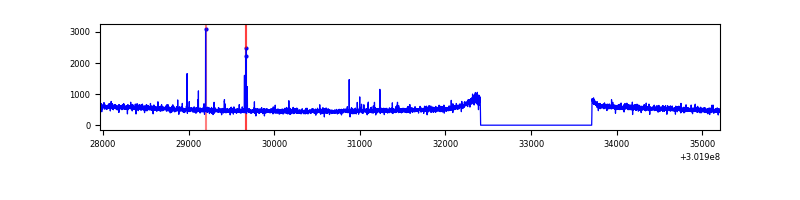 |
| B | 7241 | 5942 | 29 | 29 | 0.40% | 0.49% | 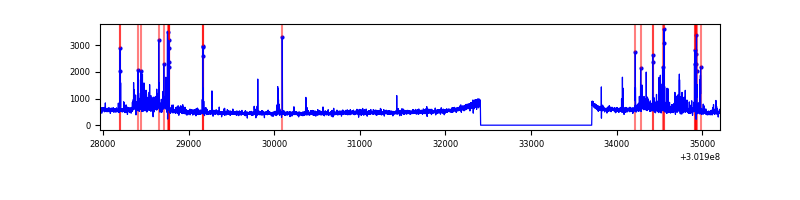 |
| C | 7241 | 5942 | 0 | 0 | 0.00% | 0.00% | 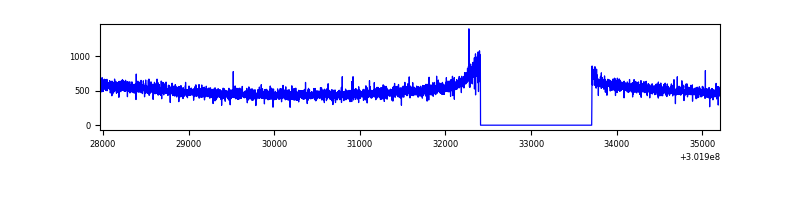 |
| D | 7241 | 5942 | 50 | 50 | 0.69% | 0.84% | 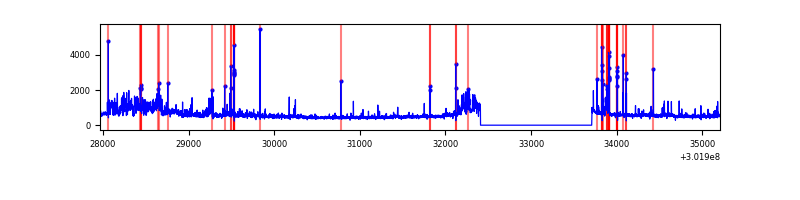 |
Top three noisy pixels from each quadrant. If the there are fewer than three noisy pixels in the level2.evt file, extra rows are filled as -1
| Pixel properties | Quadrant properties | ||||||
|---|---|---|---|---|---|---|---|
| Quadrant | DetID | PixID | Counts | Sigma | Mean | Median | Sigma |
| A | 9 | 143 | 39364 | 242.36 | 793 | 779 | 159.2 |
| A | 0 | 226 | 7052 | 39.4 | 793 | 779 | 159.2 |
| A | 12 | 194 | 5717 | 31.02 | 793 | 779 | 159.2 |
| B | 7 | 220 | 301465 | 2089.01 | 768 | 751 | 144.0 |
| B | 0 | 190 | 26481 | 178.74 | 768 | 751 | 144.0 |
| B | 0 | 197 | 18472 | 123.1 | 768 | 751 | 144.0 |
| C | 14 | 238 | 117500 | 693.75 | 731 | 734 | 168.3 |
| C | 7 | 247 | 14522 | 81.92 | 731 | 734 | 168.3 |
| C | 8 | 208 | 5418 | 27.83 | 731 | 734 | 168.3 |
| D | 7 | 238 | 439250 | 2413.53 | 755 | 735 | 181.7 |
| D | 5 | 222 | 210112 | 1152.38 | 755 | 735 | 181.7 |
| D | 1 | 52 | 101405 | 554.07 | 755 | 735 | 181.7 |
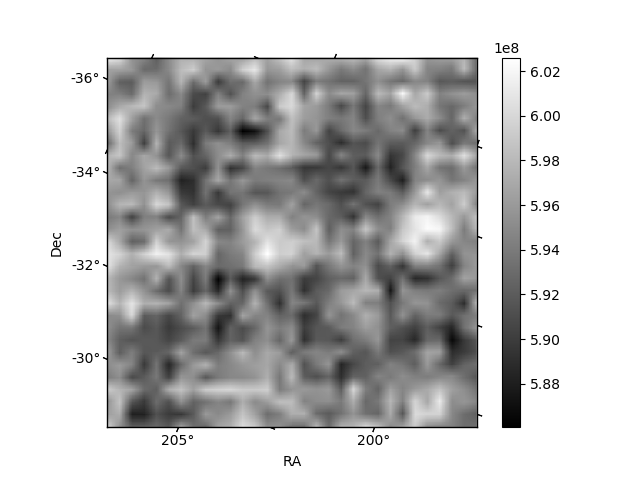
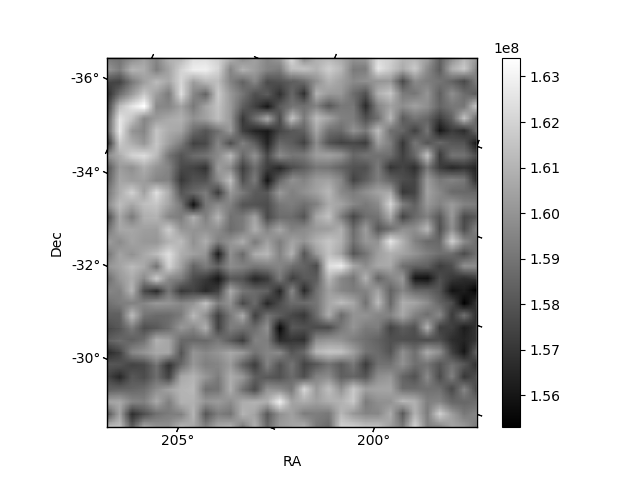
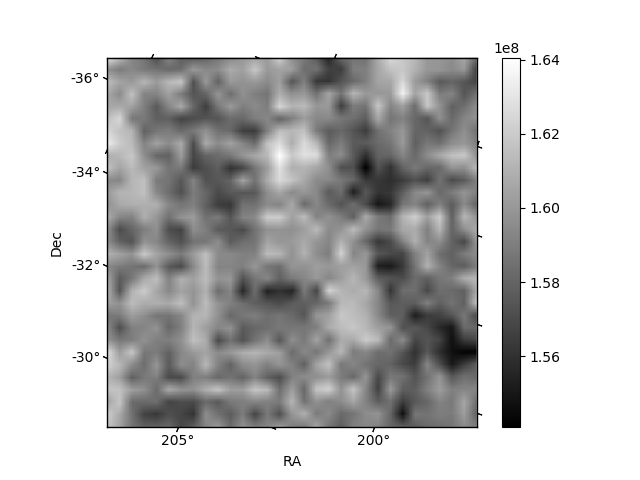
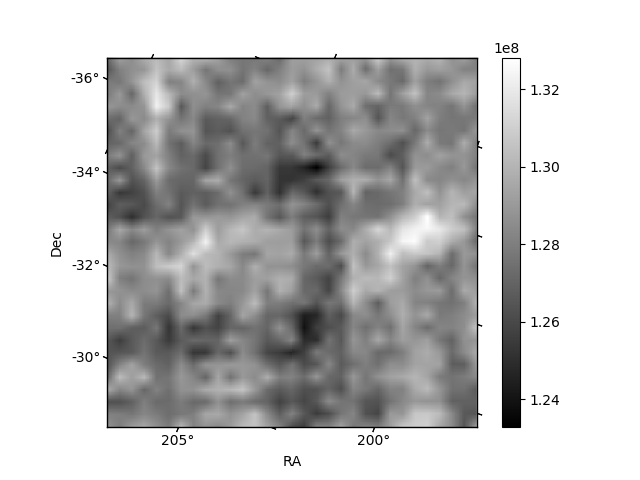
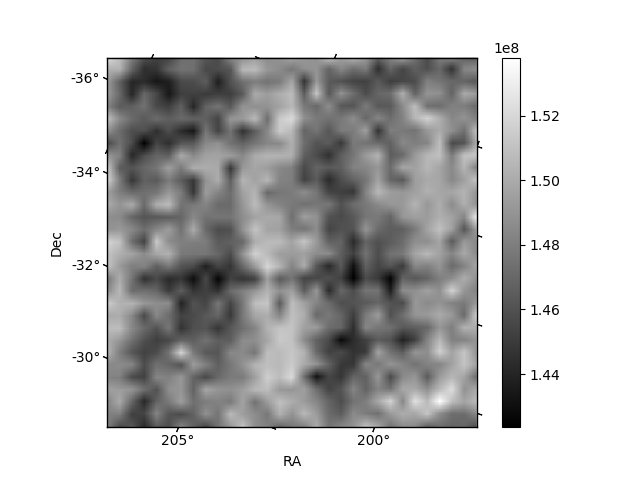
Histogram calculated using DETX and DETY for each event in the final _common_clean file
| Quadrant A | 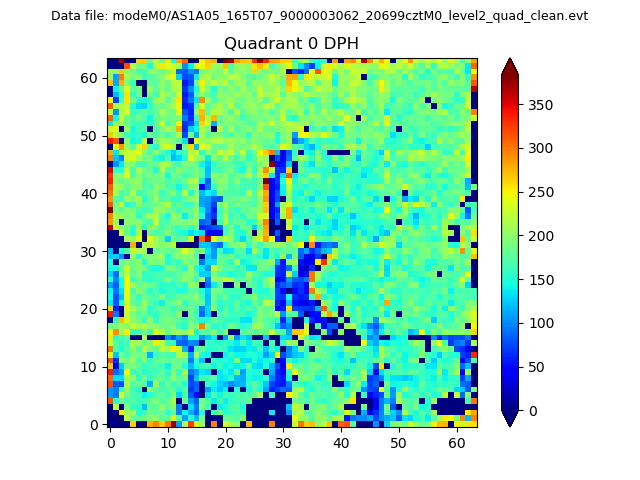 |
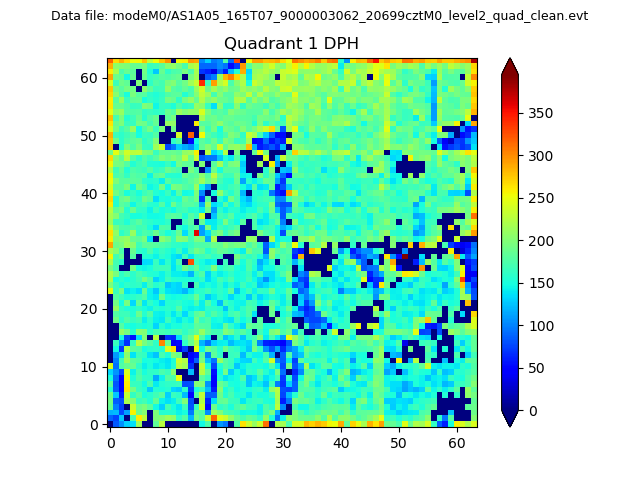 |
Quadrant B |
|---|---|---|---|
| Quadrant D | 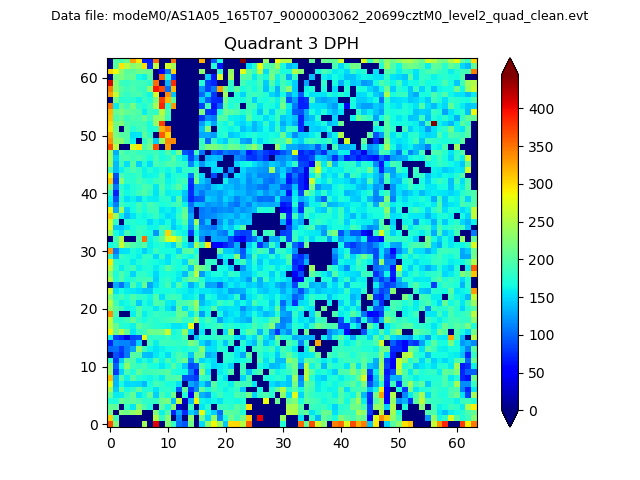 |
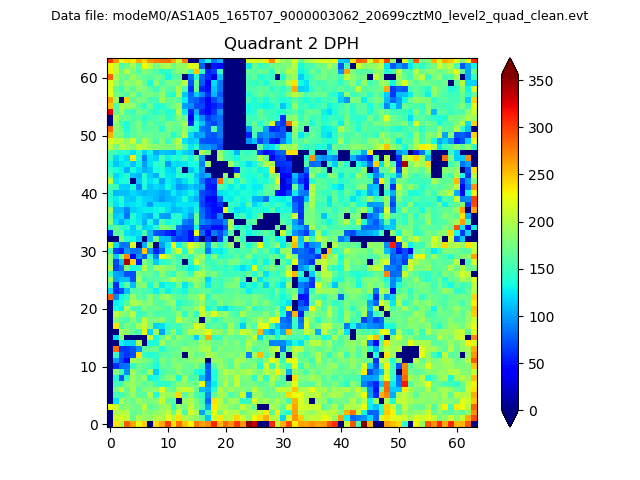 |
Quadrant C |
| Plot type | Count rate plots | Images |
|---|---|---|
| Comparison with Poisson distribution Blue bars denote a histogram of data divided into 1 sec bins. Red curve is a Poisson curve with rate = median count rate of data. |
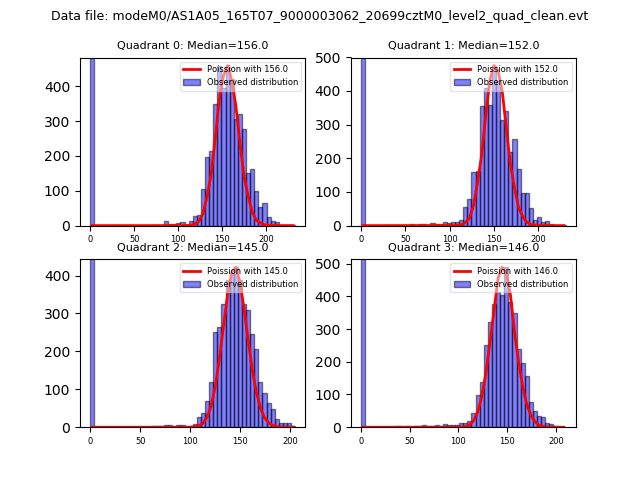 |
 |
| Quadrant-wise count rates Data is divided into 100 sec bins |
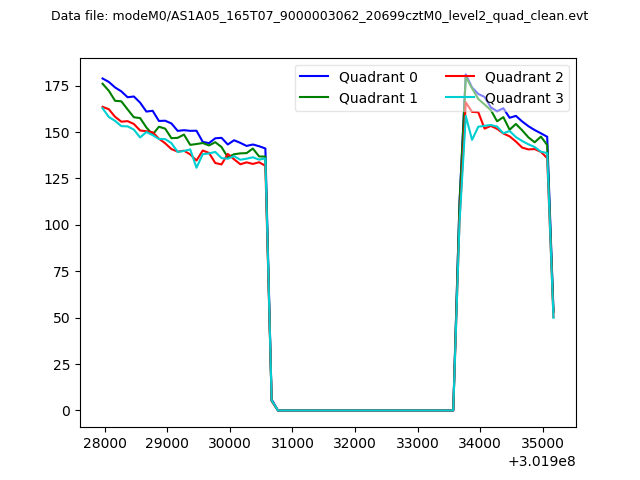 |
|
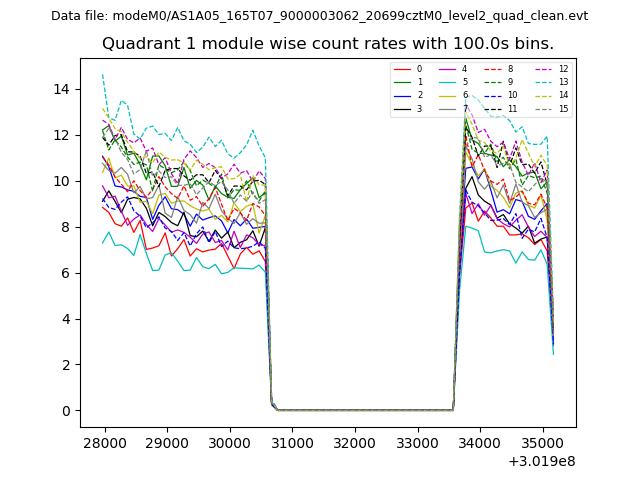
| Module-wise count rates for Quadrant A Data is divided into 100 sec bins |
 |
 |
| Module-wise count rates for Quadrant B Data is divided into 100 sec bins |
 |
 |
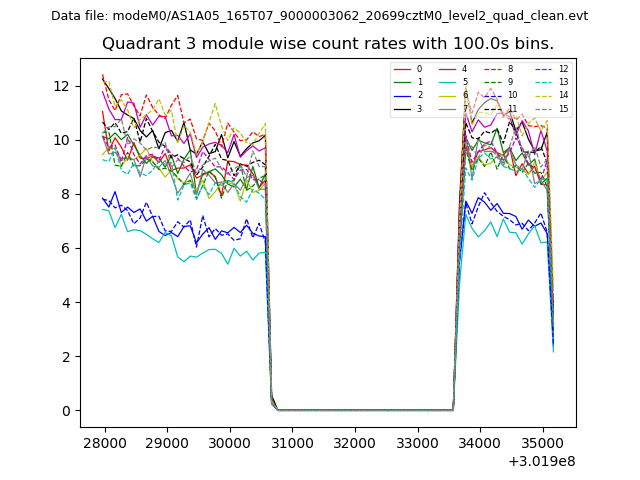
| Module-wise count rates for Quadrant C Data is divided into 100 sec bins |
 |
 |
| Module-wise count rates for Quadrant D Data is divided into 100 sec bins |
 |
 |
| Parameter | Plot |
|---|---|
| CZT HV Monitor | 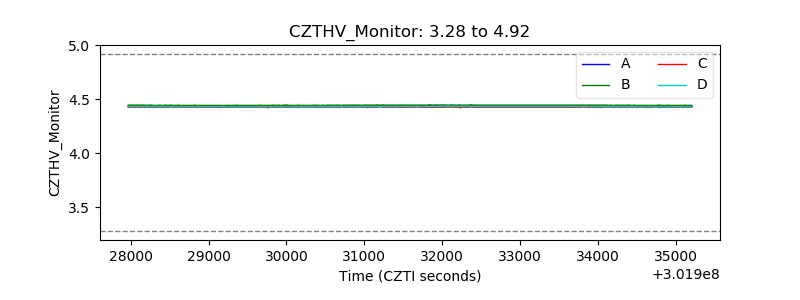 |
| D_VDD | 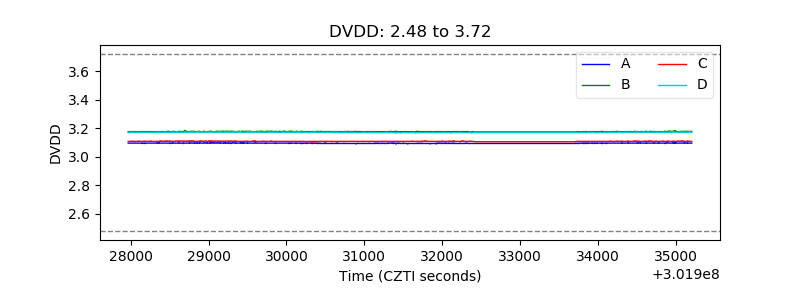 |
| Temperature 1 | 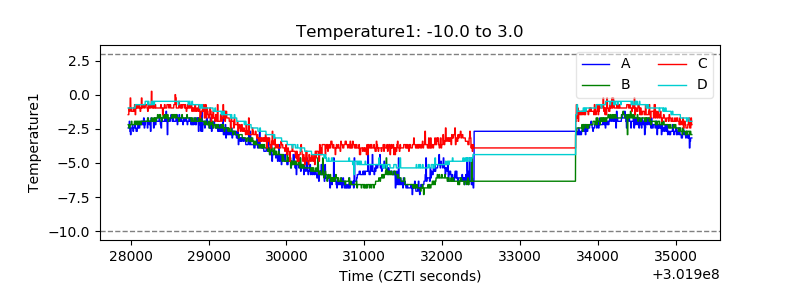 |
| Veto HV Monitor | 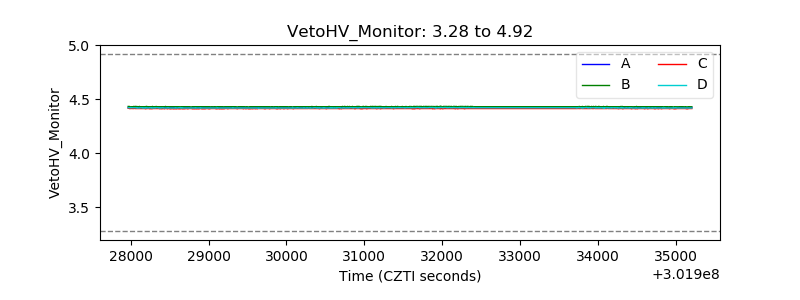 |
| Veto LLD |  |
| Alpha Counter | 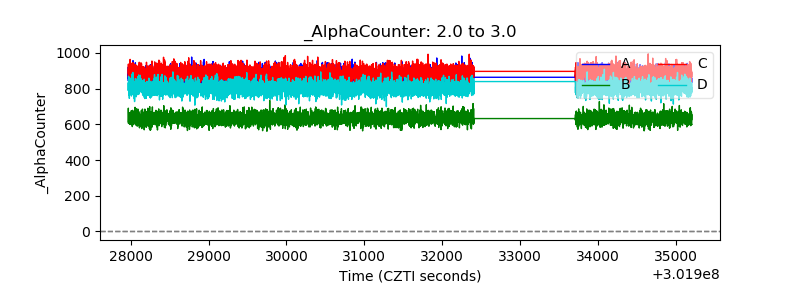 |
| _CPM_Rate | 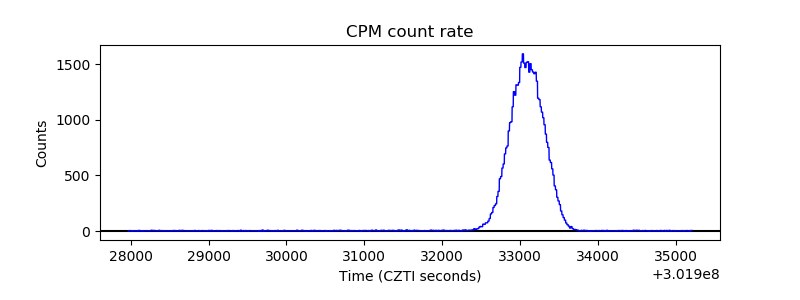 |
| CZT Counter | 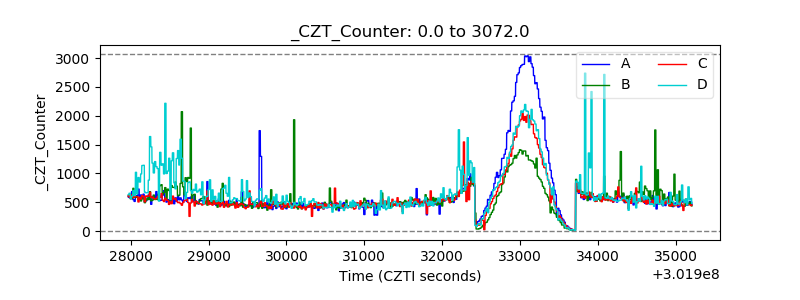 |
| +2.5 Volts monitor |  |
| +5 Volts monitor |  |
| _ROLL_ROT |  |
| _Roll_DEC | 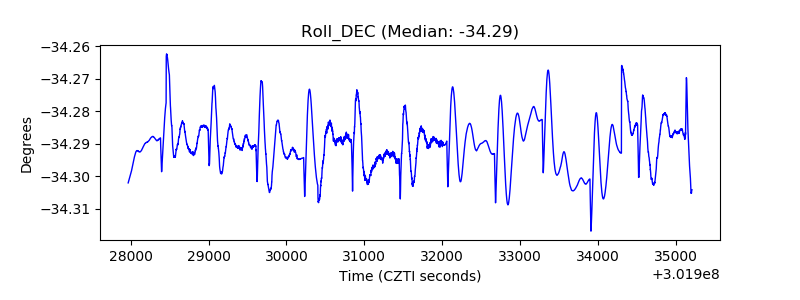 |
| _Roll_RA | 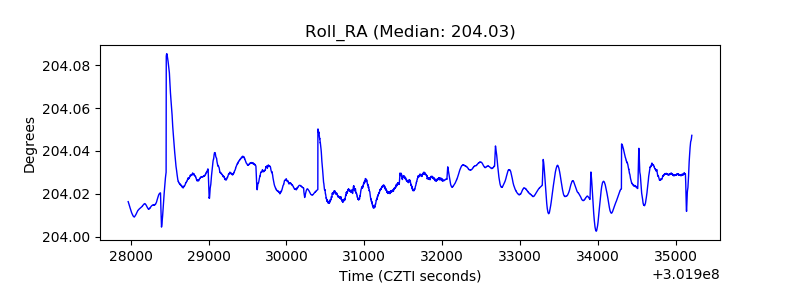 |
| Veto Counter |  |