| Param | Original file | Final file |
|---|---|---|
| Filename | modeM0/AS1A05_165T07_9000003062_20700cztM0_level2.evt | modeM0/AS1A05_165T07_9000003062_20700cztM0_level2_quad_clean.evt |
| Size (bytes) | 416,269,440 | 82,235,520 |
| Size | 397.0 MB | 78.4 MB |
| Events in quadrant A | 2,855,871 | 544,425 |
| Events in quadrant B | 3,386,930 | 526,090 |
| Events in quadrant C | 2,823,580 | 505,566 |
| Events in quadrant D | 3,145,380 | 508,176 |
| Mode SS | |||
|---|---|---|---|
| Quadrant | BADHDUFLAG | Total packets | Discarded packets |
| A | 0 | 120 | 0 |
| B | 0 | 120 | 0 |
| C | 0 | 120 | 0 |
| D | 0 | 120 | 0 |
| Mode M0 | |||
|---|---|---|---|
| Quadrant | BADHDUFLAG | Total packets | Discarded packets |
| A | 0 | 12148 | 1 |
| B | 0 | 13921 | 1 |
| C | 0 | 12137 | 1 |
| D | 0 | 13135 | 1 |
| Mode M9 | |||
|---|---|---|---|
| Quadrant | BADHDUFLAG | Total packets | Discarded packets |
| A | 0 | 11 | 0 |
| B | 0 | 11 | 0 |
| C | 0 | 11 | 0 |
| D | 0 | 11 | 0 |
| Quadrant | Total seconds | Saturated seconds | Saturation percentage |
|---|---|---|---|
| A | 5801 | 95 | 1.637649% |
| B | 5802 | 206 | 3.550500% |
| C | 5802 | 115 | 1.982075% |
| D | 5802 | 110 | 1.895898% |
Noise dominated data is calculated using 1-second bins in cleaned event files. If a bin has >2000 counts, and if more than 50% of those come from <1% of pixels, then it is considered to be noise-dominated and hence unusable.
| Quadrant | # 1 sec bins | Bins with >0 counts | Bins with >2000 counts | High rate bins dominated by noise | Noise dominated (total time) | Noise dominated (detector-on time) | Marked lightcurve |
|---|---|---|---|---|---|---|---|
| A | 6951 | 5802 | 0 | 0 | 0.00% | 0.00% | 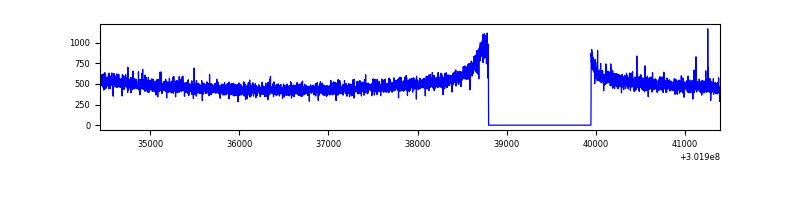 |
| B | 6952 | 5803 | 61 | 61 | 0.88% | 1.05% | 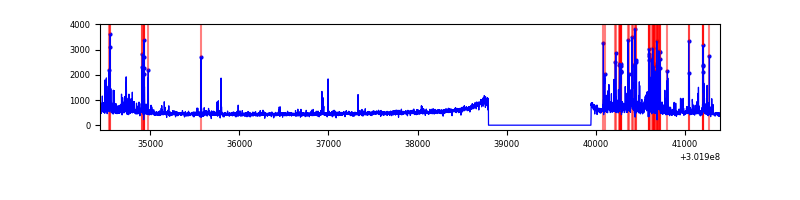 |
| C | 6952 | 5803 | 0 | 0 | 0.00% | 0.00% | 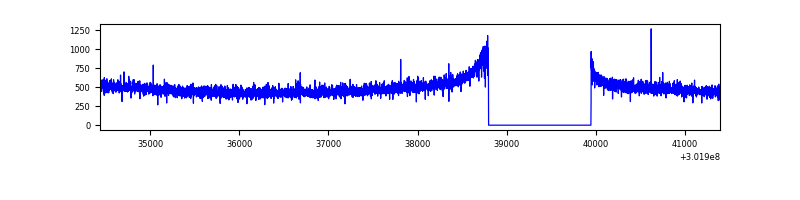 |
| D | 6952 | 5803 | 34 | 34 | 0.49% | 0.59% | 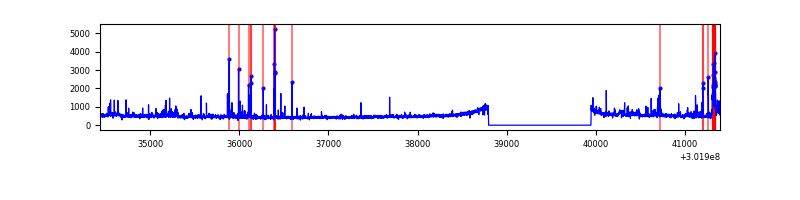 |
Top three noisy pixels from each quadrant. If the there are fewer than three noisy pixels in the level2.evt file, extra rows are filled as -1
| Pixel properties | Quadrant properties | ||||||
|---|---|---|---|---|---|---|---|
| Quadrant | DetID | PixID | Counts | Sigma | Mean | Median | Sigma |
| A | 0 | 226 | 6571 | 38.77 | 743 | 729 | 150.7 |
| A | 3 | 137 | 5730 | 33.19 | 743 | 729 | 150.7 |
| A | 12 | 194 | 5473 | 31.48 | 743 | 729 | 150.7 |
| B | 7 | 220 | 467692 | 3385.98 | 727 | 708 | 137.9 |
| B | 0 | 190 | 20829 | 145.89 | 727 | 708 | 137.9 |
| B | 12 | 111 | 15928 | 110.36 | 727 | 708 | 137.9 |
| C | 14 | 238 | 109673 | 680.73 | 691 | 695 | 160.1 |
| C | 7 | 247 | 11796 | 69.34 | 691 | 695 | 160.1 |
| C | 3 | 233 | 6661 | 37.27 | 691 | 695 | 160.1 |
| D | 7 | 38 | 117363 | 680.97 | 710 | 689 | 171.3 |
| D | 5 | 222 | 87338 | 505.73 | 710 | 689 | 171.3 |
| D | 13 | 153 | 67031 | 387.21 | 710 | 689 | 171.3 |
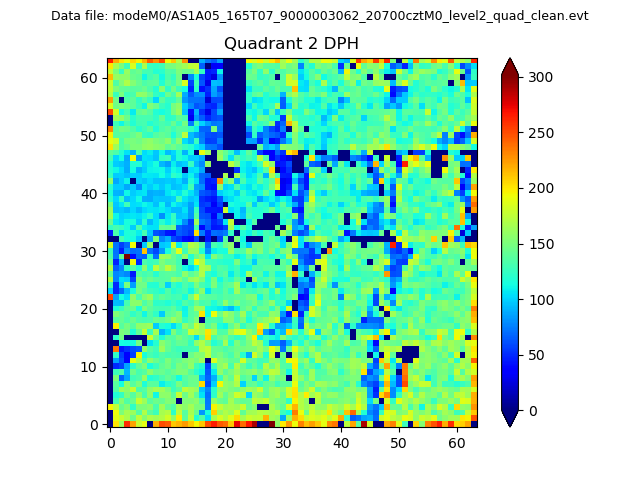
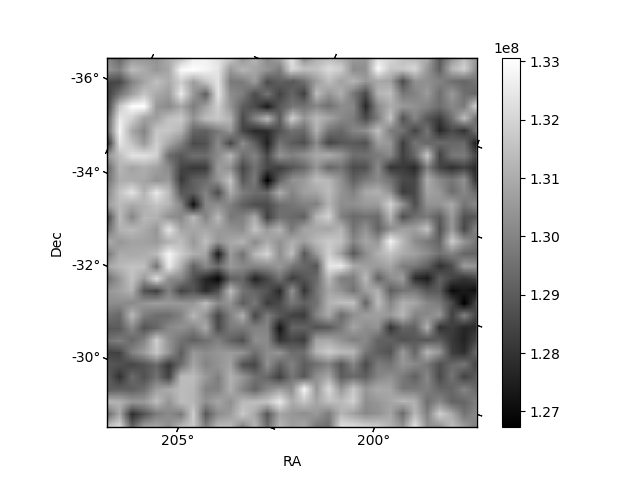
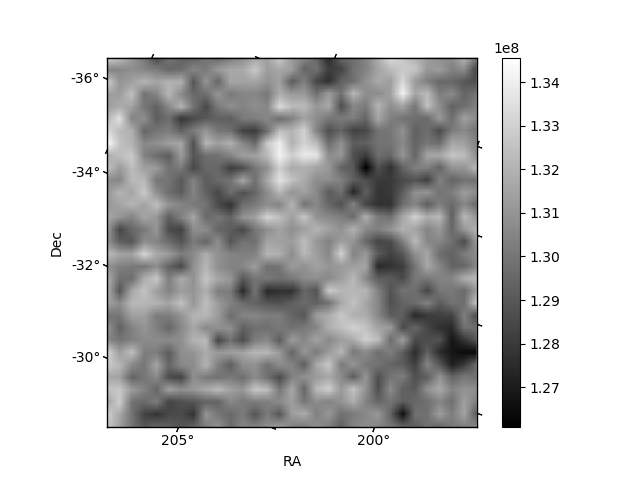
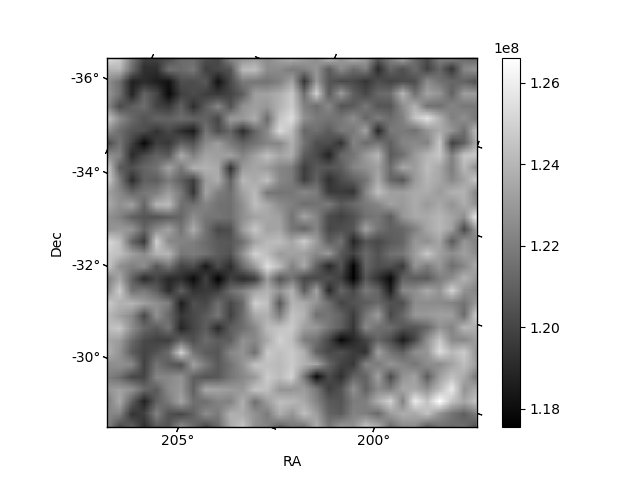
Histogram calculated using DETX and DETY for each event in the final _common_clean file
| Quadrant A | 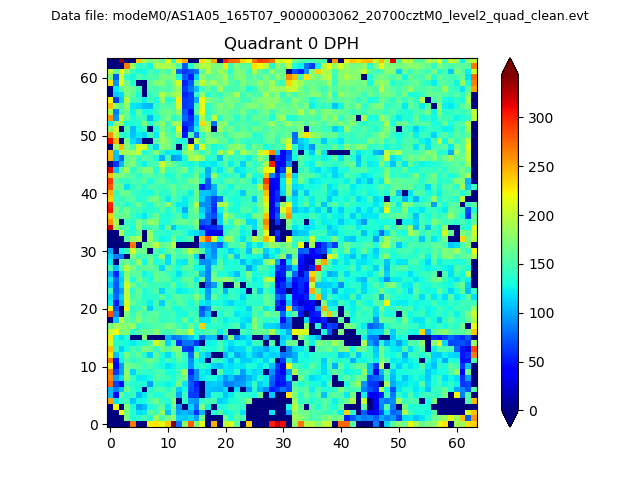 |
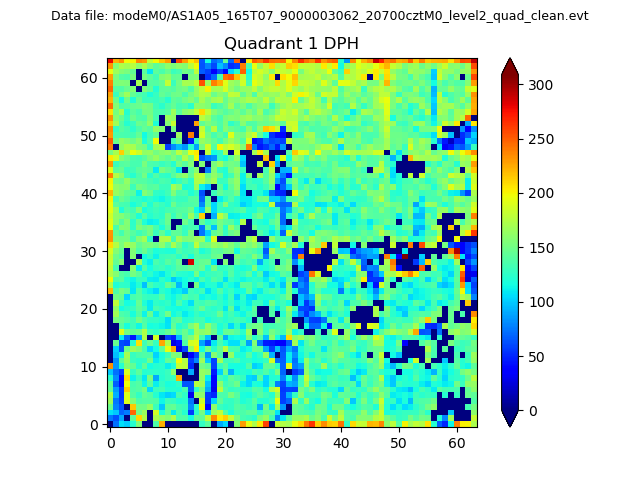 |
Quadrant B |
|---|---|---|---|
| Quadrant D | 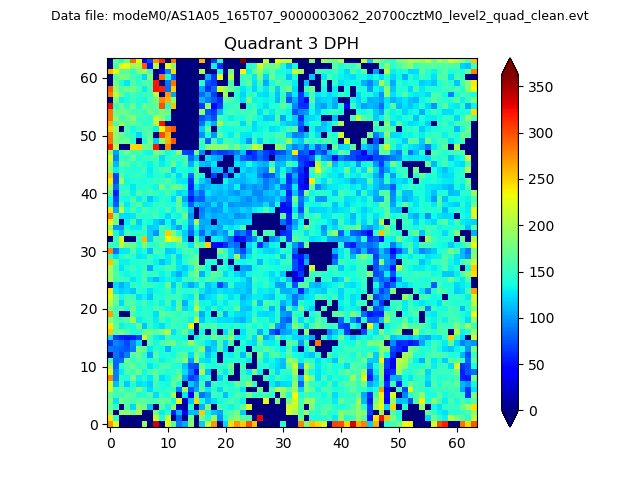 |
 |
Quadrant C |
| Plot type | Count rate plots | Images |
|---|---|---|
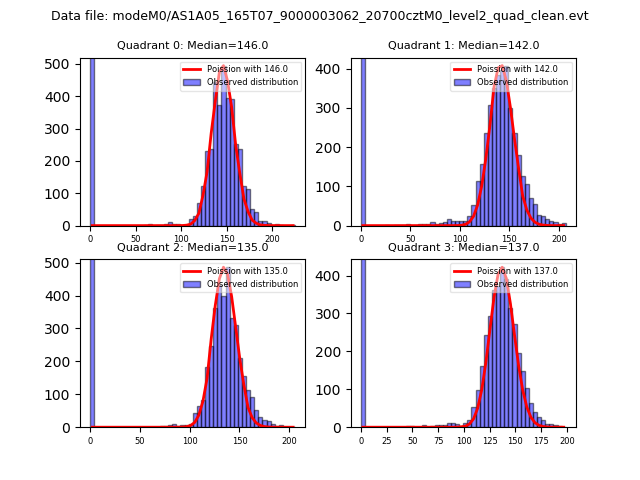
| Comparison with Poisson distribution Blue bars denote a histogram of data divided into 1 sec bins. Red curve is a Poisson curve with rate = median count rate of data. |
 |
 |
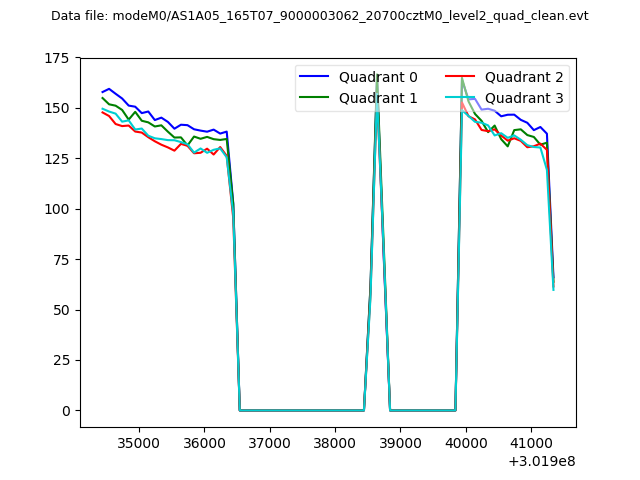
| Quadrant-wise count rates Data is divided into 100 sec bins |
 |
|
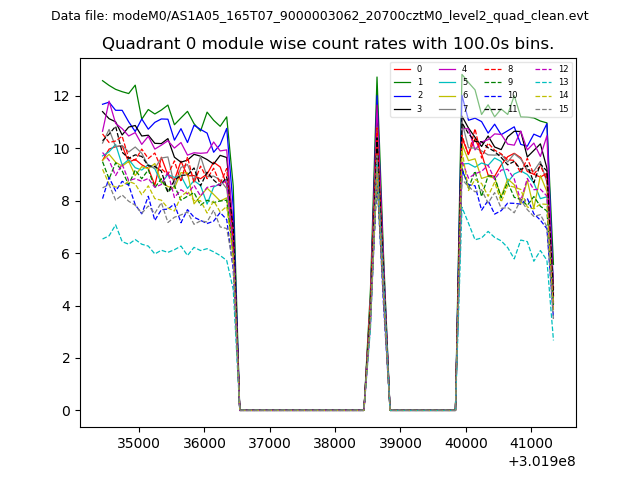
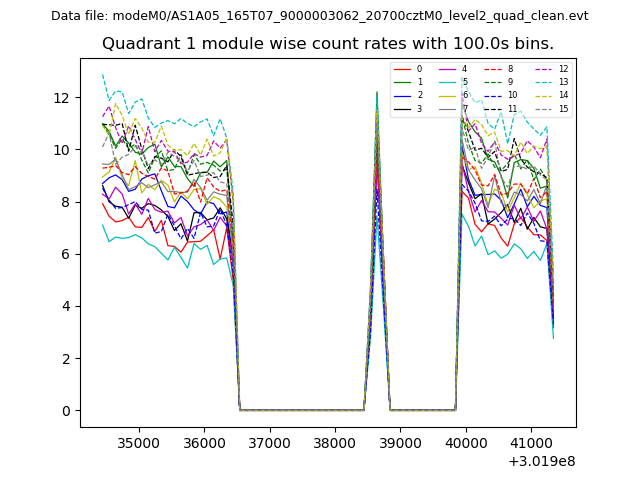
| Module-wise count rates for Quadrant A Data is divided into 100 sec bins |
 |
 |
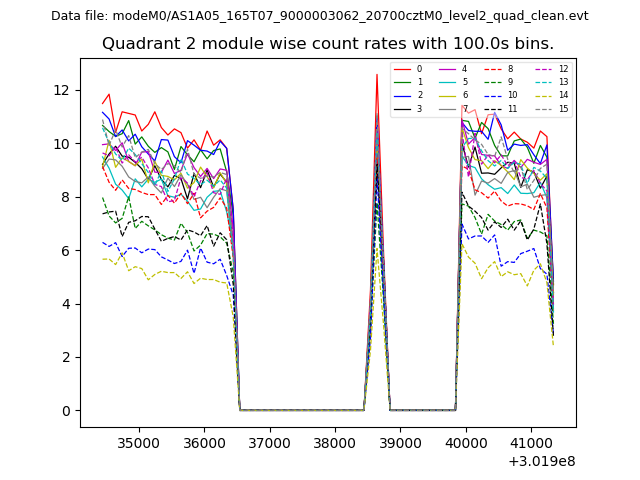
| Module-wise count rates for Quadrant B Data is divided into 100 sec bins |
 |
 |
| Module-wise count rates for Quadrant C Data is divided into 100 sec bins |
 |
 |
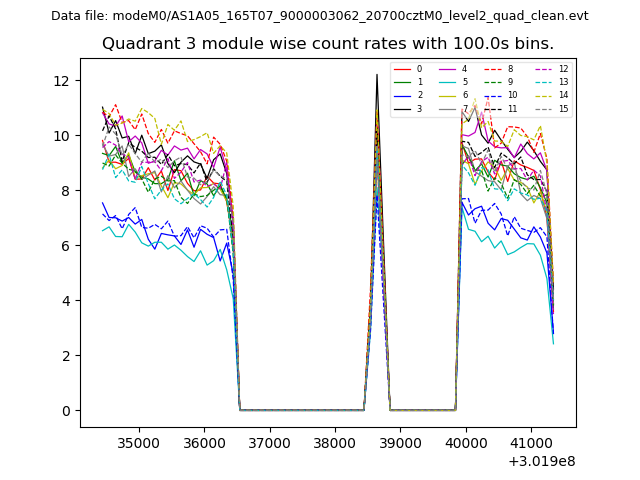
| Module-wise count rates for Quadrant D Data is divided into 100 sec bins |
 |
 |
| Parameter | Plot |
|---|---|
| CZT HV Monitor | 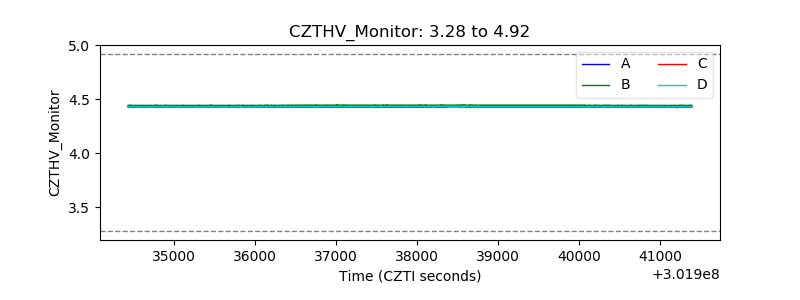 |
| D_VDD | 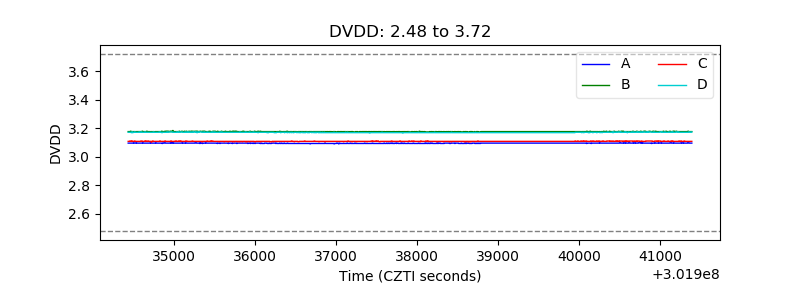 |
| Temperature 1 | 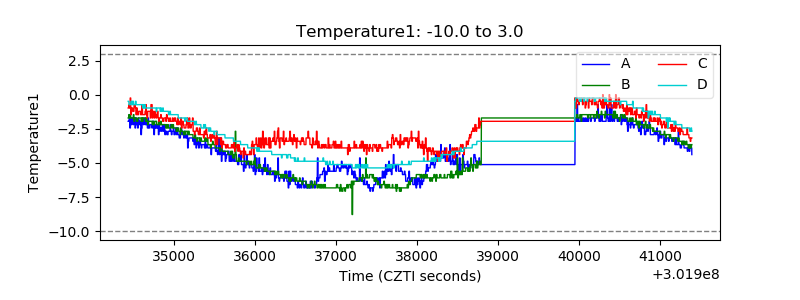 |
| Veto HV Monitor | 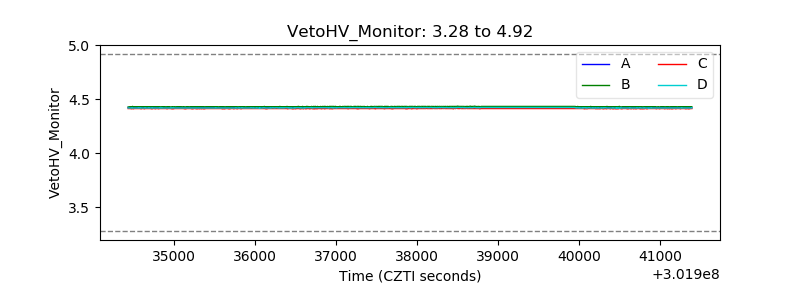 |
| Veto LLD | 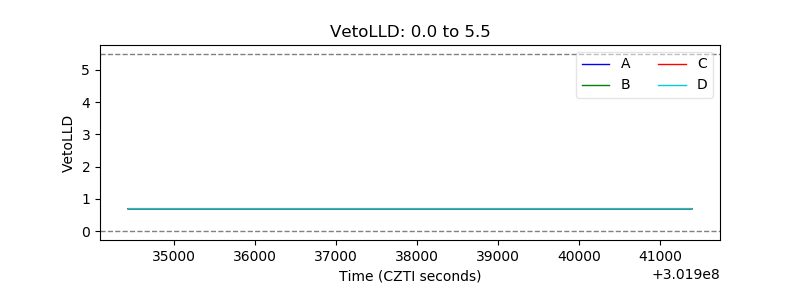 |
| Alpha Counter | 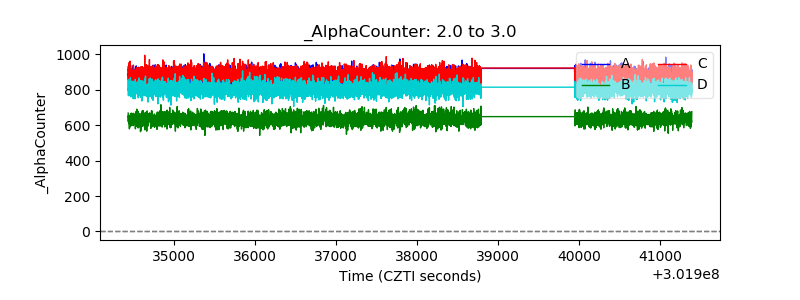 |
| _CPM_Rate | 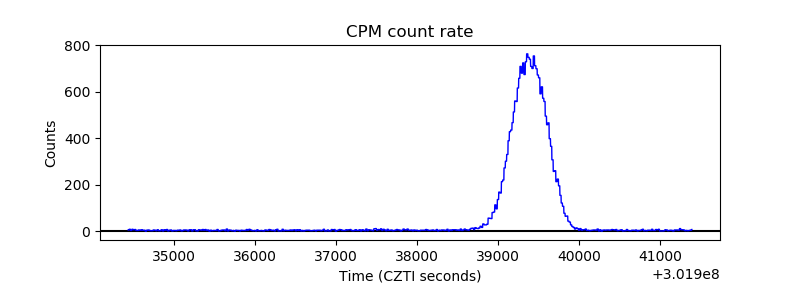 |
| CZT Counter | 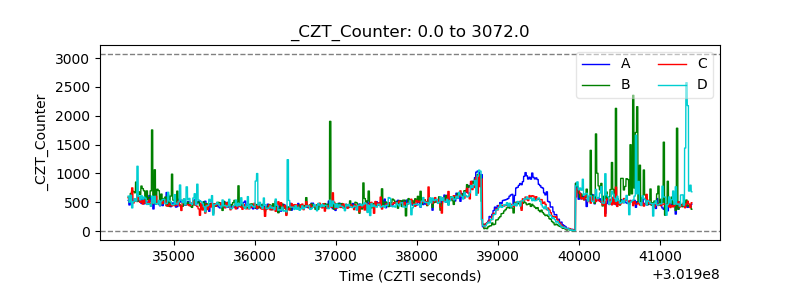 |
| +2.5 Volts monitor |  |
| +5 Volts monitor |  |
| _ROLL_ROT | 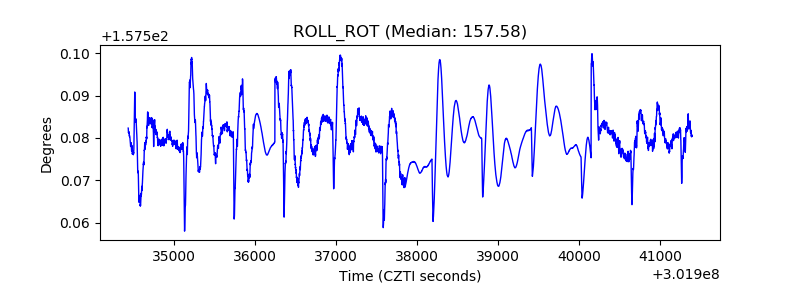 |
| _Roll_DEC | 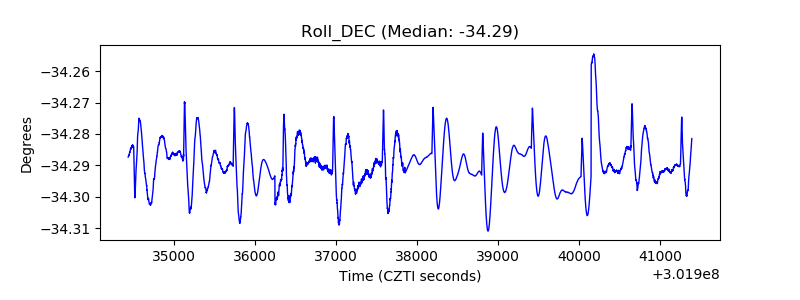 |
| _Roll_RA | 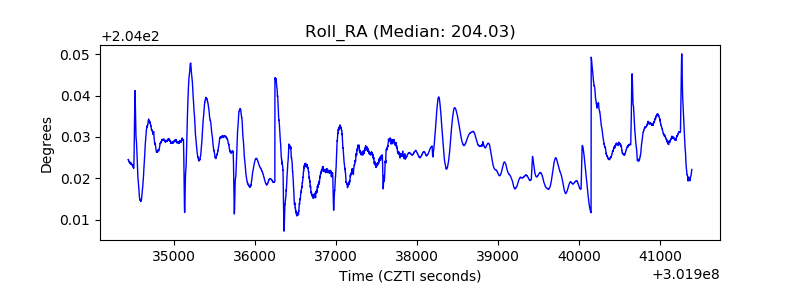 |
| Veto Counter | 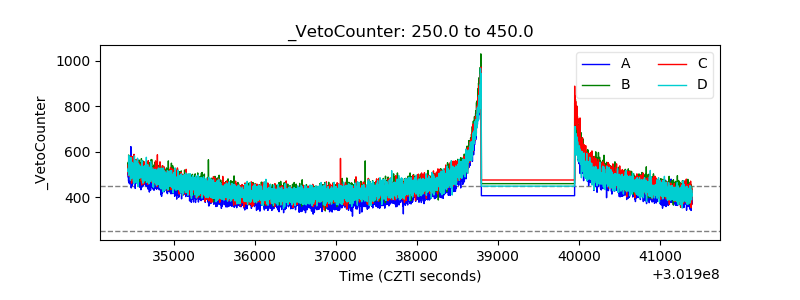 |