| Param | Original file | Final file |
|---|---|---|
| Filename | modeM0/AS1A05_165T07_9000003062_20701cztM0_level2.evt | modeM0/AS1A05_165T07_9000003062_20701cztM0_level2_quad_clean.evt |
| Size (bytes) | 512,893,440 | 90,616,320 |
| Size | 489.1 MB | 86.4 MB |
| Events in quadrant A | 3,055,549 | 598,440 |
| Events in quadrant B | 3,528,692 | 586,825 |
| Events in quadrant C | 3,014,831 | 564,652 |
| Events in quadrant D | 5,500,422 | 548,022 |
| Mode SS | |||
|---|---|---|---|
| Quadrant | BADHDUFLAG | Total packets | Discarded packets |
| A | 0 | 130 | 0 |
| B | 0 | 130 | 0 |
| C | 0 | 130 | 0 |
| D | 0 | 130 | 0 |
| Mode M0 | |||
|---|---|---|---|
| Quadrant | BADHDUFLAG | Total packets | Discarded packets |
| A | 0 | 13159 | 1 |
| B | 0 | 14649 | 1 |
| C | 0 | 13144 | 1 |
| D | 0 | 20717 | 1 |
| Mode M9 | |||
|---|---|---|---|
| Quadrant | BADHDUFLAG | Total packets | Discarded packets |
| A | 0 | 9 | 0 |
| B | 0 | 9 | 0 |
| C | 0 | 9 | 0 |
| D | 0 | 9 | 0 |
| Quadrant | Total seconds | Saturated seconds | Saturation percentage |
|---|---|---|---|
| A | 6393 | 17 | 0.265916% |
| B | 6393 | 128 | 2.002190% |
| C | 6394 | 35 | 0.547388% |
| D | 6394 | 292 | 4.566781% |
Noise dominated data is calculated using 1-second bins in cleaned event files. If a bin has >2000 counts, and if more than 50% of those come from <1% of pixels, then it is considered to be noise-dominated and hence unusable.
| Quadrant | # 1 sec bins | Bins with >0 counts | Bins with >2000 counts | High rate bins dominated by noise | Noise dominated (total time) | Noise dominated (detector-on time) | Marked lightcurve |
|---|---|---|---|---|---|---|---|
| A | 7308 | 6394 | 2 | 2 | 0.03% | 0.03% | 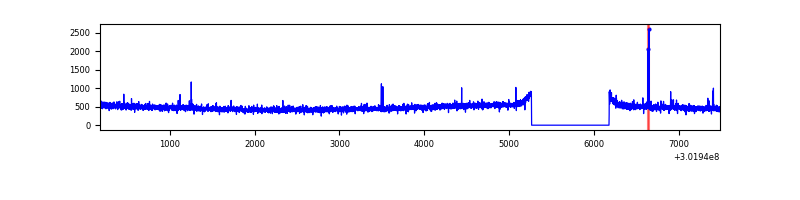 |
| B | 7308 | 6394 | 64 | 64 | 0.88% | 1.00% | 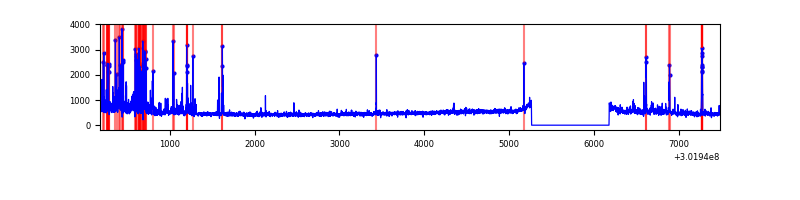 |
| C | 7309 | 6395 | 0 | 0 | 0.00% | 0.00% | 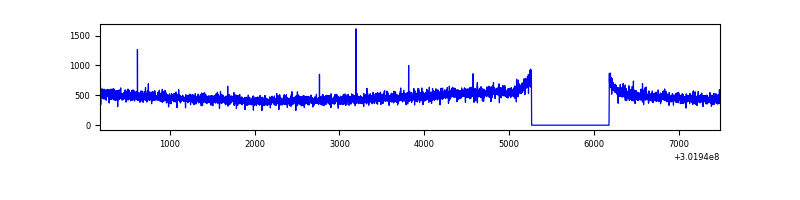 |
| D | 7309 | 6395 | 257 | 257 | 3.52% | 4.02% | 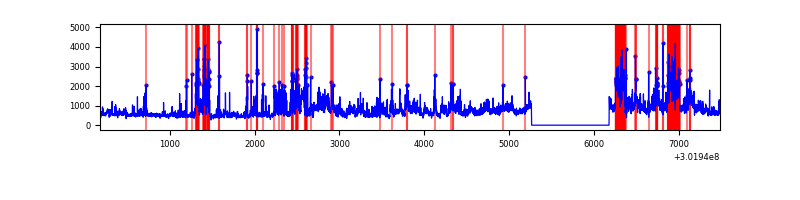 |
Top three noisy pixels from each quadrant. If the there are fewer than three noisy pixels in the level2.evt file, extra rows are filled as -1
| Pixel properties | Quadrant properties | ||||||
|---|---|---|---|---|---|---|---|
| Quadrant | DetID | PixID | Counts | Sigma | Mean | Median | Sigma |
| A | 9 | 143 | 13226 | 78.3 | 789 | 772 | 159.0 |
| A | 5 | 16 | 9931 | 57.59 | 789 | 772 | 159.0 |
| A | 0 | 226 | 6875 | 38.37 | 789 | 772 | 159.0 |
| B | 7 | 220 | 339289 | 2279.02 | 776 | 757 | 148.5 |
| B | 0 | 190 | 46534 | 308.17 | 776 | 757 | 148.5 |
| B | 5 | 172 | 28671 | 187.92 | 776 | 757 | 148.5 |
| C | 14 | 238 | 115766 | 670.72 | 738 | 742 | 171.5 |
| C | 3 | 233 | 10231 | 55.33 | 738 | 742 | 171.5 |
| C | 7 | 247 | 5953 | 30.39 | 738 | 742 | 171.5 |
| D | 5 | 222 | 1086078 | 6013.45 | 746 | 726 | 180.5 |
| D | 12 | 227 | 964797 | 5341.49 | 746 | 726 | 180.5 |
| D | 7 | 38 | 357423 | 1976.3 | 746 | 726 | 180.5 |
Histogram calculated using DETX and DETY for each event in the final _common_clean file
| Quadrant A |  |
 |
Quadrant B |
|---|---|---|---|
| Quadrant D |  |
 |
Quadrant C |
| Plot type | Count rate plots | Images |
|---|---|---|
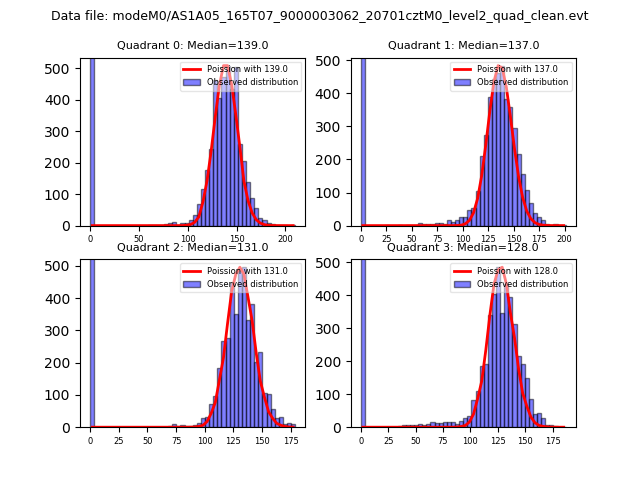
| Comparison with Poisson distribution Blue bars denote a histogram of data divided into 1 sec bins. Red curve is a Poisson curve with rate = median count rate of data. |
 |
 |
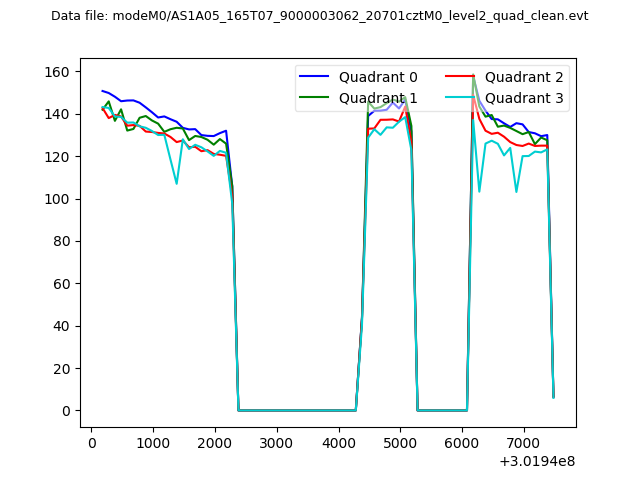
| Quadrant-wise count rates Data is divided into 100 sec bins |
 |
|
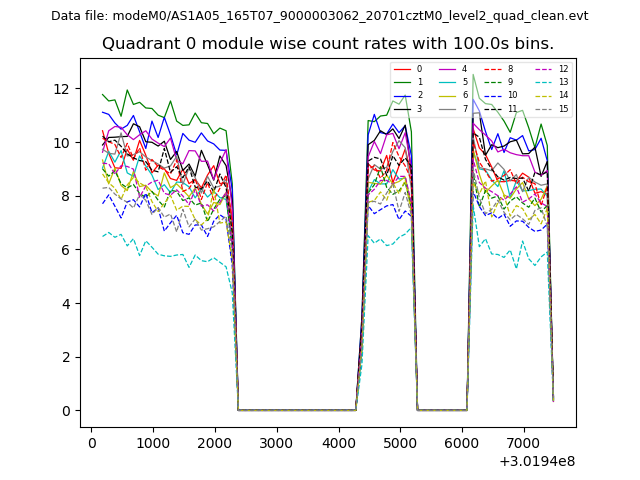
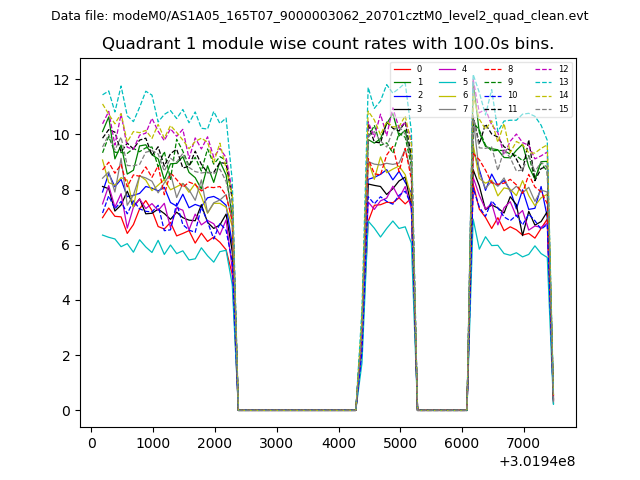
| Module-wise count rates for Quadrant A Data is divided into 100 sec bins |
 |
 |
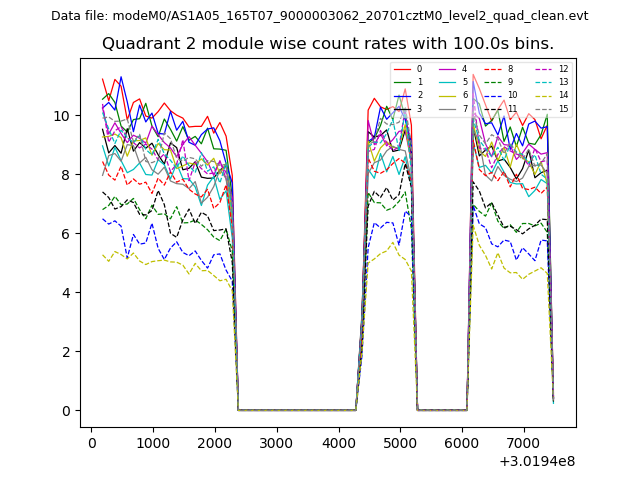
| Module-wise count rates for Quadrant B Data is divided into 100 sec bins |
 |
 |
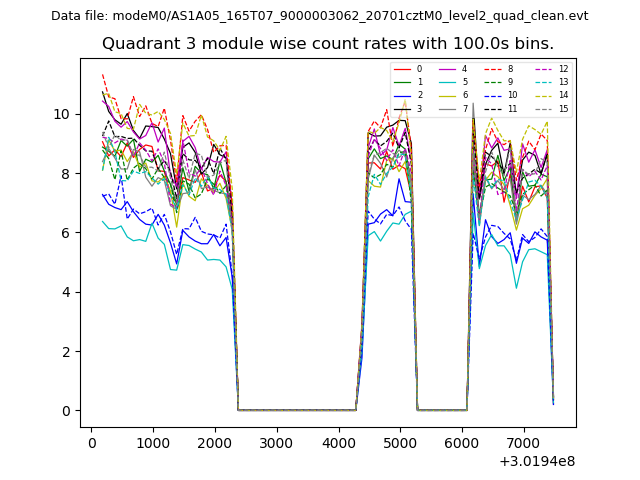
| Module-wise count rates for Quadrant C Data is divided into 100 sec bins |
 |
 |
| Module-wise count rates for Quadrant D Data is divided into 100 sec bins |
 |
 |
| Parameter | Plot |
|---|---|
| CZT HV Monitor | 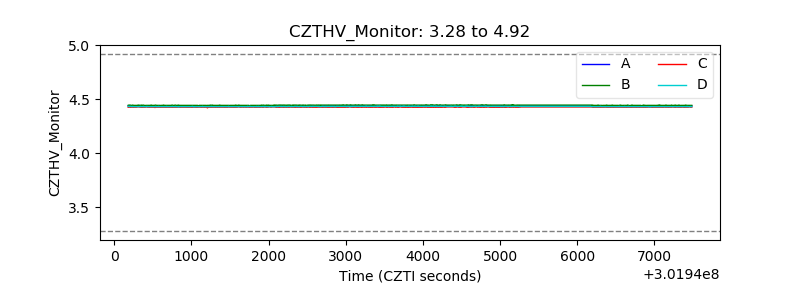 |
| D_VDD | 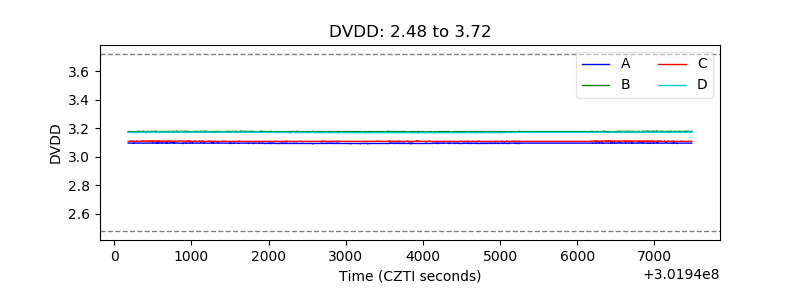 |
| Temperature 1 | 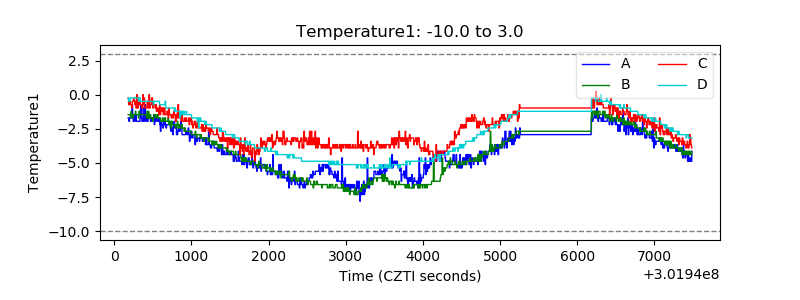 |
| Veto HV Monitor | 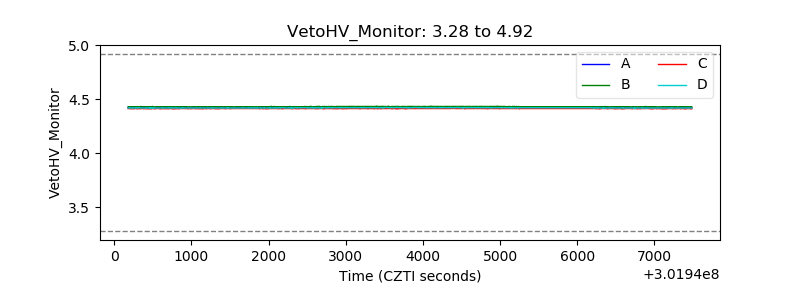 |
| Veto LLD | 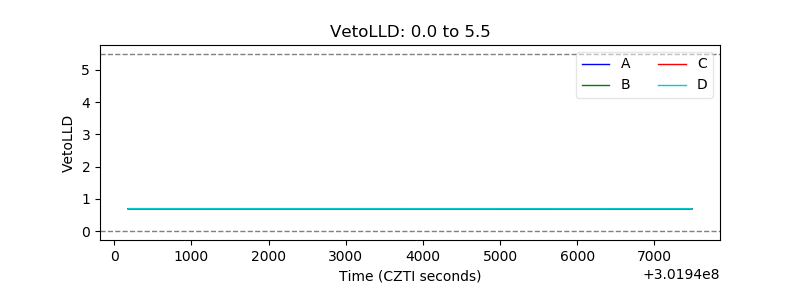 |
| Alpha Counter | 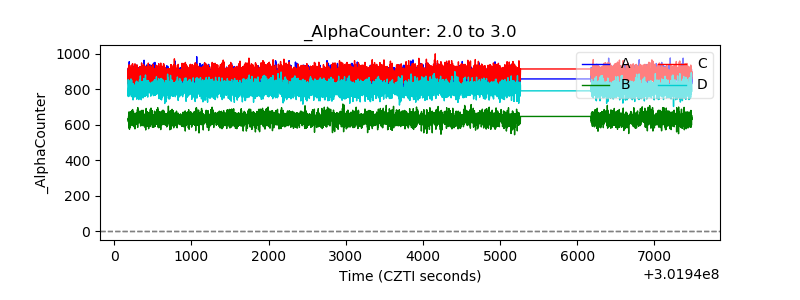 |
| _CPM_Rate | 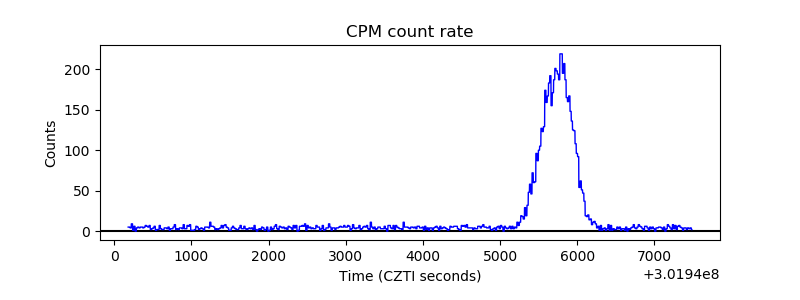 |
| CZT Counter | 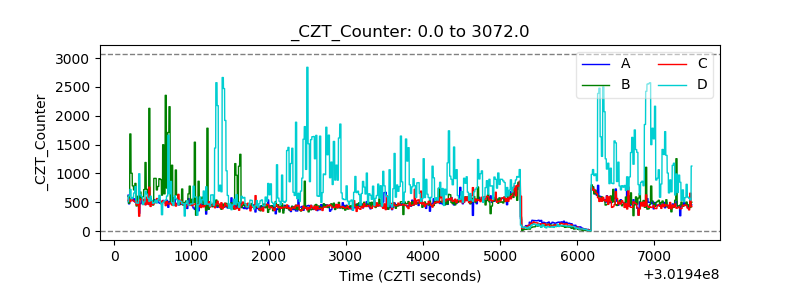 |
| +2.5 Volts monitor |  |
| +5 Volts monitor |  |
| _ROLL_ROT | 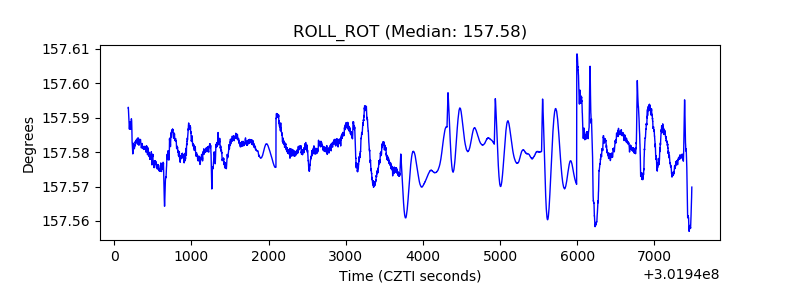 |
| _Roll_DEC | 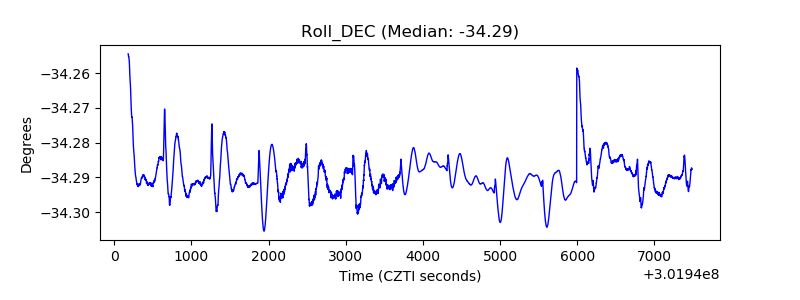 |
| _Roll_RA | 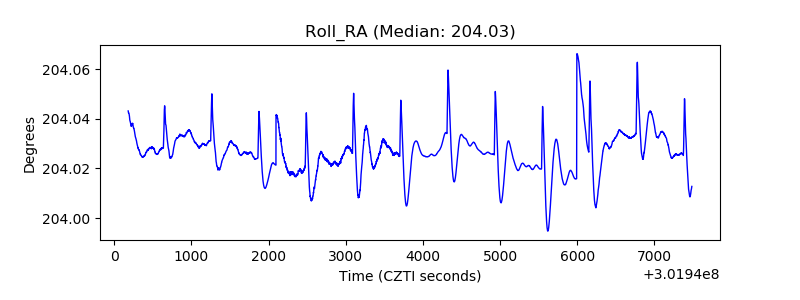 |
| Veto Counter | 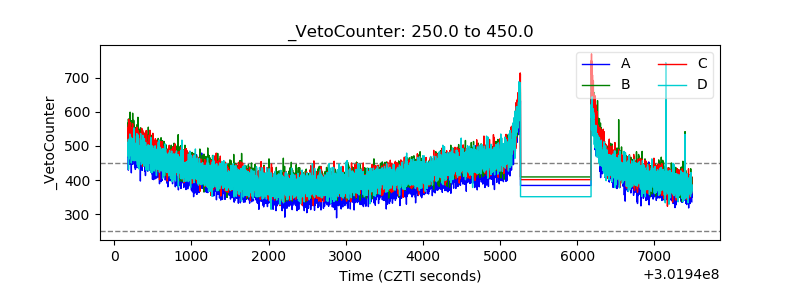 |