| Param | Original file | Final file |
|---|---|---|
| Filename | modeM0/AS1A05_165T07_9000003062_20702cztM0_level2.evt | modeM0/AS1A05_165T07_9000003062_20702cztM0_level2_quad_clean.evt |
| Size (bytes) | 338,558,400 | 70,001,280 |
| Size | 322.9 MB | 66.8 MB |
| Events in quadrant A | 2,129,428 | 469,721 |
| Events in quadrant B | 2,270,062 | 465,319 |
| Events in quadrant C | 2,075,041 | 446,037 |
| Events in quadrant D | 3,473,001 | 423,524 |
| Mode SS | |||
|---|---|---|---|
| Quadrant | BADHDUFLAG | Total packets | Discarded packets |
| A | 0 | 121 | 35 |
| B | 0 | 120 | 30 |
| C | 0 | 121 | 29 |
| D | 0 | 122 | 34 |
| Mode M0 | |||
|---|---|---|---|
| Quadrant | BADHDUFLAG | Total packets | Discarded packets |
| A | 0 | 12322 | 3100 |
| B | 0 | 12802 | 3192 |
| C | 0 | 12194 | 3033 |
| D | 0 | 17085 | 3746 |
| Mode M9 | |||
|---|---|---|---|
| Quadrant | BADHDUFLAG | Total packets | Discarded packets |
| A | 0 | 6 | 2 |
| B | 0 | 7 | 3 |
| C | 0 | 6 | 2 |
| D | 0 | 5 | 1 |
| Quadrant | Total seconds | Saturated seconds | Saturation percentage |
|---|---|---|---|
| A | 4484 | 14 | 0.312221% |
| B | 4480 | 47 | 1.049107% |
| C | 4511 | 16 | 0.354689% |
| D | 4453 | 221 | 4.962946% |
Noise dominated data is calculated using 1-second bins in cleaned event files. If a bin has >2000 counts, and if more than 50% of those come from <1% of pixels, then it is considered to be noise-dominated and hence unusable.
| Quadrant | # 1 sec bins | Bins with >0 counts | Bins with >2000 counts | High rate bins dominated by noise | Noise dominated (total time) | Noise dominated (detector-on time) | Marked lightcurve |
|---|---|---|---|---|---|---|---|
| A | 7261 | 4665 | 4 | 4 | 0.06% | 0.09% | 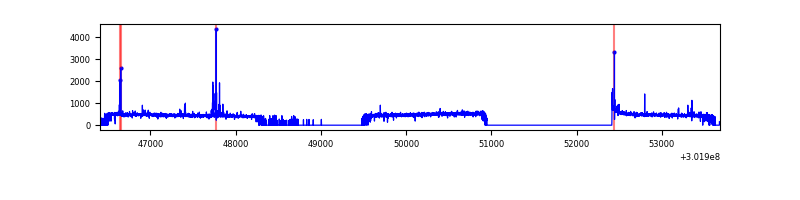 |
| B | 7253 | 4654 | 22 | 22 | 0.30% | 0.47% | 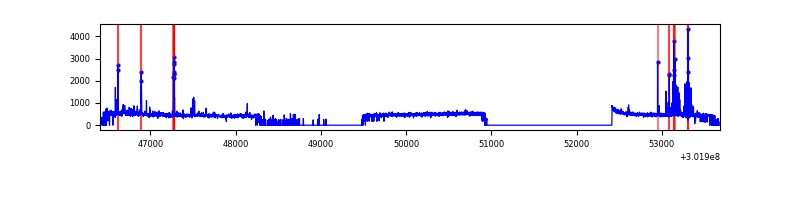 |
| C | 7226 | 4684 | 0 | 0 | 0.00% | 0.00% | 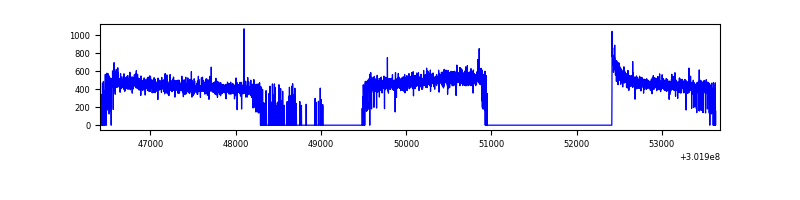 |
| D | 7234 | 4641 | 195 | 195 | 2.70% | 4.20% | 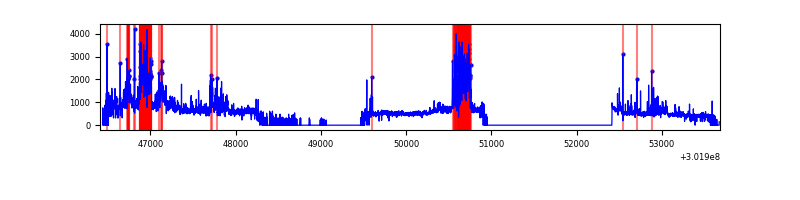 |
Top three noisy pixels from each quadrant. If the there are fewer than three noisy pixels in the level2.evt file, extra rows are filled as -1
| Pixel properties | Quadrant properties | ||||||
|---|---|---|---|---|---|---|---|
| Quadrant | DetID | PixID | Counts | Sigma | Mean | Median | Sigma |
| A | 5 | 16 | 43808 | 390.47 | 539 | 529 | 110.8 |
| A | 9 | 143 | 13144 | 113.82 | 539 | 529 | 110.8 |
| A | 0 | 226 | 4569 | 36.45 | 539 | 529 | 110.8 |
| B | 7 | 220 | 83480 | 810.98 | 531 | 518 | 102.3 |
| B | 0 | 190 | 34641 | 333.56 | 531 | 518 | 102.3 |
| B | 5 | 172 | 27395 | 262.73 | 531 | 518 | 102.3 |
| C | 14 | 238 | 78911 | 656.31 | 508 | 512 | 119.5 |
| C | 3 | 233 | 10332 | 82.21 | 508 | 512 | 119.5 |
| C | 7 | 247 | 3620 | 26.02 | 508 | 512 | 119.5 |
| D | 12 | 227 | 566099 | 4611.11 | 503 | 489 | 122.7 |
| D | 5 | 222 | 541166 | 4407.84 | 503 | 489 | 122.7 |
| D | 13 | 153 | 357431 | 2909.95 | 503 | 489 | 122.7 |
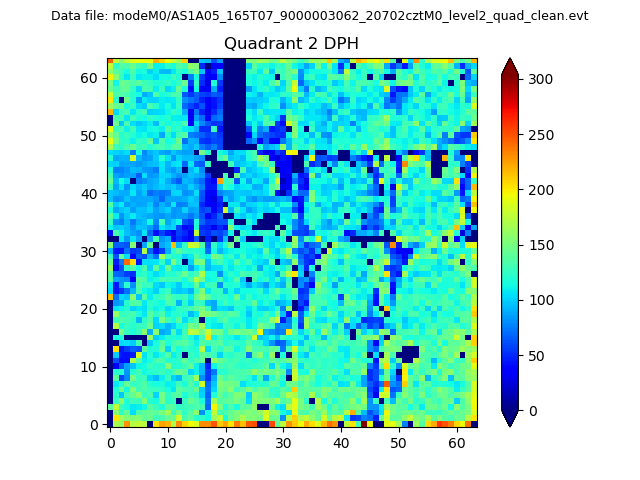
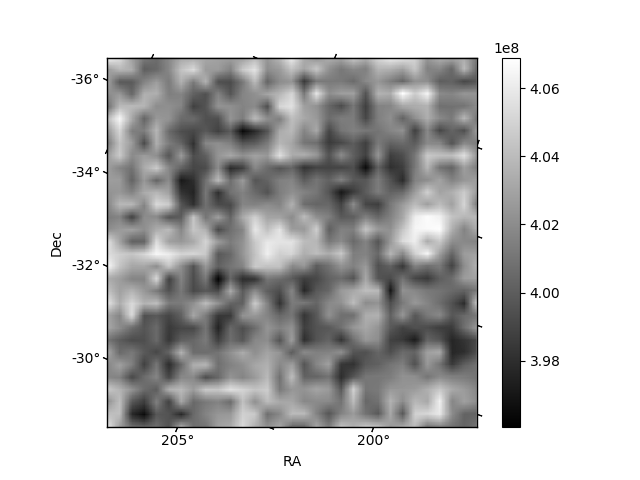
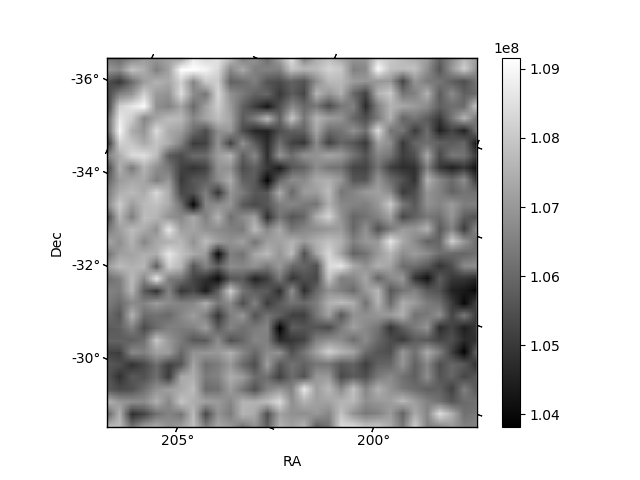
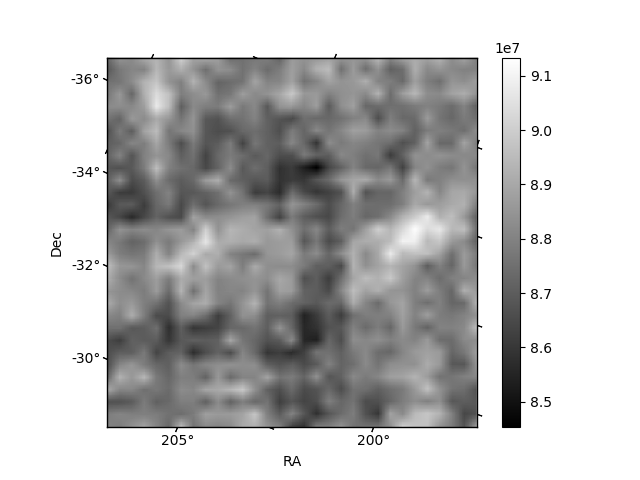
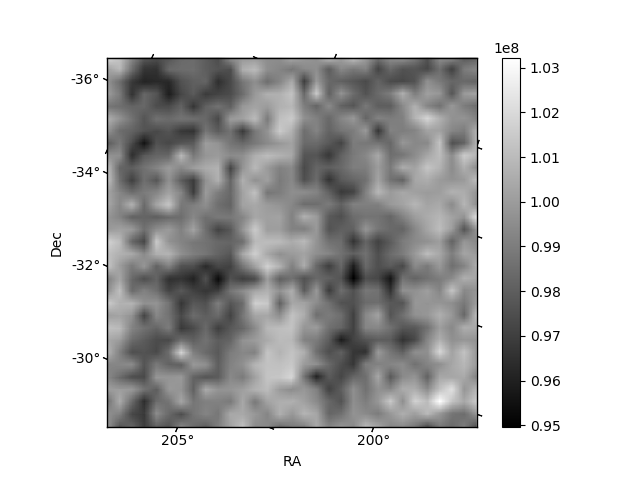
Histogram calculated using DETX and DETY for each event in the final _common_clean file
| Quadrant A | 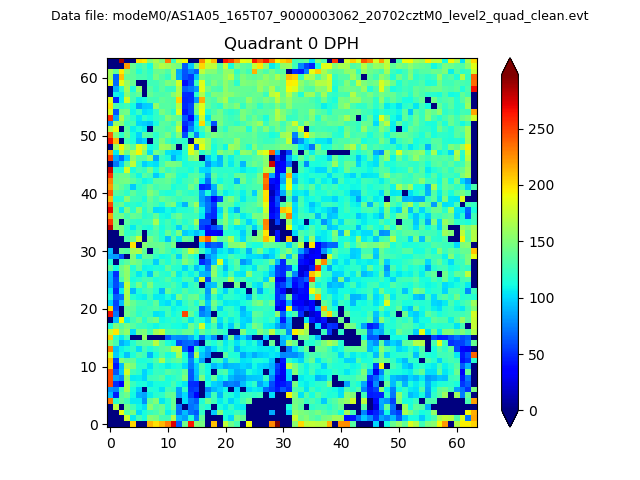 |
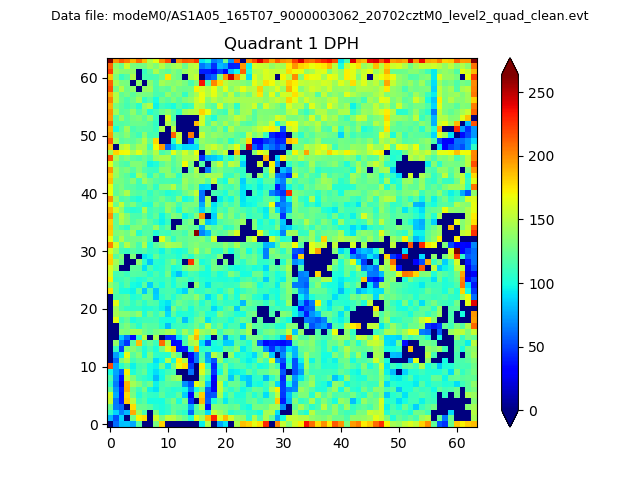 |
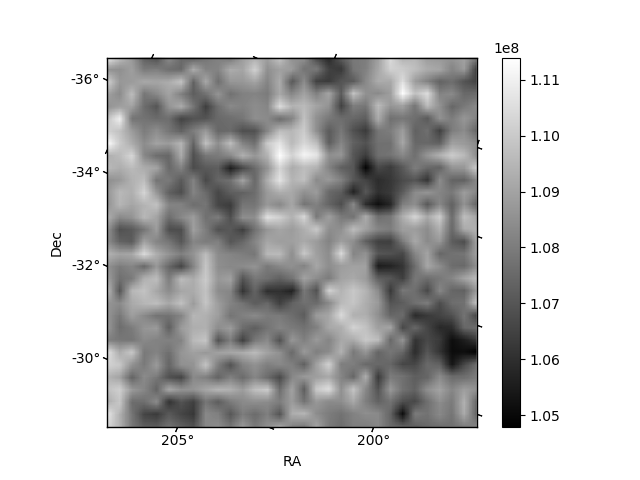
Quadrant B |
|---|---|---|---|
| Quadrant D | 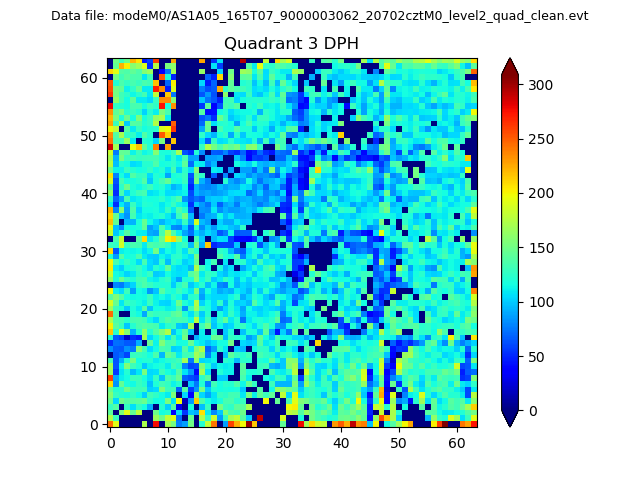 |
 |
Quadrant C |
| Plot type | Count rate plots | Images |
|---|---|---|
| Comparison with Poisson distribution Blue bars denote a histogram of data divided into 1 sec bins. Red curve is a Poisson curve with rate = median count rate of data. |
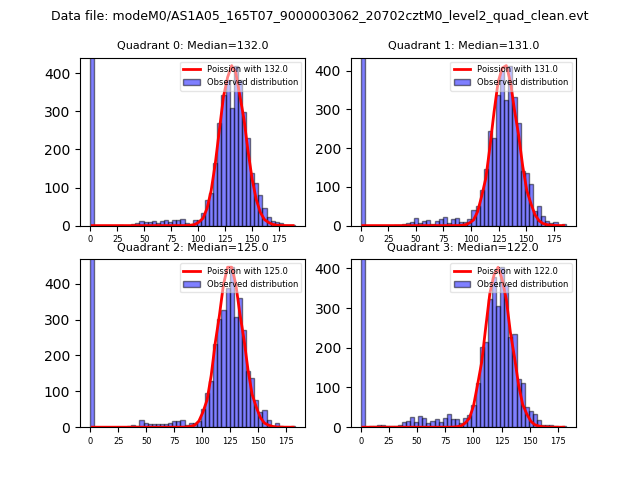 |
 |
| Quadrant-wise count rates Data is divided into 100 sec bins |
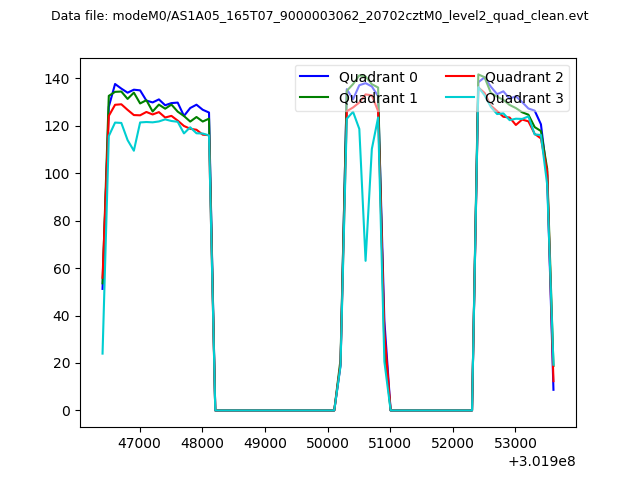 |
|
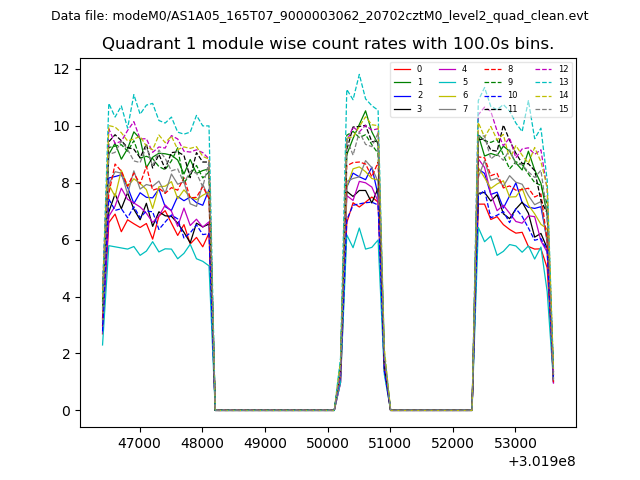
| Module-wise count rates for Quadrant A Data is divided into 100 sec bins |
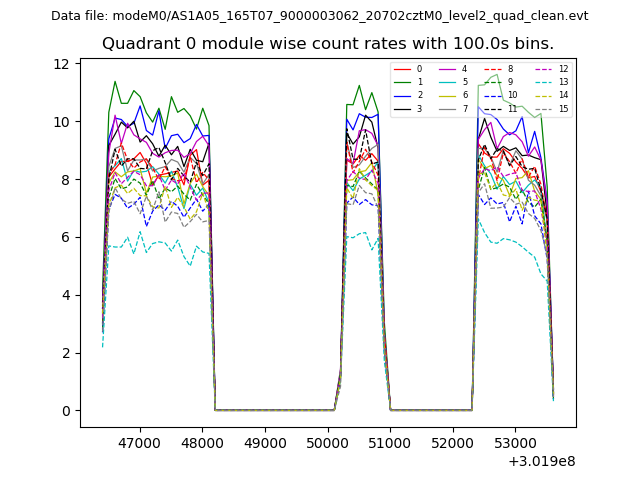 |
 |
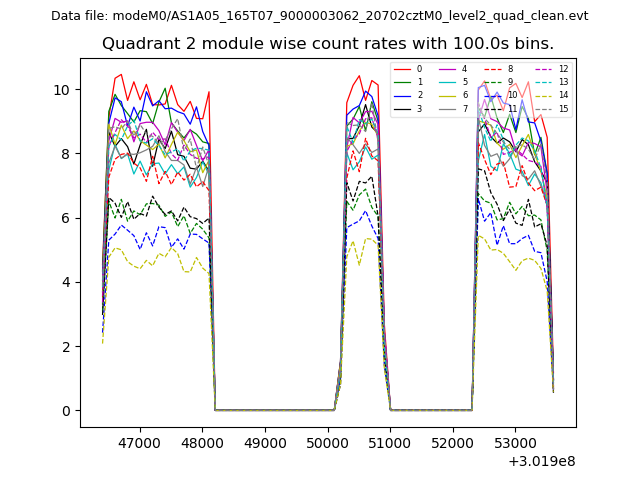
| Module-wise count rates for Quadrant B Data is divided into 100 sec bins |
 |
 |
| Module-wise count rates for Quadrant C Data is divided into 100 sec bins |
 |
 |
| Module-wise count rates for Quadrant D Data is divided into 100 sec bins |
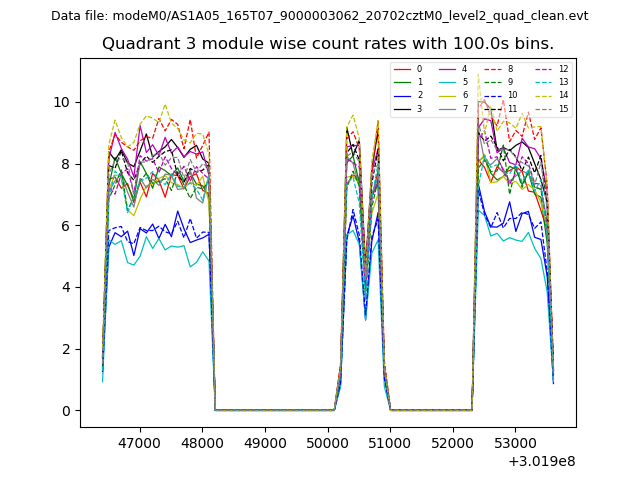 |
 |
| Parameter | Plot |
|---|---|
| CZT HV Monitor |  |
| D_VDD | 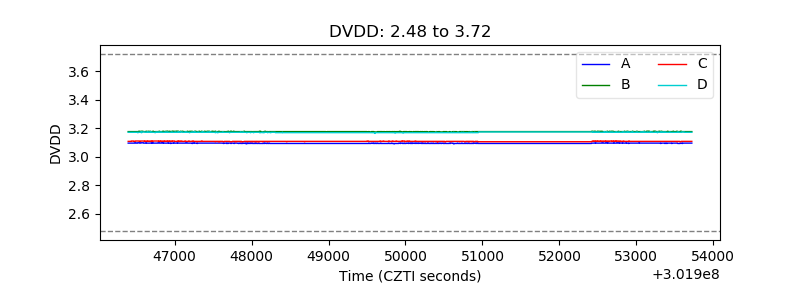 |
| Temperature 1 | 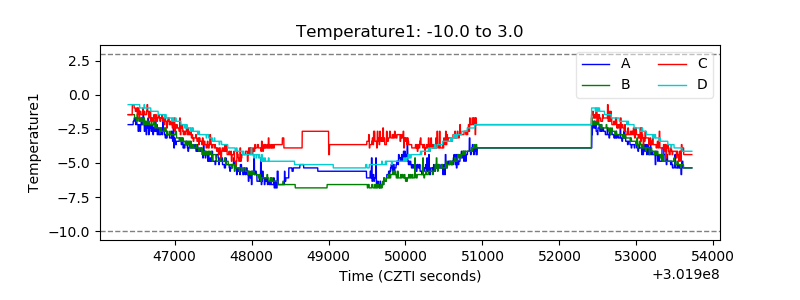 |
| Veto HV Monitor | 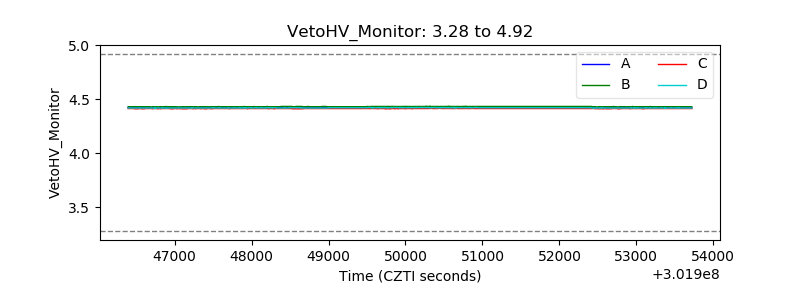 |
| Veto LLD | 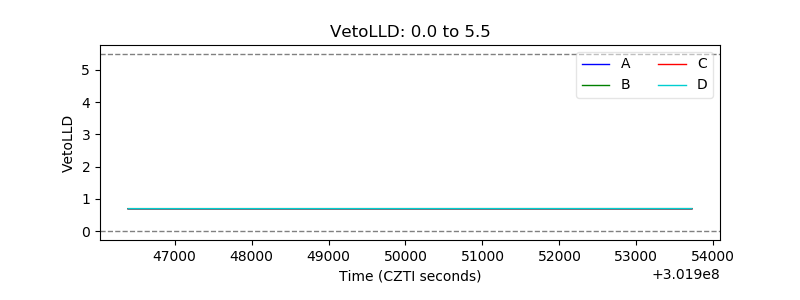 |
| Alpha Counter | 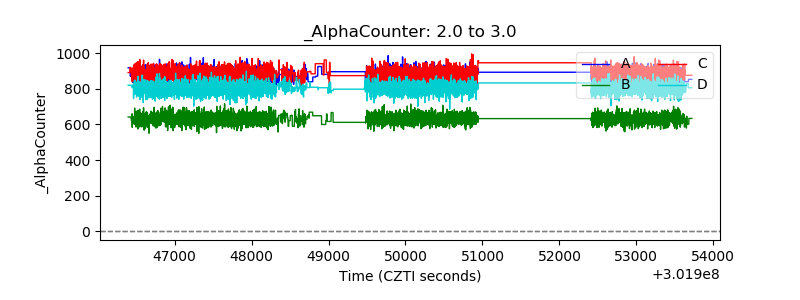 |
| _CPM_Rate | 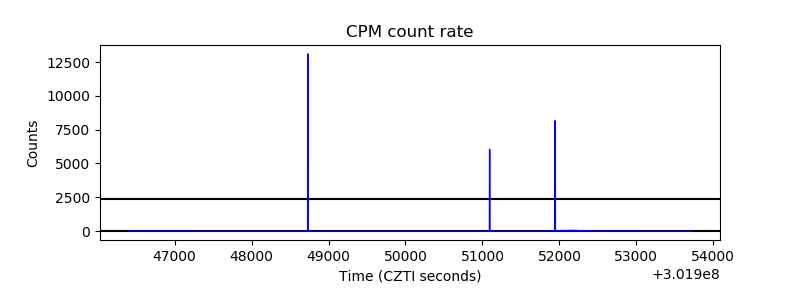 |
| CZT Counter | 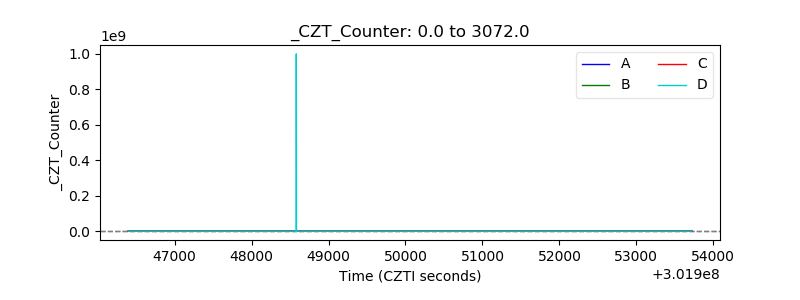 |
| +2.5 Volts monitor |  |
| +5 Volts monitor | 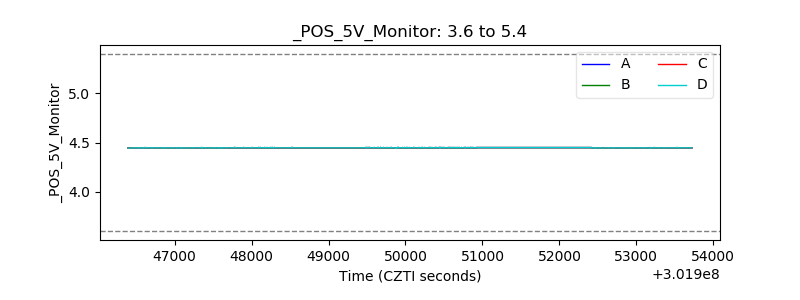 |
| _ROLL_ROT |  |
| _Roll_DEC | 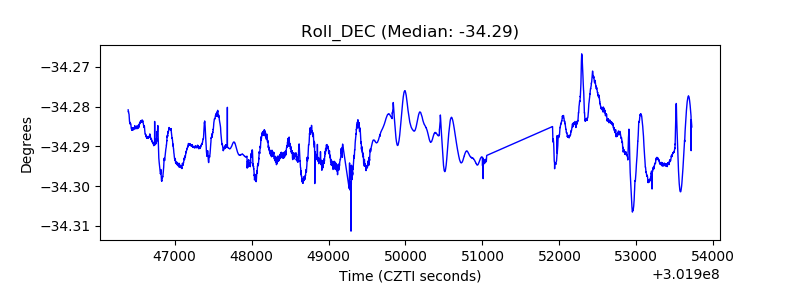 |
| _Roll_RA | 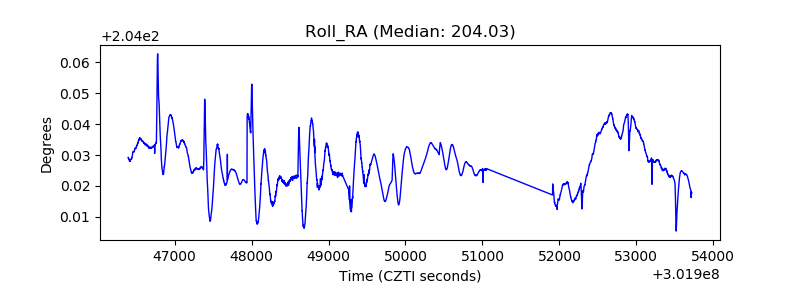 |
| Veto Counter |  |