| Param | Original file | Final file |
|---|---|---|
| Filename | modeM0/AS1A05_165T07_9000003062_20707cztM0_level2.evt | modeM0/AS1A05_165T07_9000003062_20707cztM0_level2_quad_clean.evt |
| Size (bytes) | 1,232,700,480 | 224,591,040 |
| Size | 1.1 GB | 214.2 MB |
| Events in quadrant A | 8,600,042 | 1,419,357 |
| Events in quadrant B | 9,315,457 | 1,409,918 |
| Events in quadrant C | 8,750,337 | 1,355,278 |
| Events in quadrant D | 9,414,041 | 1,341,655 |
| Mode SS | |||
|---|---|---|---|
| Quadrant | BADHDUFLAG | Total packets | Discarded packets |
| A | 0 | 376 | 0 |
| B | 0 | 376 | 0 |
| C | 0 | 376 | 0 |
| D | 0 | 376 | 0 |
| Mode M0 | |||
|---|---|---|---|
| Quadrant | BADHDUFLAG | Total packets | Discarded packets |
| A | 0 | 37755 | 4 |
| B | 0 | 39621 | 4 |
| C | 0 | 37936 | 4 |
| D | 0 | 40533 | 4 |
| Mode M9 | |||
|---|---|---|---|
| Quadrant | BADHDUFLAG | Total packets | Discarded packets |
| A | 0 | 26 | 0 |
| B | 0 | 26 | 0 |
| C | 0 | 26 | 0 |
| D | 0 | 26 | 0 |
| Quadrant | Total seconds | Saturated seconds | Saturation percentage |
|---|---|---|---|
| A | 18523 | 151 | 0.815203% |
| B | 18524 | 271 | 1.462967% |
| C | 18524 | 225 | 1.214640% |
| D | 18524 | 236 | 1.274023% |
Noise dominated data is calculated using 1-second bins in cleaned event files. If a bin has >2000 counts, and if more than 50% of those come from <1% of pixels, then it is considered to be noise-dominated and hence unusable.
| Quadrant | # 1 sec bins | Bins with >0 counts | Bins with >2000 counts | High rate bins dominated by noise | Noise dominated (total time) | Noise dominated (detector-on time) | Marked lightcurve |
|---|---|---|---|---|---|---|---|
| A | 21078 | 18527 | 0 | 0 | 0.00% | 0.00% | 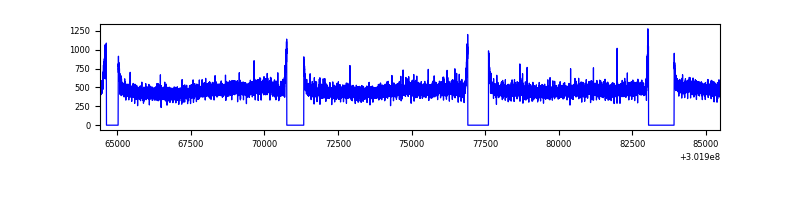 |
| B | 21079 | 18528 | 45 | 45 | 0.21% | 0.24% | 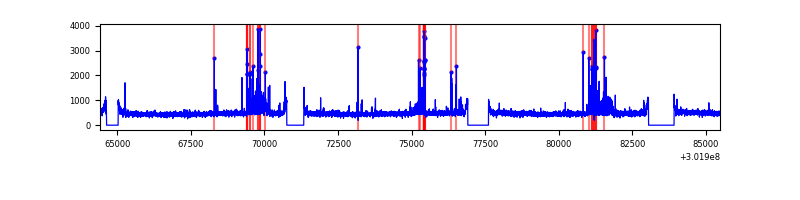 |
| C | 21079 | 18528 | 0 | 0 | 0.00% | 0.00% | 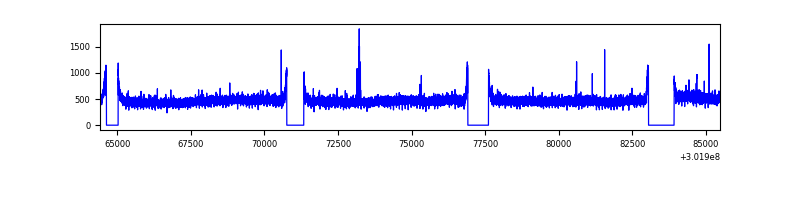 |
| D | 21079 | 18528 | 66 | 66 | 0.31% | 0.36% | 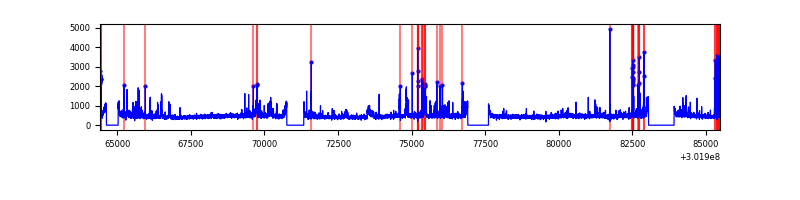 |
Top three noisy pixels from each quadrant. If the there are fewer than three noisy pixels in the level2.evt file, extra rows are filled as -1
| Pixel properties | Quadrant properties | ||||||
|---|---|---|---|---|---|---|---|
| Quadrant | DetID | PixID | Counts | Sigma | Mean | Median | Sigma |
| A | 0 | 226 | 19149 | 37.82 | 2236 | 2190 | 448.4 |
| A | 3 | 137 | 18356 | 36.05 | 2236 | 2190 | 448.4 |
| A | 12 | 194 | 15950 | 30.69 | 2236 | 2190 | 448.4 |
| B | 7 | 220 | 395664 | 937.52 | 2211 | 2151 | 419.7 |
| B | 0 | 197 | 74231 | 171.73 | 2211 | 2151 | 419.7 |
| B | 12 | 111 | 51791 | 118.26 | 2211 | 2151 | 419.7 |
| C | 14 | 238 | 329626 | 659.78 | 2122 | 2134 | 496.4 |
| C | 3 | 233 | 69079 | 134.87 | 2122 | 2134 | 496.4 |
| C | 7 | 247 | 28777 | 53.68 | 2122 | 2134 | 496.4 |
| D | 2 | 165 | 394192 | 751.52 | 2154 | 2095 | 521.7 |
| D | 1 | 52 | 271703 | 516.75 | 2154 | 2095 | 521.7 |
| D | 5 | 222 | 163133 | 308.66 | 2154 | 2095 | 521.7 |
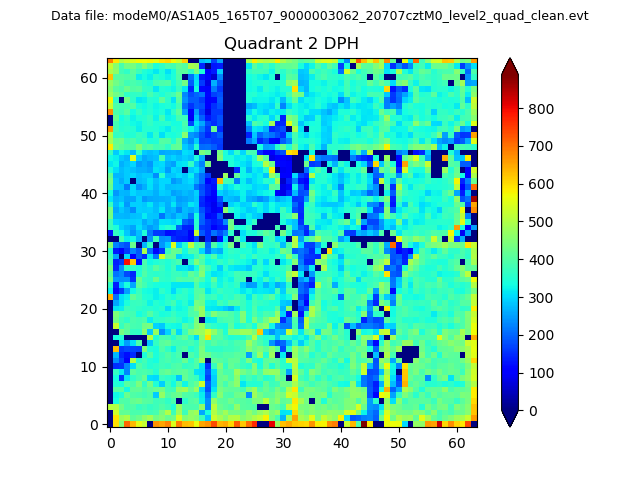
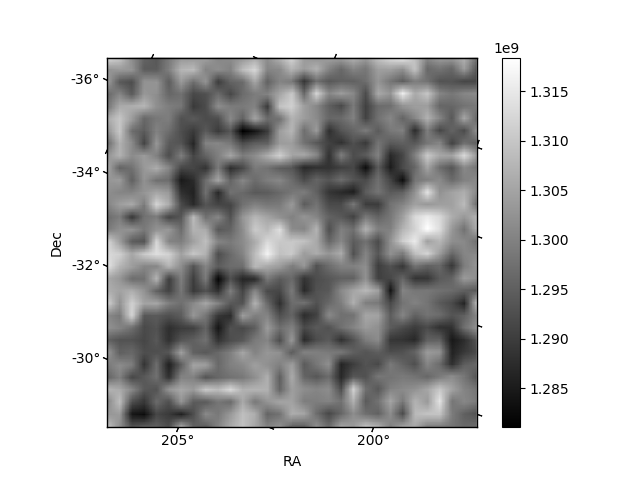
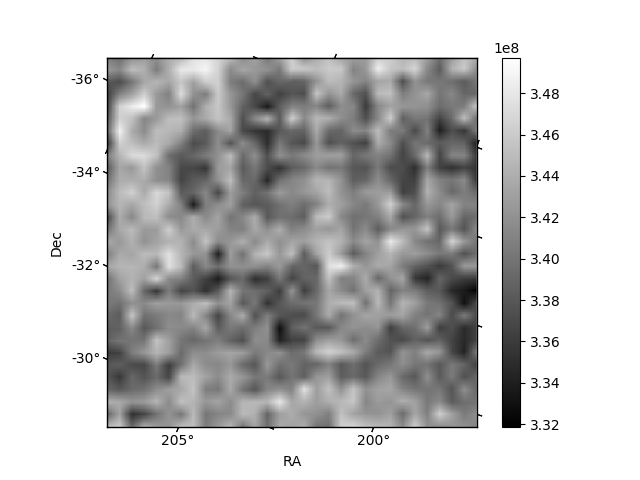
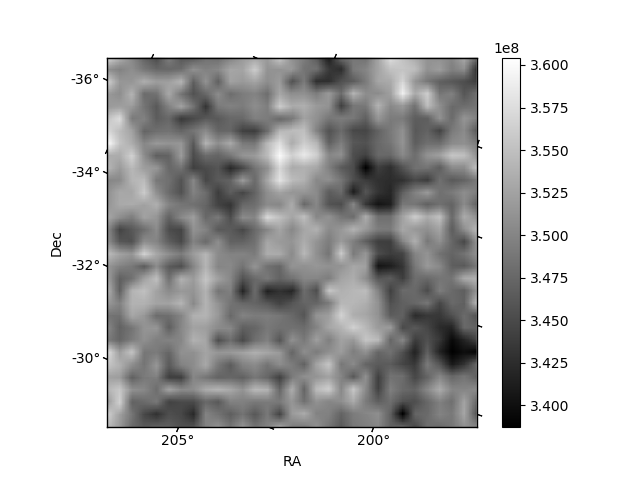
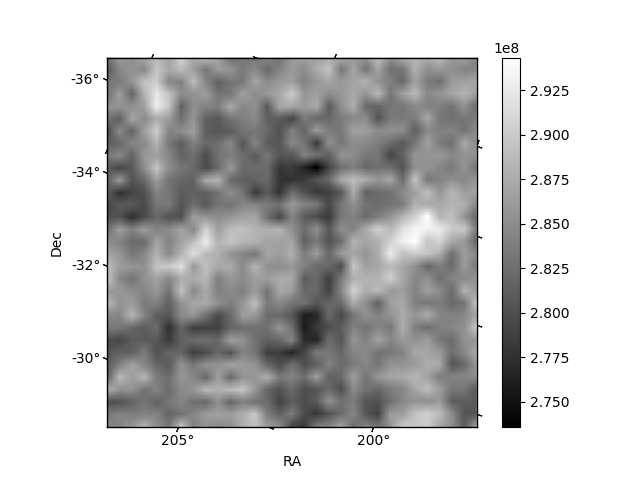
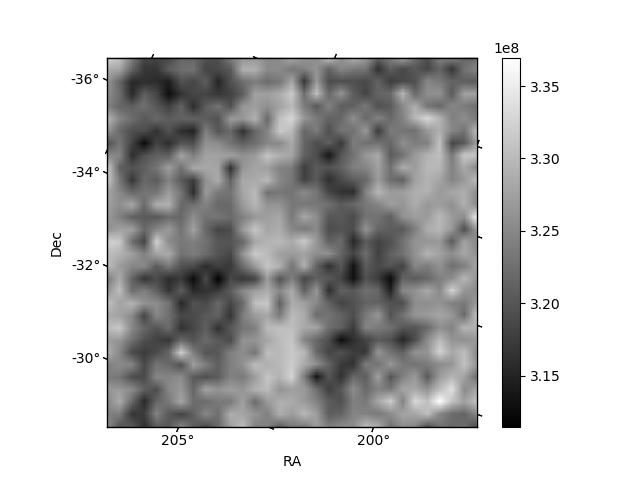
Histogram calculated using DETX and DETY for each event in the final _common_clean file
| Quadrant A | 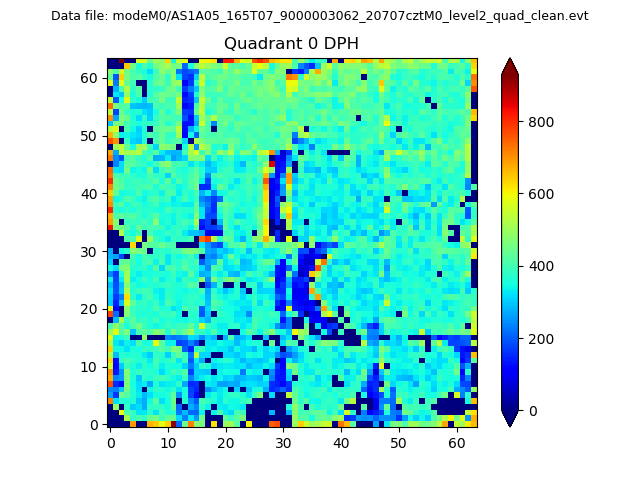 |
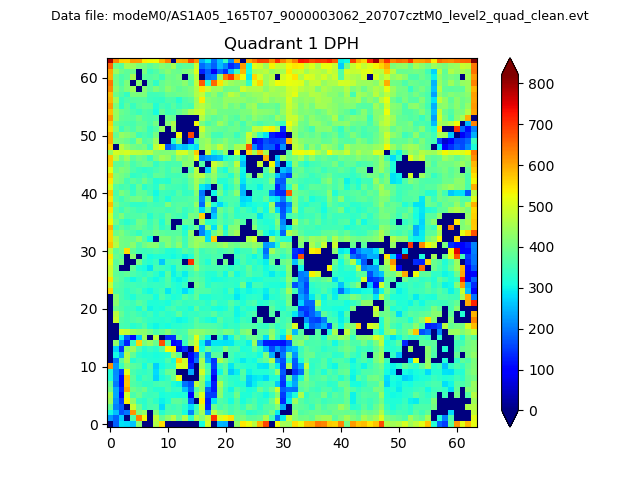 |
Quadrant B |
|---|---|---|---|
| Quadrant D | 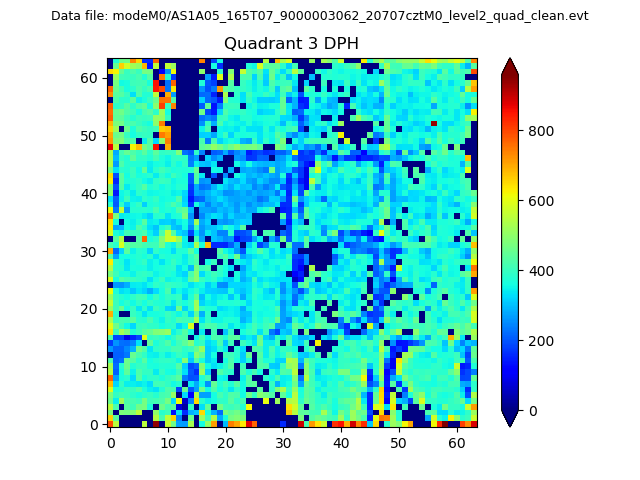 |
 |
Quadrant C |
| Plot type | Count rate plots | Images |
|---|---|---|
| Comparison with Poisson distribution Blue bars denote a histogram of data divided into 1 sec bins. Red curve is a Poisson curve with rate = median count rate of data. |
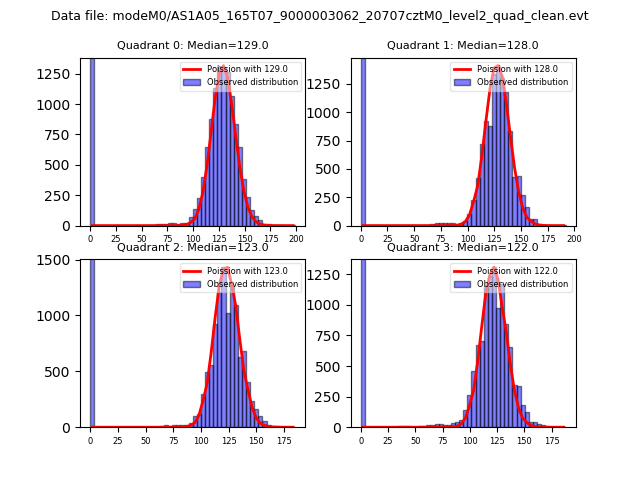 |
 |
| Quadrant-wise count rates Data is divided into 100 sec bins |
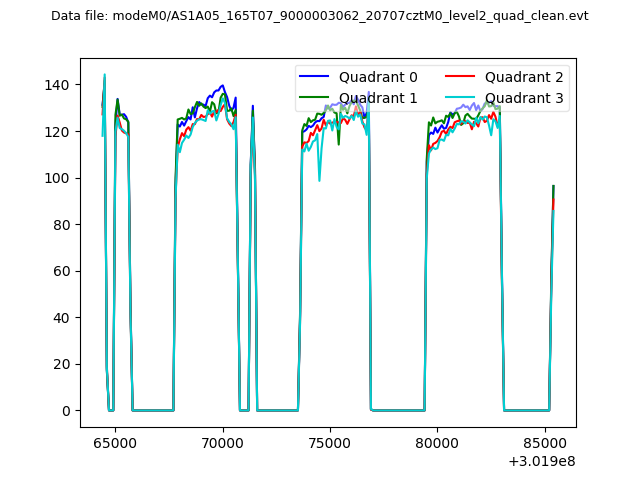 |
|
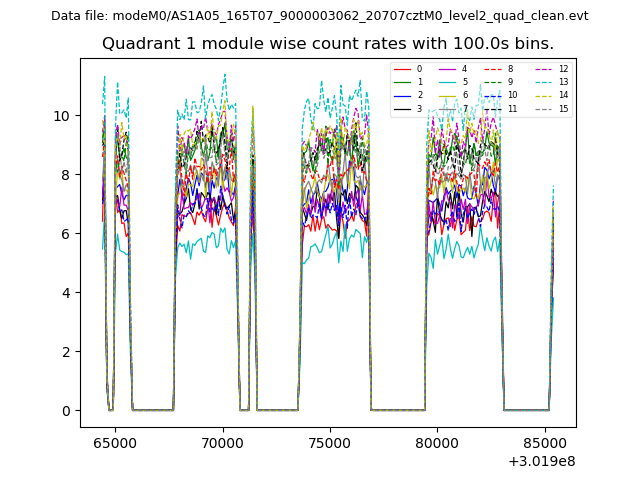
| Module-wise count rates for Quadrant A Data is divided into 100 sec bins |
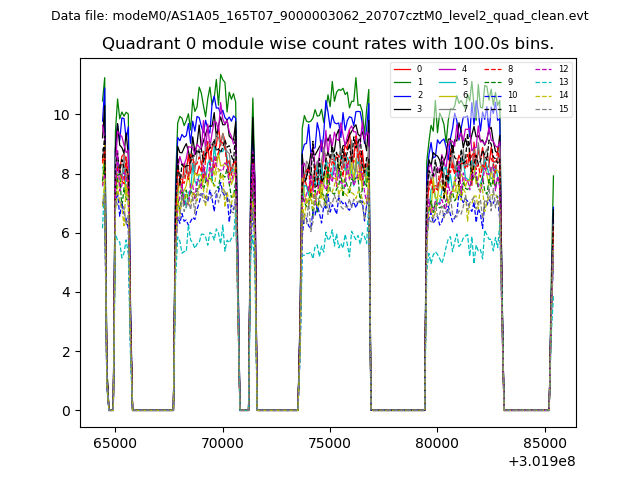 |
 |
| Module-wise count rates for Quadrant B Data is divided into 100 sec bins |
 |
 |
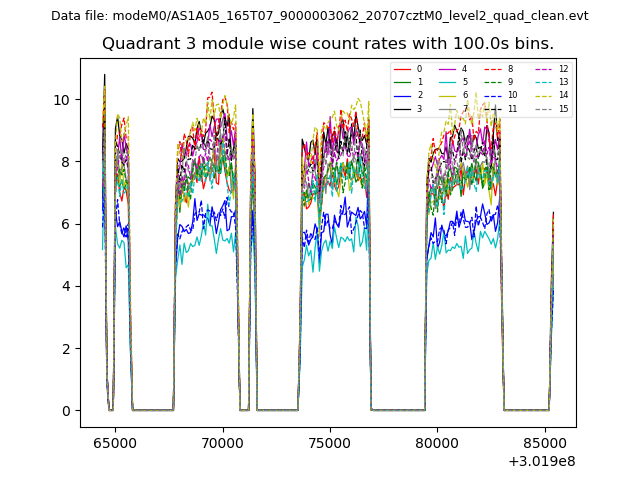
| Module-wise count rates for Quadrant C Data is divided into 100 sec bins |
 |
 |
| Module-wise count rates for Quadrant D Data is divided into 100 sec bins |
 |
 |
| Parameter | Plot |
|---|---|
| CZT HV Monitor | 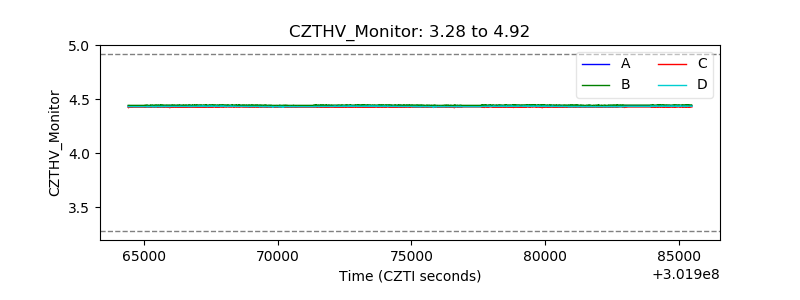 |
| D_VDD | 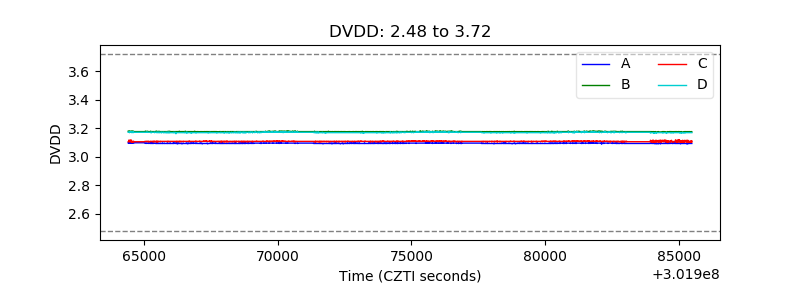 |
| Temperature 1 | 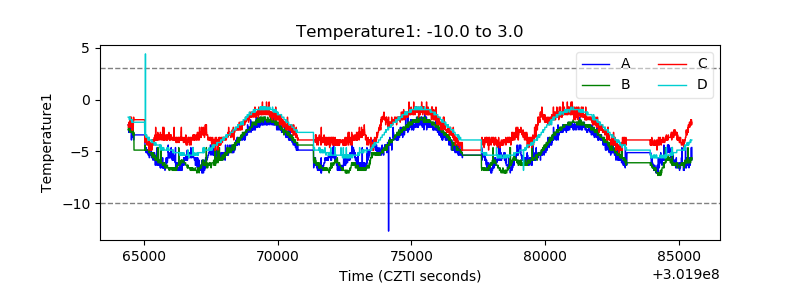 |
| Veto HV Monitor | 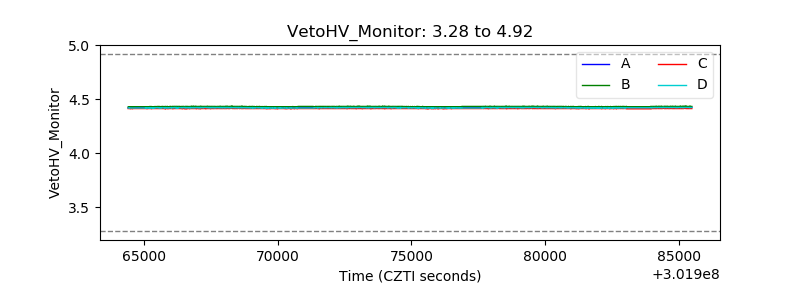 |
| Veto LLD | 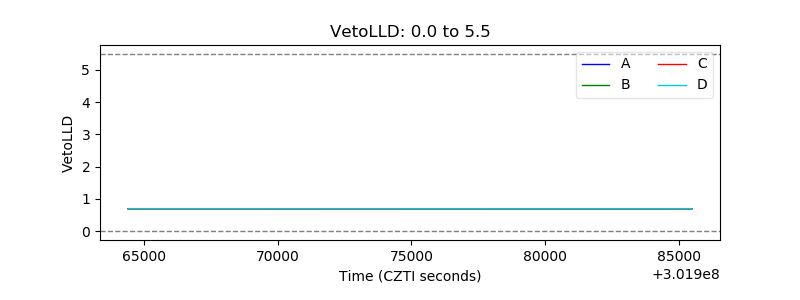 |
| Alpha Counter | 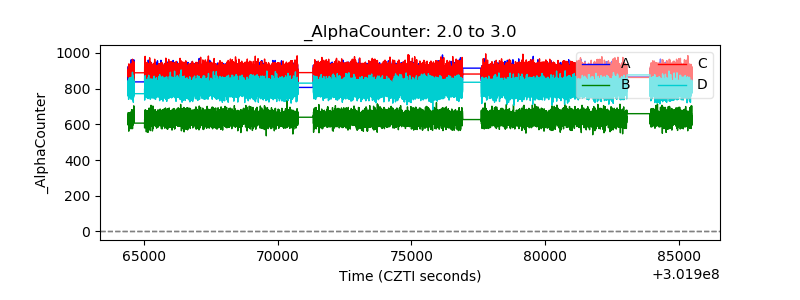 |
| _CPM_Rate | 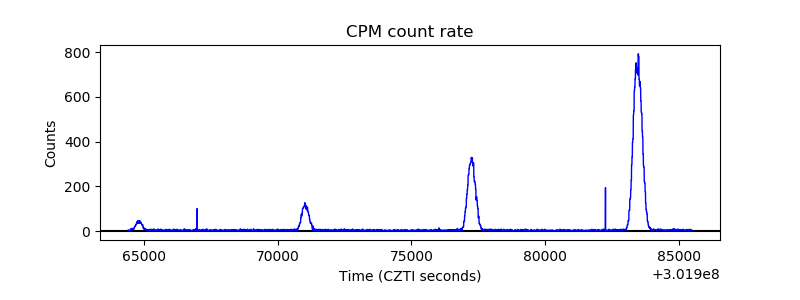 |
| CZT Counter |  |
| +2.5 Volts monitor |  |
| +5 Volts monitor |  |
| _ROLL_ROT | 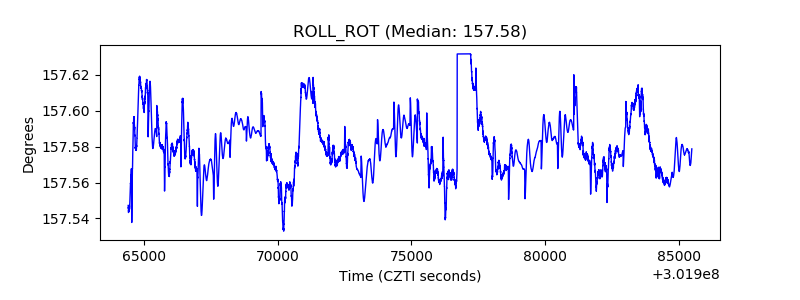 |
| _Roll_DEC | 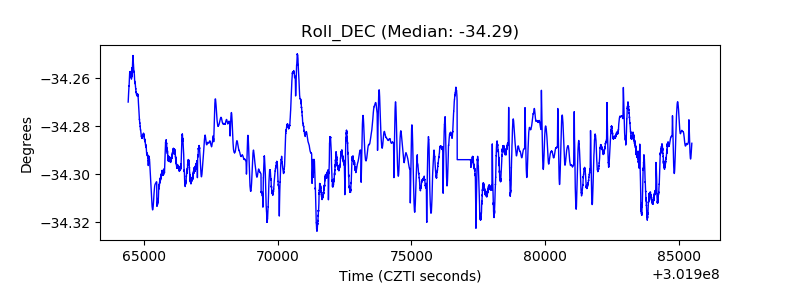 |
| _Roll_RA | 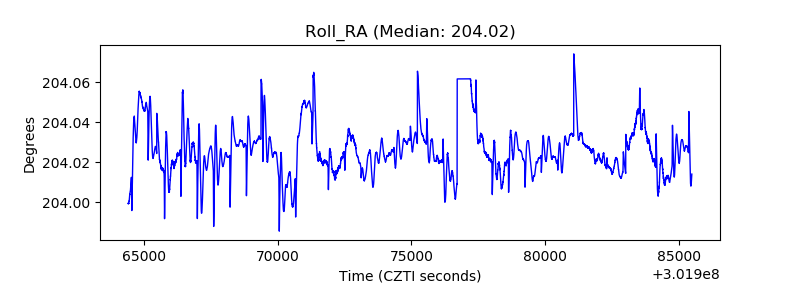 |
| Veto Counter | 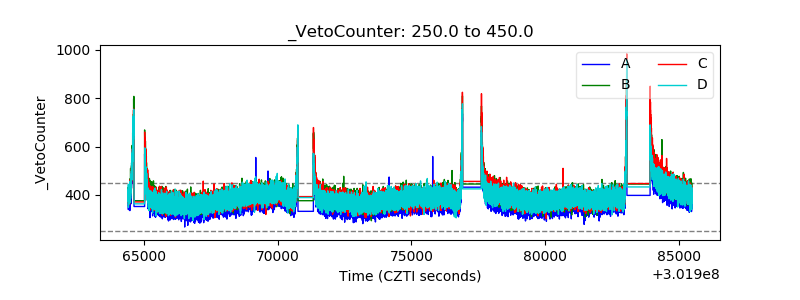 |