| Param | Original file | Final file |
|---|---|---|
| Filename | modeM0/AS1A05_165T07_9000003062_20708cztM0_level2.evt | modeM0/AS1A05_165T07_9000003062_20708cztM0_level2_quad_clean.evt |
| Size (bytes) | 2,924,280,000 | 523,114,560 |
| Size | 2.7 GB | 498.9 MB |
| Events in quadrant A | 18,963,058 | 3,374,149 |
| Events in quadrant B | 20,716,859 | 3,342,236 |
| Events in quadrant C | 19,191,398 | 3,215,392 |
| Events in quadrant D | 26,949,959 | 3,123,217 |
| Mode SS | |||
|---|---|---|---|
| Quadrant | BADHDUFLAG | Total packets | Discarded packets |
| A | 0 | 824 | 0 |
| B | 0 | 824 | 0 |
| C | 0 | 824 | 0 |
| D | 0 | 824 | 0 |
| Mode M0 | |||
|---|---|---|---|
| Quadrant | BADHDUFLAG | Total packets | Discarded packets |
| A | 0 | 82956 | 7 |
| B | 0 | 87818 | 7 |
| C | 0 | 83232 | 8 |
| D | 0 | 107538 | 7 |
| Mode M9 | |||
|---|---|---|---|
| Quadrant | BADHDUFLAG | Total packets | Discarded packets |
| A | 0 | 46 | 0 |
| B | 0 | 46 | 0 |
| C | 0 | 46 | 0 |
| D | 0 | 46 | 0 |
| Quadrant | Total seconds | Saturated seconds | Saturation percentage |
|---|---|---|---|
| A | 40633 | 246 | 0.605419% |
| B | 40634 | 558 | 1.373234% |
| C | 40633 | 370 | 0.910590% |
| D | 40633 | 1488 | 3.662048% |
Noise dominated data is calculated using 1-second bins in cleaned event files. If a bin has >2000 counts, and if more than 50% of those come from <1% of pixels, then it is considered to be noise-dominated and hence unusable.
| Quadrant | # 1 sec bins | Bins with >0 counts | Bins with >2000 counts | High rate bins dominated by noise | Noise dominated (total time) | Noise dominated (detector-on time) | Marked lightcurve |
|---|---|---|---|---|---|---|---|
| A | 45113 | 40639 | 5 | 5 | 0.01% | 0.01% | 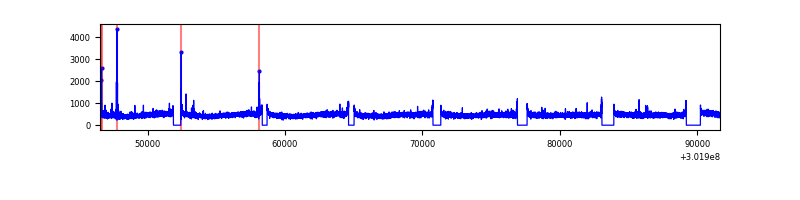 |
| B | 45114 | 40641 | 141 | 141 | 0.31% | 0.35% | 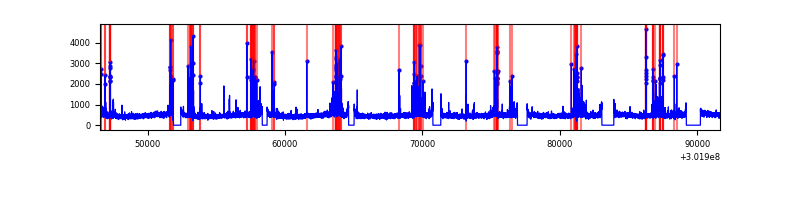 |
| C | 45113 | 40640 | 0 | 0 | 0.00% | 0.00% | 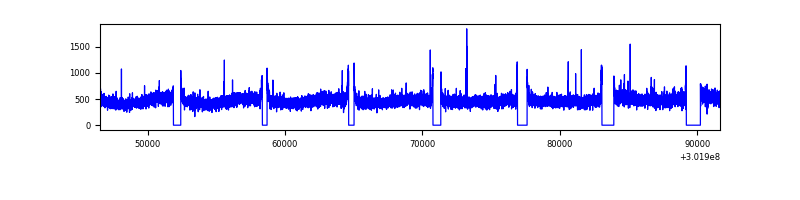 |
| D | 45113 | 40640 | 1211 | 1211 | 2.68% | 2.98% | 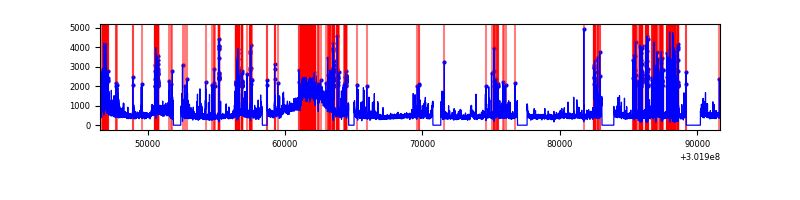 |
Top three noisy pixels from each quadrant. If the there are fewer than three noisy pixels in the level2.evt file, extra rows are filled as -1
| Pixel properties | Quadrant properties | ||||||
|---|---|---|---|---|---|---|---|
| Quadrant | DetID | PixID | Counts | Sigma | Mean | Median | Sigma |
| A | 5 | 16 | 76192 | 72.87 | 4909 | 4815 | 979.5 |
| A | 0 | 226 | 41980 | 37.94 | 4909 | 4815 | 979.5 |
| A | 3 | 137 | 40195 | 36.12 | 4909 | 4815 | 979.5 |
| B | 7 | 220 | 991233 | 1081.43 | 4847 | 4727 | 912.2 |
| B | 0 | 197 | 183466 | 195.94 | 4847 | 4727 | 912.2 |
| B | 3 | 64 | 114078 | 119.87 | 4847 | 4727 | 912.2 |
| C | 14 | 238 | 723867 | 667.62 | 4646 | 4674 | 1077.3 |
| C | 3 | 233 | 197287 | 178.8 | 4646 | 4674 | 1077.3 |
| C | 7 | 247 | 50101 | 42.17 | 4646 | 4674 | 1077.3 |
| D | 1 | 20 | 3631533 | 3211.17 | 4685 | 4554 | 1129.5 |
| D | 5 | 222 | 1832646 | 1618.52 | 4685 | 4554 | 1129.5 |
| D | 1 | 52 | 1700545 | 1501.56 | 4685 | 4554 | 1129.5 |
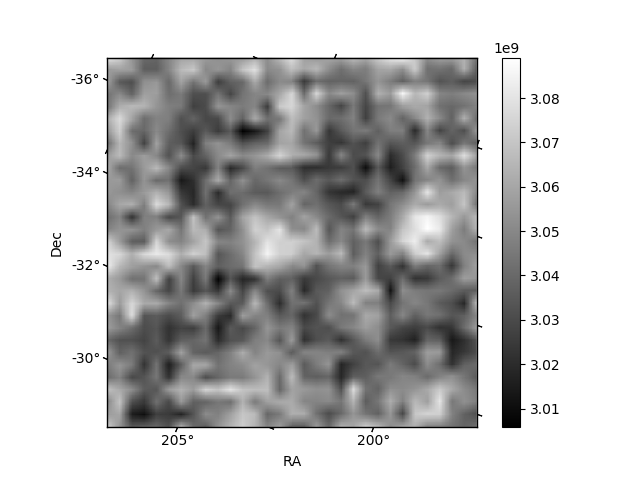
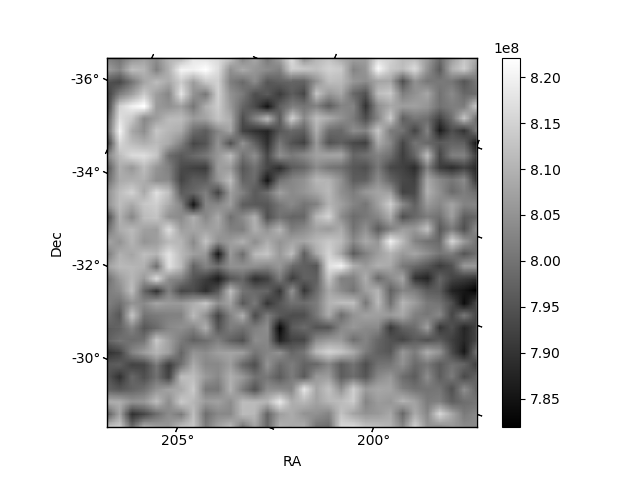
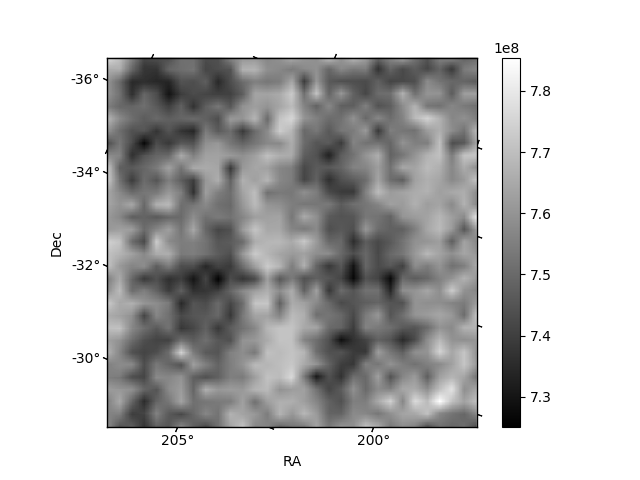
Histogram calculated using DETX and DETY for each event in the final _common_clean file
| Quadrant A | 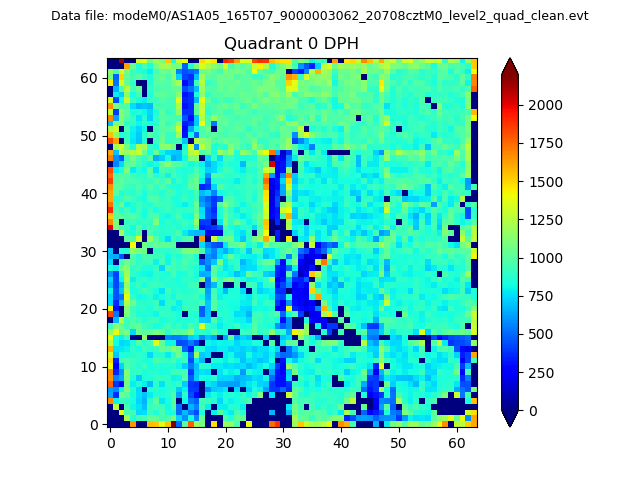 |
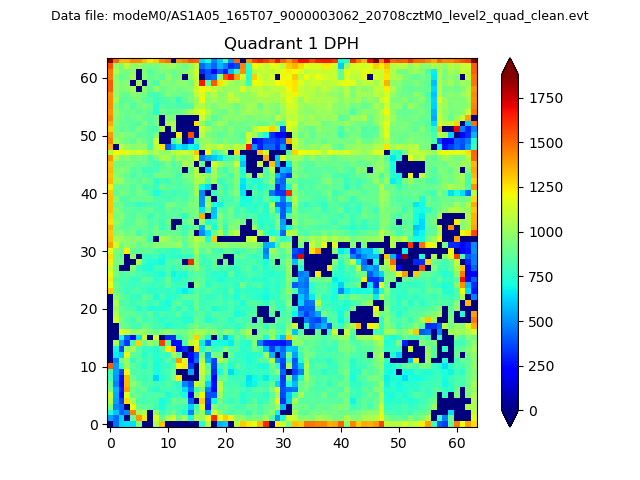 |
Quadrant B |
|---|---|---|---|
| Quadrant D | 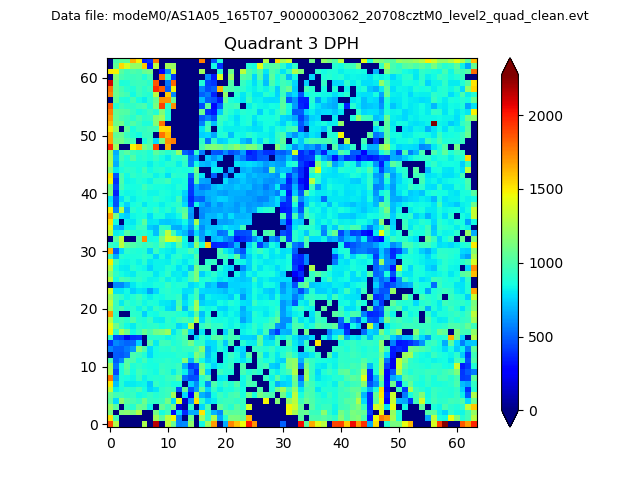 |
 |
Quadrant C |
| Plot type | Count rate plots | Images |
|---|---|---|
| Comparison with Poisson distribution Blue bars denote a histogram of data divided into 1 sec bins. Red curve is a Poisson curve with rate = median count rate of data. |
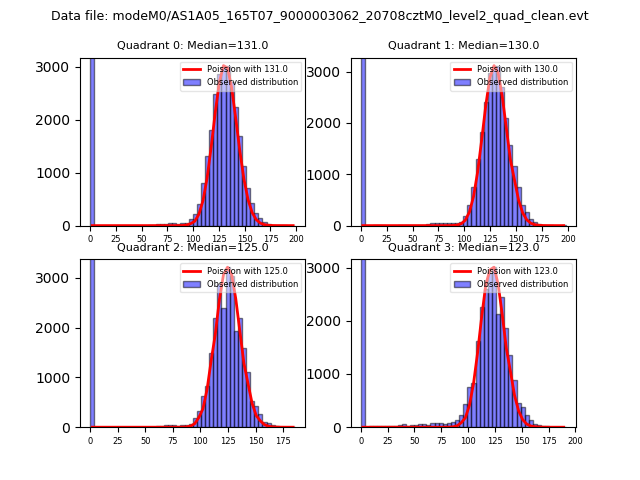 |
 |
| Quadrant-wise count rates Data is divided into 100 sec bins |
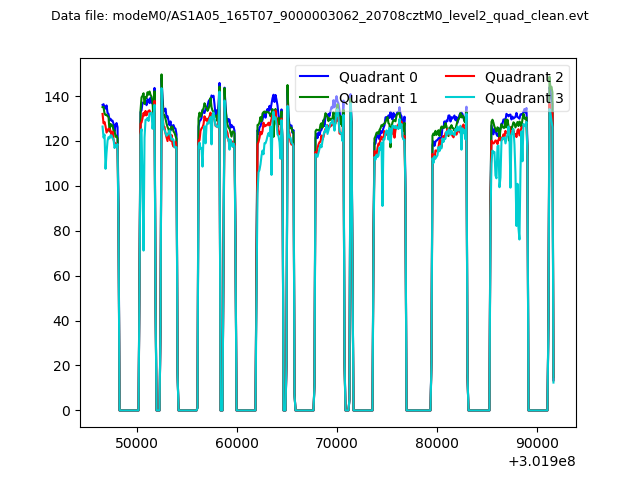 |
|
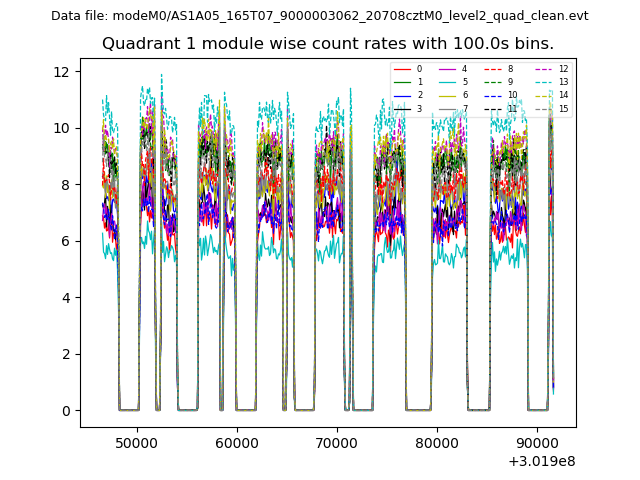
| Module-wise count rates for Quadrant A Data is divided into 100 sec bins |
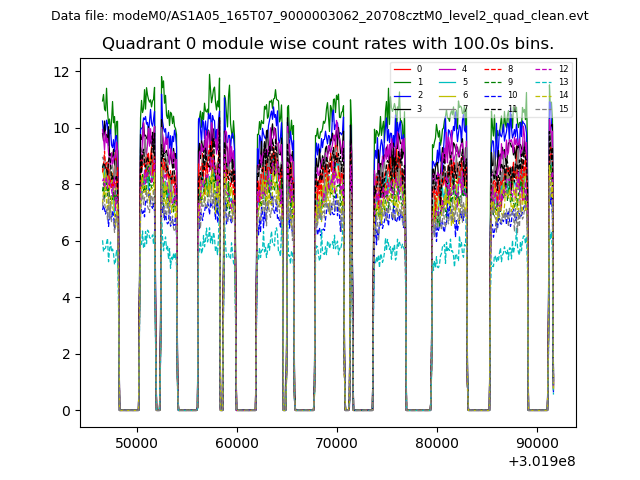 |
 |
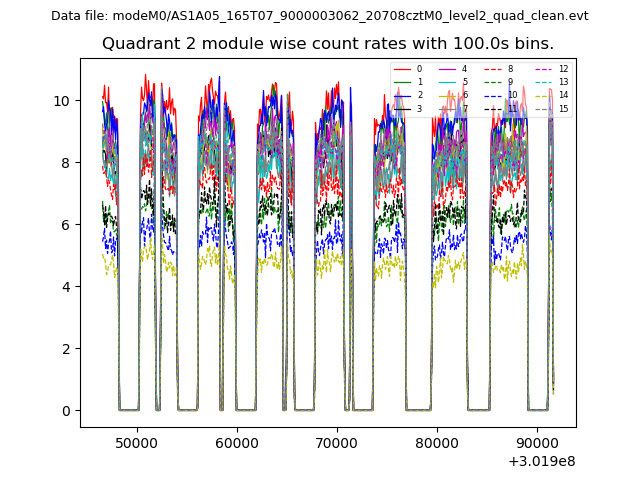
| Module-wise count rates for Quadrant B Data is divided into 100 sec bins |
 |
 |
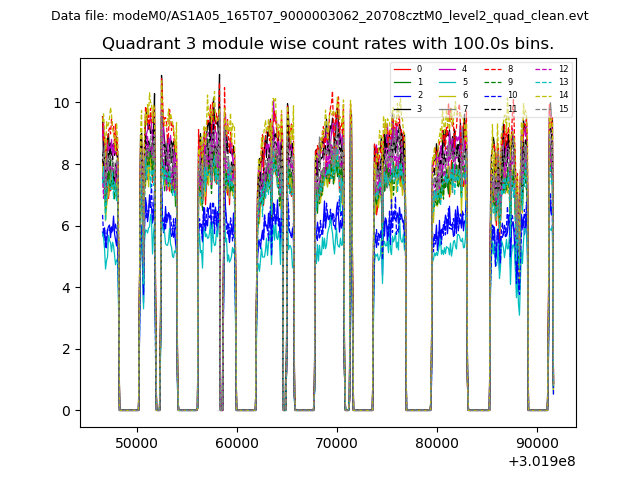
| Module-wise count rates for Quadrant C Data is divided into 100 sec bins |
 |
 |
| Module-wise count rates for Quadrant D Data is divided into 100 sec bins |
 |
 |
| Parameter | Plot |
|---|---|
| CZT HV Monitor | 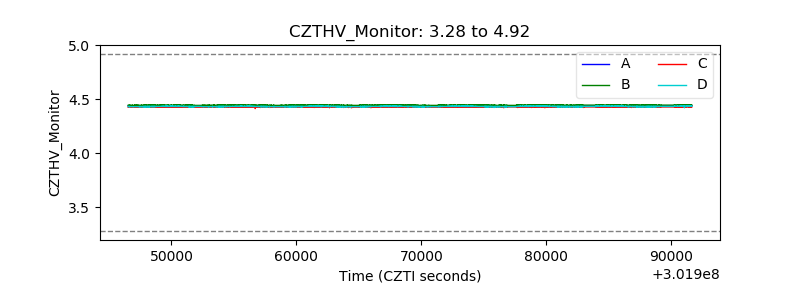 |
| D_VDD | 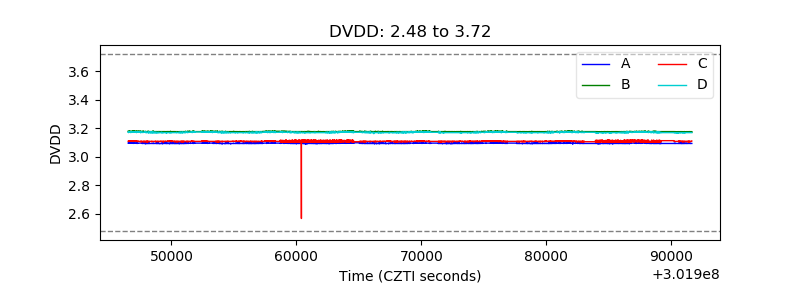 |
| Temperature 1 | 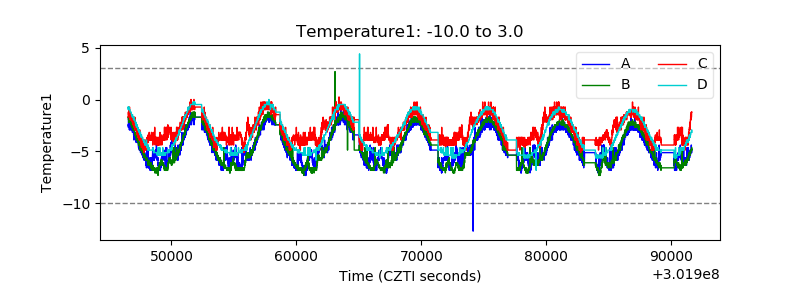 |
| Veto HV Monitor | 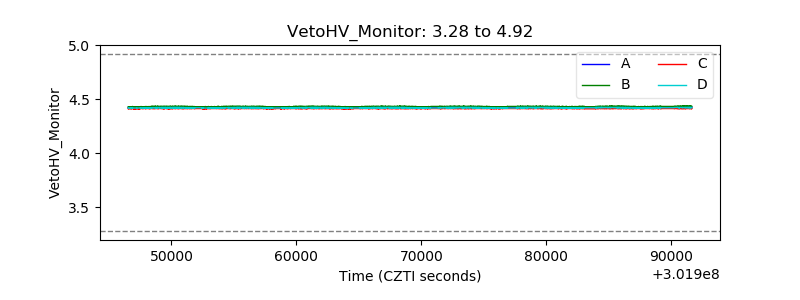 |
| Veto LLD | 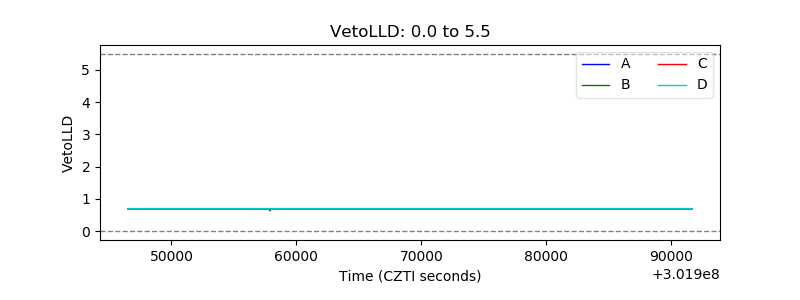 |
| Alpha Counter | 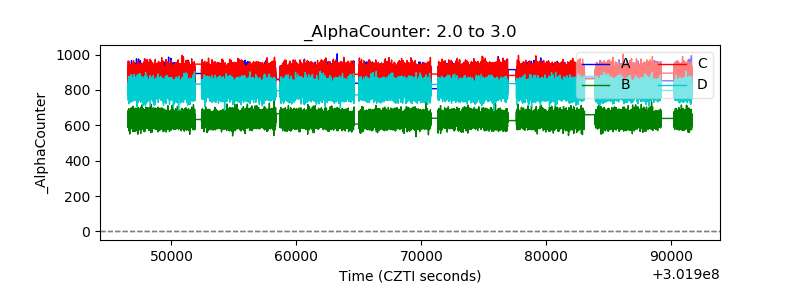 |
| _CPM_Rate | 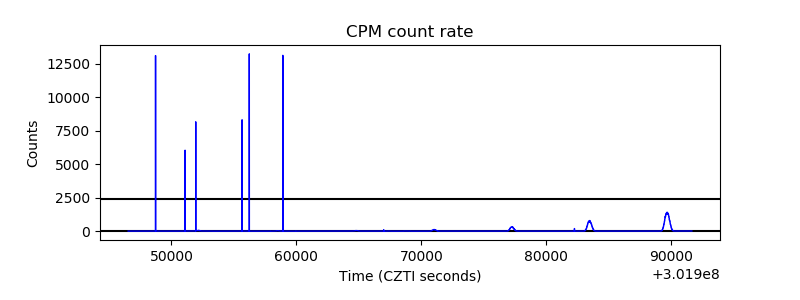 |
| CZT Counter |  |
| +2.5 Volts monitor |  |
| +5 Volts monitor | 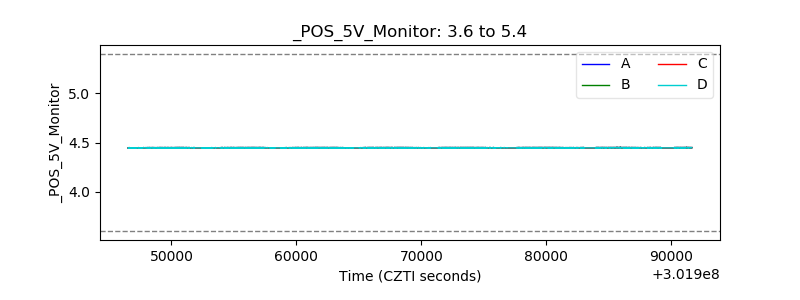 |
| _ROLL_ROT | 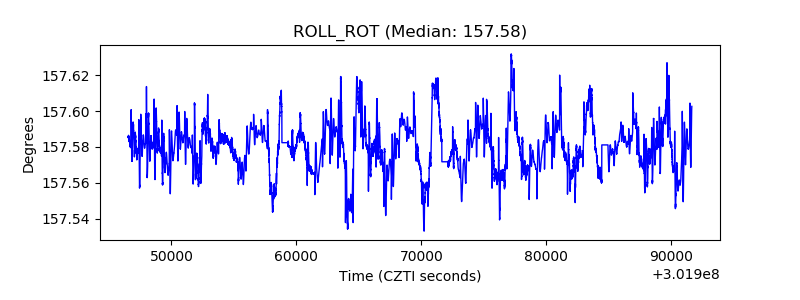 |
| _Roll_DEC | 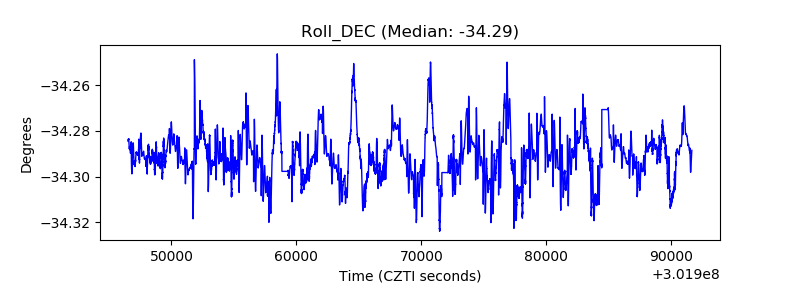 |
| _Roll_RA | 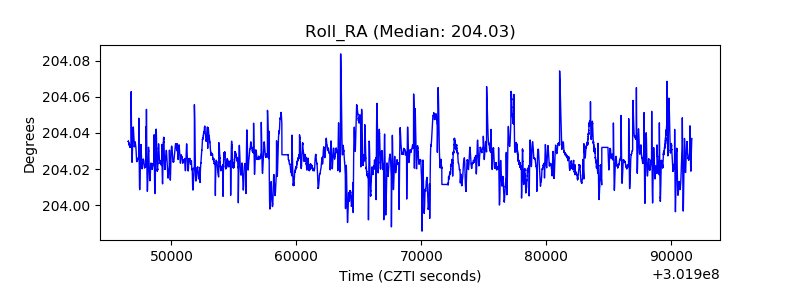 |
| Veto Counter | 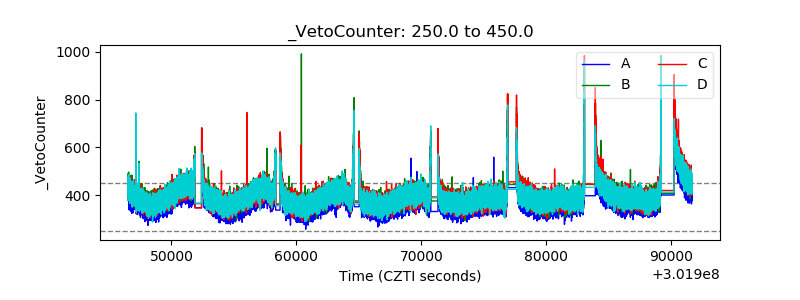 |