| Param | Original file | Final file |
|---|---|---|
| Filename | modeM0/AS1A05_165T07_9000003062_20710cztM0_level2.evt | modeM0/AS1A05_165T07_9000003062_20710cztM0_level2_quad_clean.evt |
| Size (bytes) | 483,367,680 | 95,785,920 |
| Size | 461.0 MB | 91.3 MB |
| Events in quadrant A | 3,273,773 | 631,776 |
| Events in quadrant B | 3,673,113 | 625,846 |
| Events in quadrant C | 3,326,145 | 600,172 |
| Events in quadrant D | 3,928,055 | 593,081 |
| Mode SS | |||
|---|---|---|---|
| Quadrant | BADHDUFLAG | Total packets | Discarded packets |
| A | 0 | 130 | 0 |
| B | 0 | 130 | 0 |
| C | 0 | 130 | 0 |
| D | 0 | 130 | 0 |
| Mode M0 | |||
|---|---|---|---|
| Quadrant | BADHDUFLAG | Total packets | Discarded packets |
| A | 0 | 13807 | 2 |
| B | 0 | 15007 | 2 |
| C | 0 | 13979 | 2 |
| D | 0 | 15938 | 2 |
| Mode M9 | |||
|---|---|---|---|
| Quadrant | BADHDUFLAG | Total packets | Discarded packets |
| A | 0 | 12 | 0 |
| B | 0 | 12 | 0 |
| C | 0 | 12 | 0 |
| D | 0 | 12 | 0 |
| Quadrant | Total seconds | Saturated seconds | Saturation percentage |
|---|---|---|---|
| A | 6454 | 68 | 1.053610% |
| B | 6454 | 119 | 1.843818% |
| C | 6454 | 100 | 1.549427% |
| D | 6454 | 90 | 1.394484% |
Noise dominated data is calculated using 1-second bins in cleaned event files. If a bin has >2000 counts, and if more than 50% of those come from <1% of pixels, then it is considered to be noise-dominated and hence unusable.
| Quadrant | # 1 sec bins | Bins with >0 counts | Bins with >2000 counts | High rate bins dominated by noise | Noise dominated (total time) | Noise dominated (detector-on time) | Marked lightcurve |
|---|---|---|---|---|---|---|---|
| A | 7594 | 6454 | 0 | 0 | 0.00% | 0.00% |  |
| B | 7594 | 6454 | 28 | 28 | 0.37% | 0.43% | 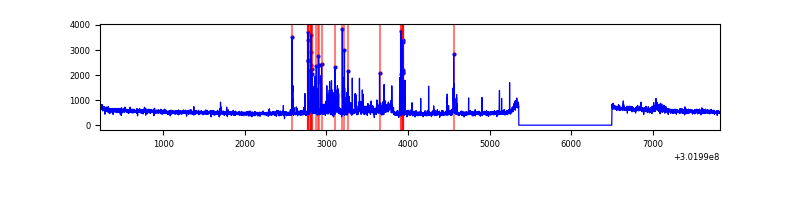 |
| C | 7594 | 6454 | 0 | 0 | 0.00% | 0.00% | 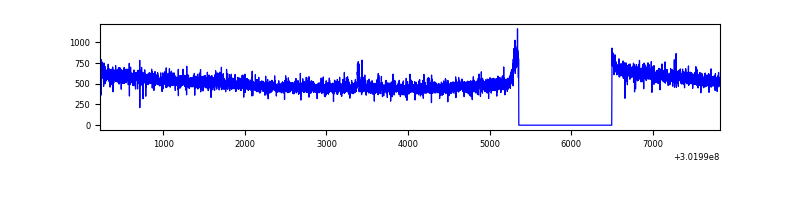 |
| D | 7594 | 6454 | 35 | 35 | 0.46% | 0.54% | 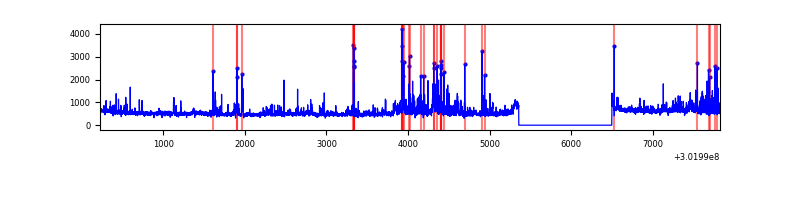 |
Top three noisy pixels from each quadrant. If the there are fewer than three noisy pixels in the level2.evt file, extra rows are filled as -1
| Pixel properties | Quadrant properties | ||||||
|---|---|---|---|---|---|---|---|
| Quadrant | DetID | PixID | Counts | Sigma | Mean | Median | Sigma |
| A | 0 | 226 | 7243 | 37.73 | 850 | 834 | 169.9 |
| A | 3 | 137 | 6401 | 32.77 | 850 | 834 | 169.9 |
| A | 12 | 194 | 6125 | 31.15 | 850 | 834 | 169.9 |
| B | 7 | 220 | 223631 | 1414.96 | 834 | 814 | 157.5 |
| B | 0 | 197 | 117086 | 738.37 | 834 | 814 | 157.5 |
| B | 0 | 230 | 27584 | 170.0 | 834 | 814 | 157.5 |
| C | 14 | 238 | 127952 | 686.01 | 807 | 815 | 185.3 |
| C | 7 | 247 | 23621 | 123.06 | 807 | 815 | 185.3 |
| C | 3 | 233 | 19656 | 101.66 | 807 | 815 | 185.3 |
| D | 1 | 52 | 421776 | 2138.56 | 823 | 800 | 196.8 |
| D | 5 | 222 | 325027 | 1647.08 | 823 | 800 | 196.8 |
| D | 2 | 234 | 24261 | 119.18 | 823 | 800 | 196.8 |
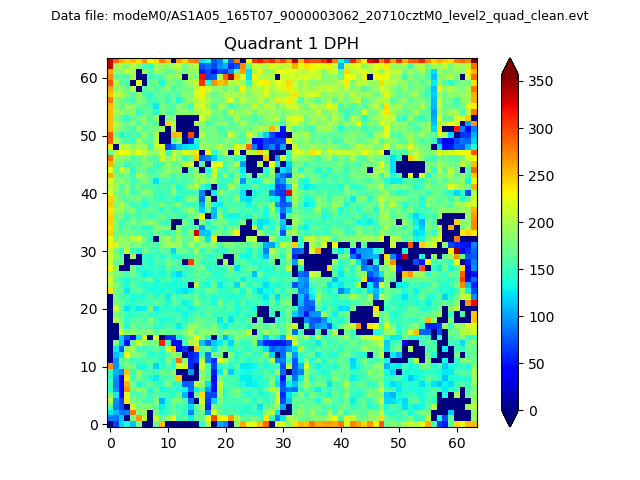
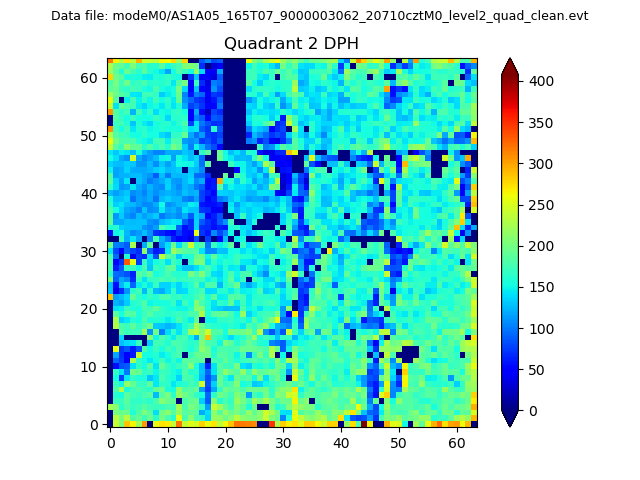
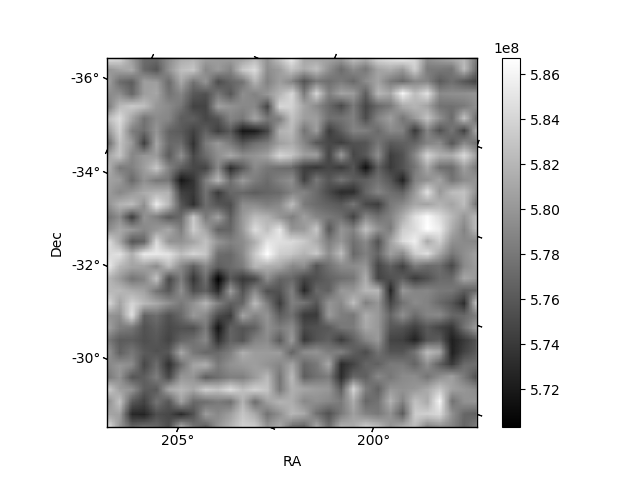
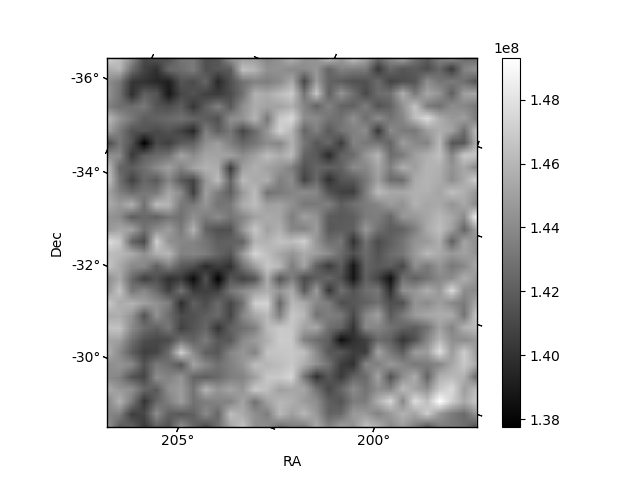
Histogram calculated using DETX and DETY for each event in the final _common_clean file
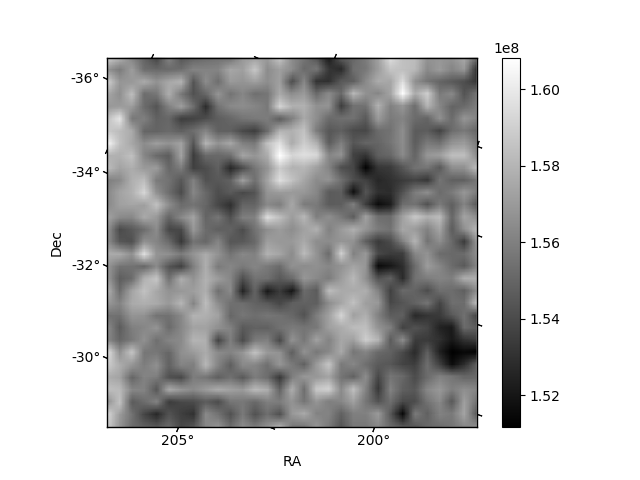
| Quadrant A | 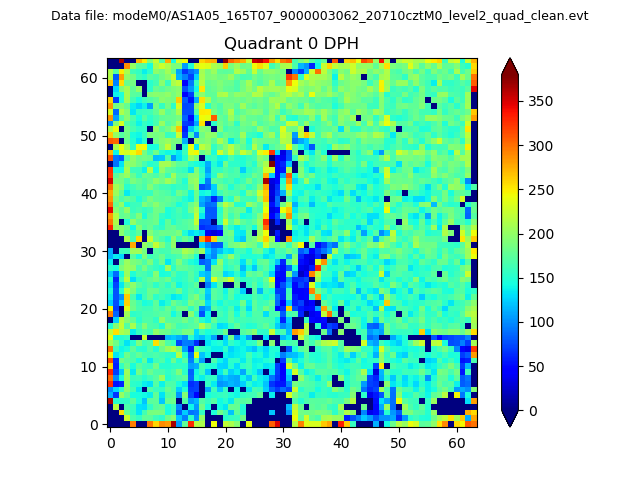 |
 |
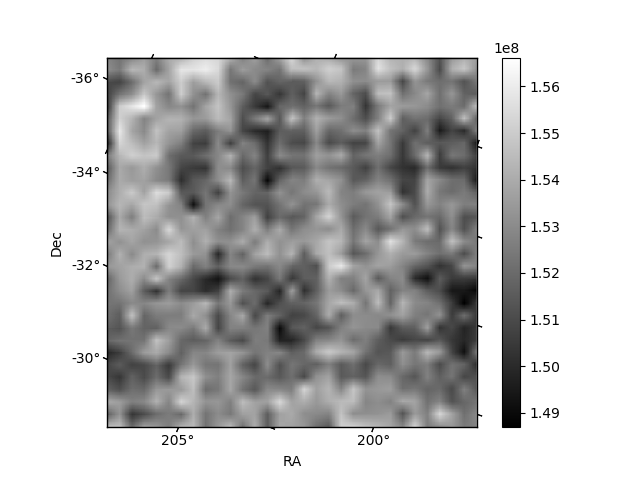
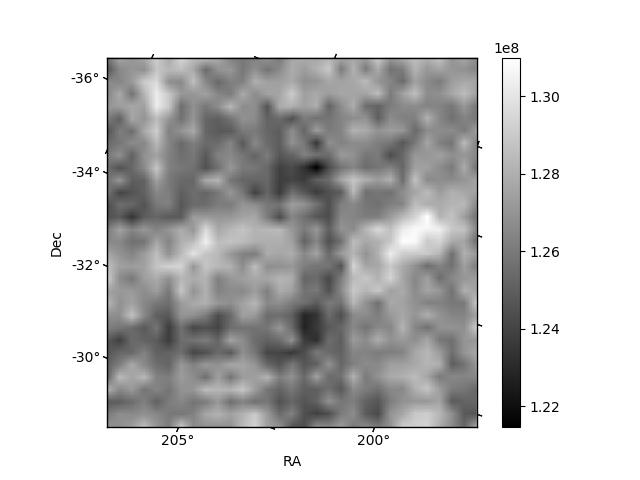
Quadrant B |
|---|---|---|---|
| Quadrant D | 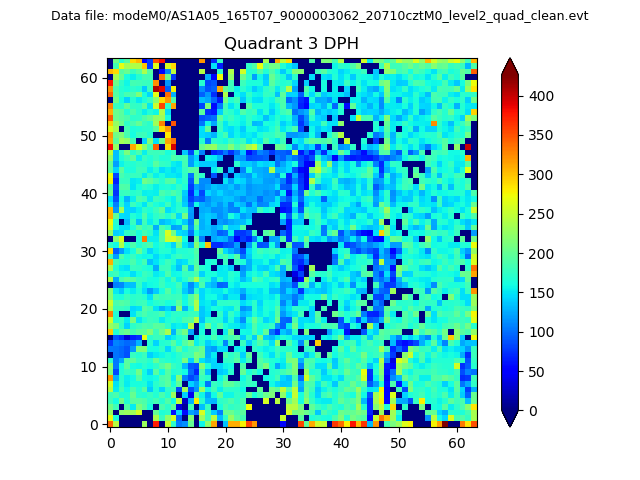 |
 |
Quadrant C |
| Plot type | Count rate plots | Images |
|---|---|---|
| Comparison with Poisson distribution Blue bars denote a histogram of data divided into 1 sec bins. Red curve is a Poisson curve with rate = median count rate of data. |
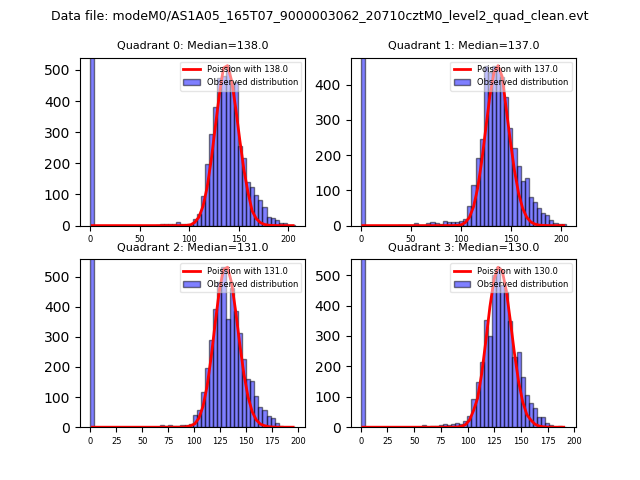 |
 |
| Quadrant-wise count rates Data is divided into 100 sec bins |
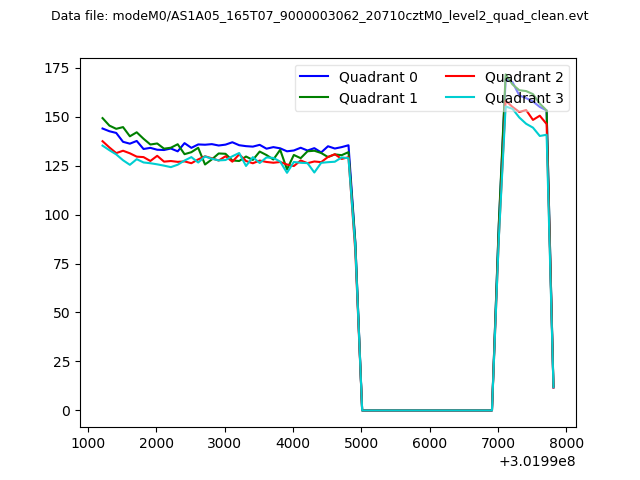 |
|
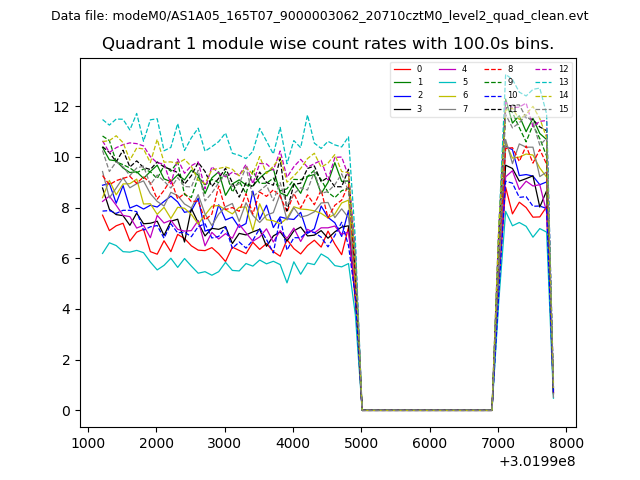
| Module-wise count rates for Quadrant A Data is divided into 100 sec bins |
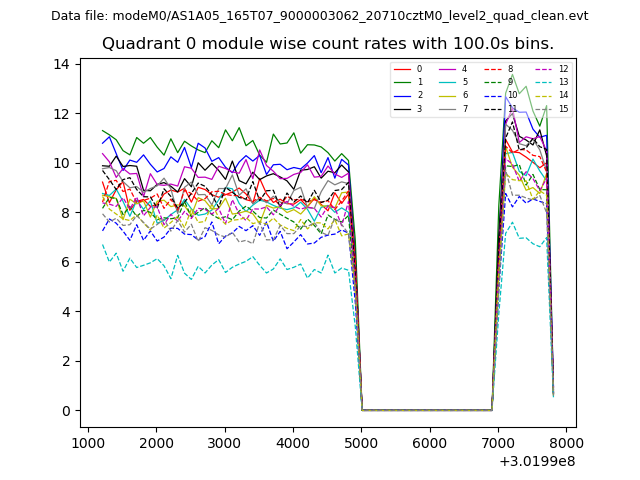 |
 |
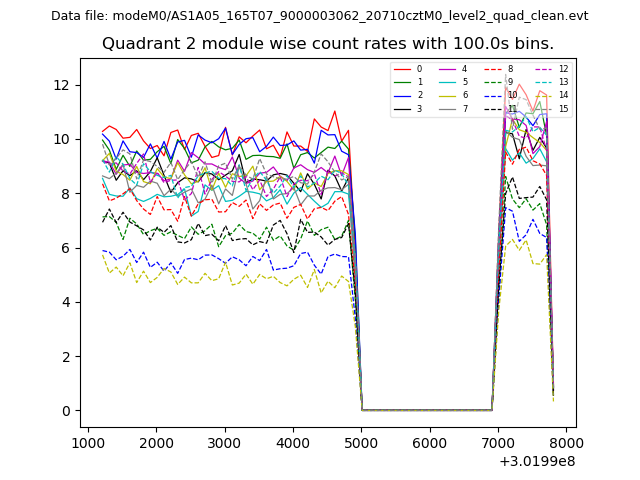
| Module-wise count rates for Quadrant B Data is divided into 100 sec bins |
 |
 |
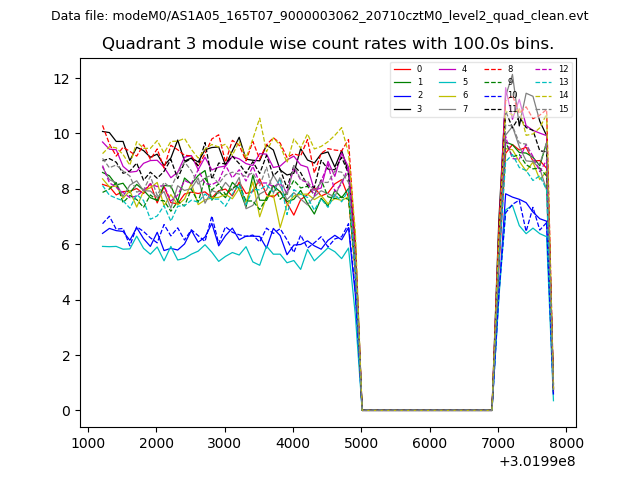
| Module-wise count rates for Quadrant C Data is divided into 100 sec bins |
 |
 |
| Module-wise count rates for Quadrant D Data is divided into 100 sec bins |
 |
 |
| Parameter | Plot |
|---|---|
| CZT HV Monitor | 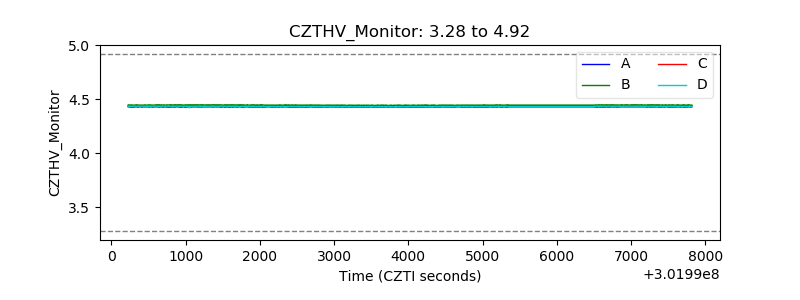 |
| D_VDD |  |
| Temperature 1 | 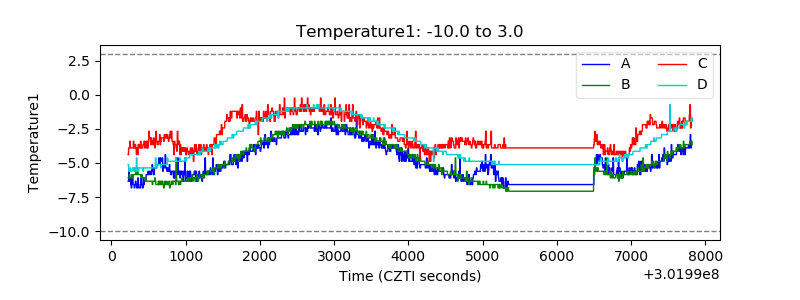 |
| Veto HV Monitor |  |
| Veto LLD | 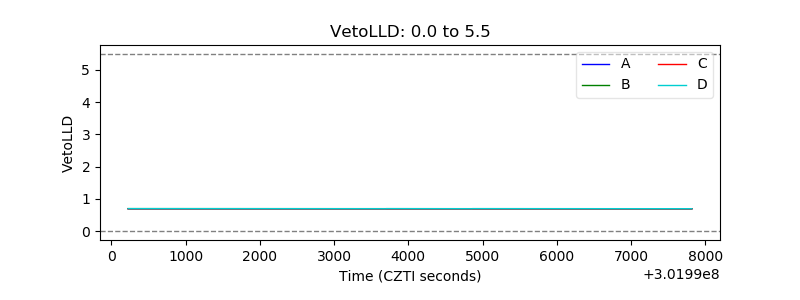 |
| Alpha Counter | 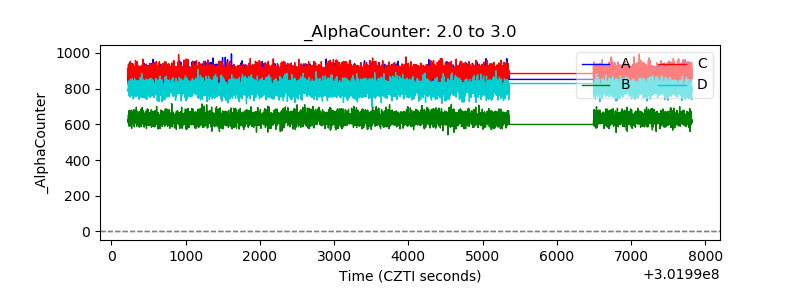 |
| _CPM_Rate | 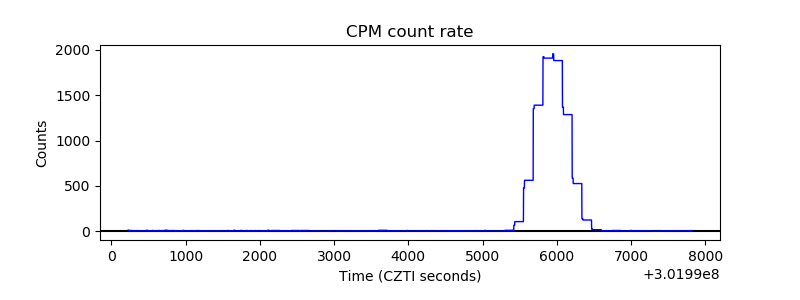 |
| CZT Counter | 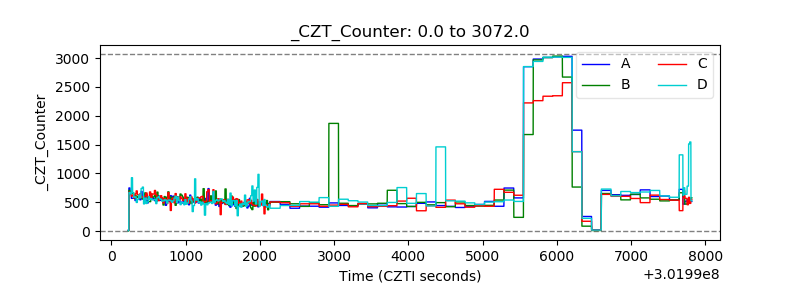 |
| +2.5 Volts monitor |  |
| +5 Volts monitor |  |
| _ROLL_ROT | 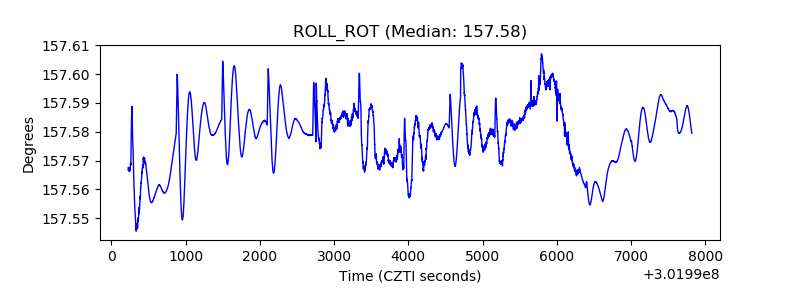 |
| _Roll_DEC | 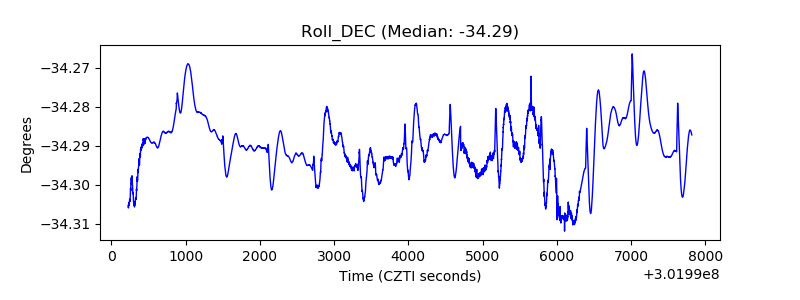 |
| _Roll_RA | 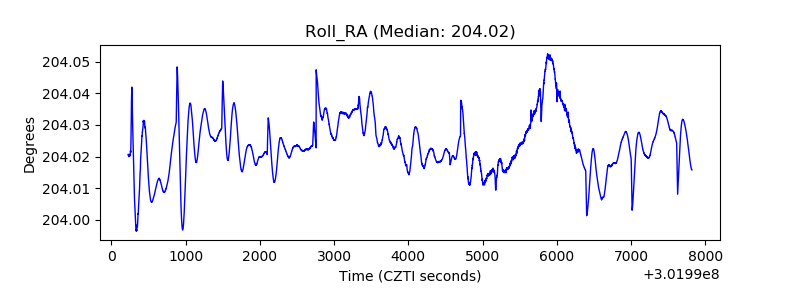 |
| Veto Counter | 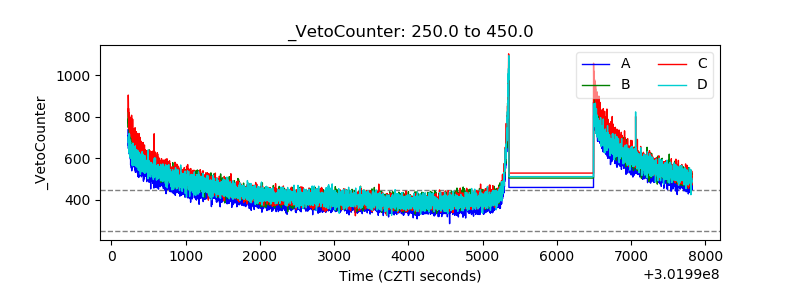 |