| Param | Original file | Final file |
|---|---|---|
| Filename | modeM0/AS1A05_165T07_9000003062_20712cztM0_level2.evt | modeM0/AS1A05_165T07_9000003062_20712cztM0_level2_quad_clean.evt |
| Size (bytes) | 565,542,720 | 119,784,960 |
| Size | 539.3 MB | 114.2 MB |
| Events in quadrant A | 3,296,214 | 846,910 |
| Events in quadrant B | 3,598,447 | 830,310 |
| Events in quadrant C | 3,352,209 | 788,738 |
| Events in quadrant D | 6,462,775 | 731,155 |
| Mode SS | |||
|---|---|---|---|
| Quadrant | BADHDUFLAG | Total packets | Discarded packets |
| A | 0 | 126 | 0 |
| B | 0 | 126 | 0 |
| C | 0 | 126 | 0 |
| D | 0 | 126 | 0 |
| Mode M0 | |||
|---|---|---|---|
| Quadrant | BADHDUFLAG | Total packets | Discarded packets |
| A | 0 | 13745 | 1 |
| B | 0 | 14687 | 1 |
| C | 0 | 13887 | 1 |
| D | 0 | 23490 | 1 |
| Mode M9 | |||
|---|---|---|---|
| Quadrant | BADHDUFLAG | Total packets | Discarded packets |
| A | 0 | 13 | 0 |
| B | 0 | 13 | 0 |
| C | 0 | 13 | 0 |
| D | 0 | 13 | 0 |
| Quadrant | Total seconds | Saturated seconds | Saturation percentage |
|---|---|---|---|
| A | 6166 | 67 | 1.086604% |
| B | 6167 | 104 | 1.686395% |
| C | 6167 | 121 | 1.962056% |
| D | 6167 | 948 | 15.372142% |
Noise dominated data is calculated using 1-second bins in cleaned event files. If a bin has >2000 counts, and if more than 50% of those come from <1% of pixels, then it is considered to be noise-dominated and hence unusable.
| Quadrant | # 1 sec bins | Bins with >0 counts | Bins with >2000 counts | High rate bins dominated by noise | Noise dominated (total time) | Noise dominated (detector-on time) | Marked lightcurve |
|---|---|---|---|---|---|---|---|
| A | 7476 | 6168 | 0 | 0 | 0.00% | 0.00% | 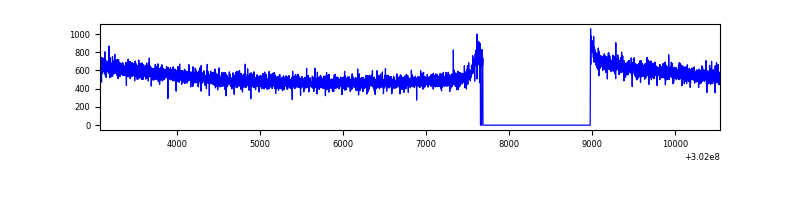 |
| B | 7476 | 6168 | 21 | 21 | 0.28% | 0.34% | 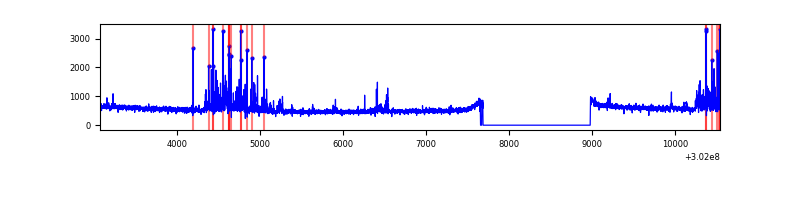 |
| C | 7477 | 6168 | 0 | 0 | 0.00% | 0.00% |  |
| D | 7477 | 6169 | 762 | 762 | 10.19% | 12.35% | 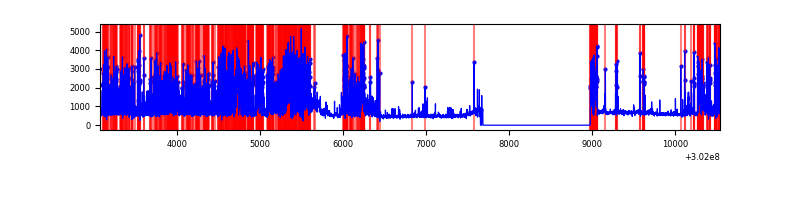 |
Top three noisy pixels from each quadrant. If the there are fewer than three noisy pixels in the level2.evt file, extra rows are filled as -1
| Pixel properties | Quadrant properties | ||||||
|---|---|---|---|---|---|---|---|
| Quadrant | DetID | PixID | Counts | Sigma | Mean | Median | Sigma |
| A | 0 | 226 | 7550 | 39.53 | 857 | 843 | 169.7 |
| A | 3 | 137 | 6355 | 32.49 | 857 | 843 | 169.7 |
| A | 12 | 194 | 6351 | 32.46 | 857 | 843 | 169.7 |
| B | 7 | 220 | 257048 | 1641.83 | 830 | 813 | 156.1 |
| B | 0 | 190 | 32494 | 203.0 | 830 | 813 | 156.1 |
| B | 0 | 197 | 23569 | 145.81 | 830 | 813 | 156.1 |
| C | 14 | 238 | 129328 | 705.76 | 797 | 804 | 182.1 |
| C | 7 | 247 | 91313 | 497.01 | 797 | 804 | 182.1 |
| C | 8 | 208 | 11143 | 56.77 | 797 | 804 | 182.1 |
| D | 5 | 222 | 2536245 | 13515.42 | 789 | 769 | 187.6 |
| D | 1 | 52 | 673522 | 3586.13 | 789 | 769 | 187.6 |
| D | 1 | 20 | 98049 | 518.55 | 789 | 769 | 187.6 |
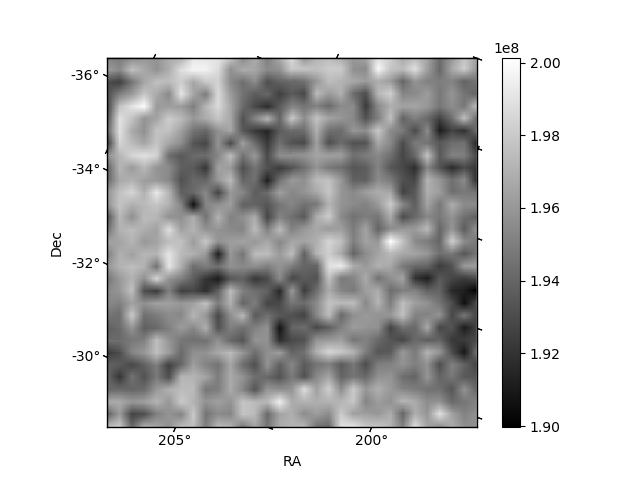
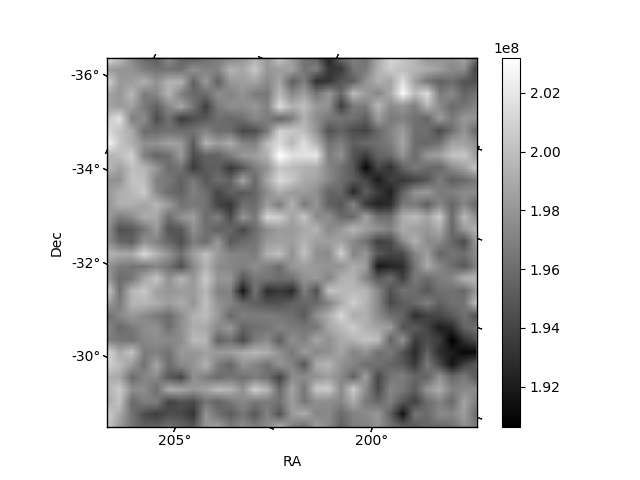
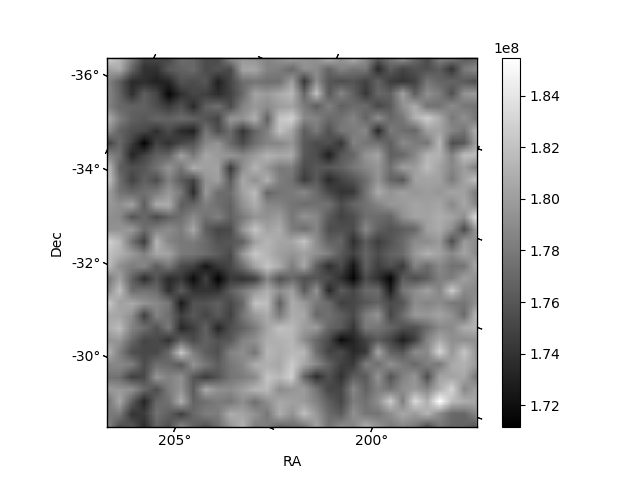
Histogram calculated using DETX and DETY for each event in the final _common_clean file
| Quadrant A | 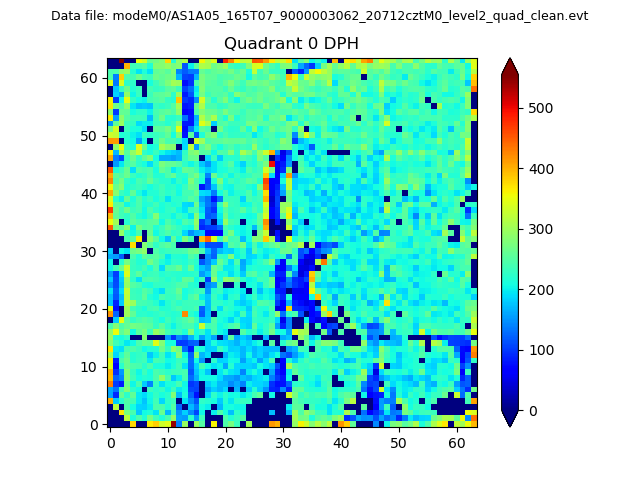 |
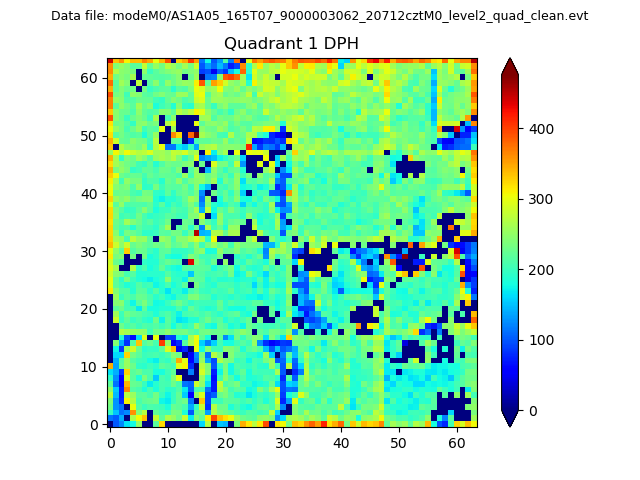 |
Quadrant B |
|---|---|---|---|
| Quadrant D | 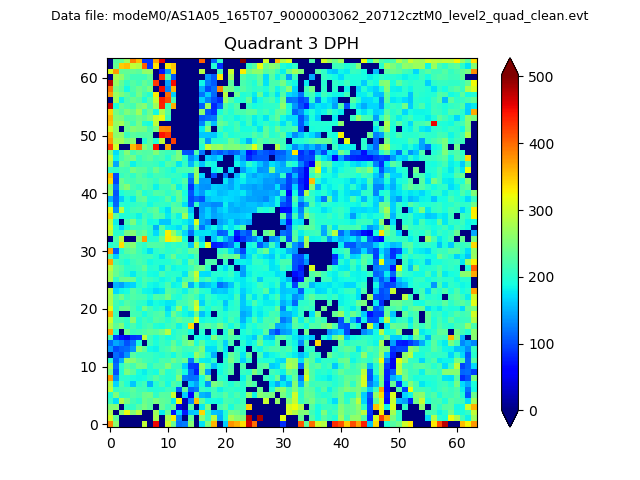 |
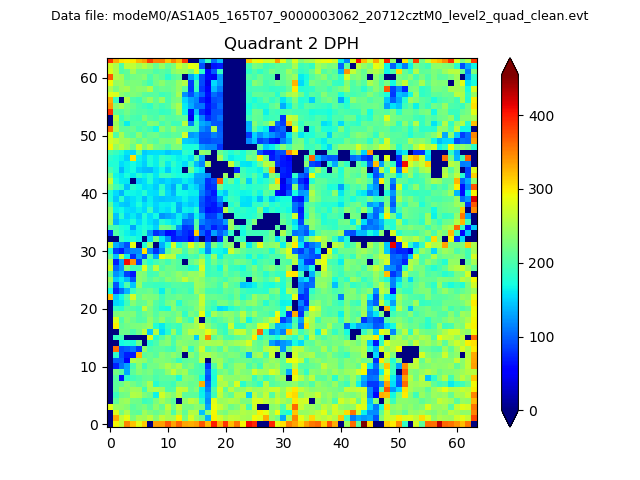 |
Quadrant C |
| Plot type | Count rate plots | Images |
|---|---|---|
| Comparison with Poisson distribution Blue bars denote a histogram of data divided into 1 sec bins. Red curve is a Poisson curve with rate = median count rate of data. |
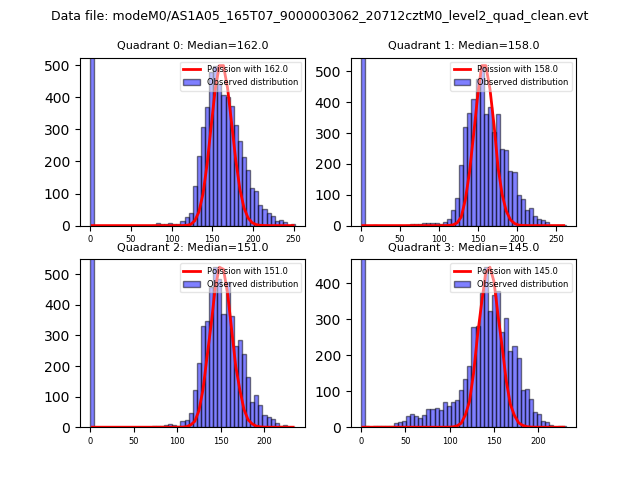 |
 |
| Quadrant-wise count rates Data is divided into 100 sec bins |
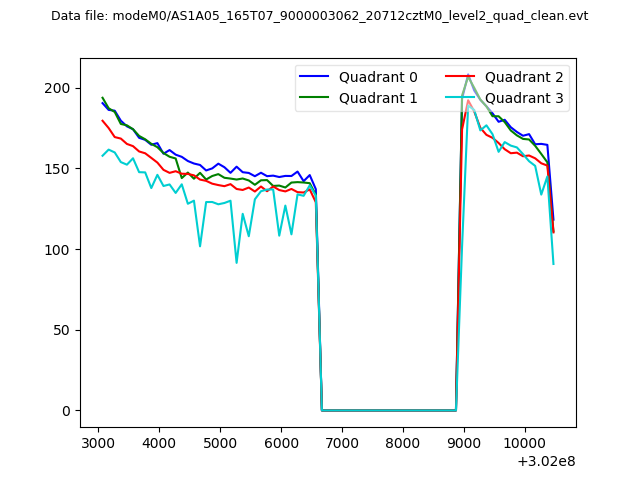 |
|
| Module-wise count rates for Quadrant A Data is divided into 100 sec bins |
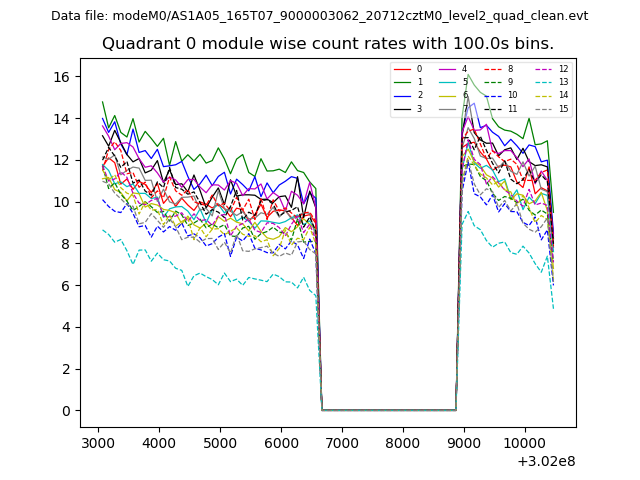 |
 |
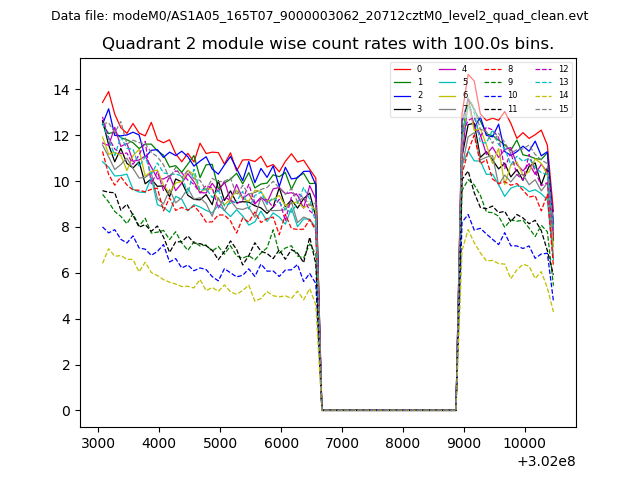
| Module-wise count rates for Quadrant B Data is divided into 100 sec bins |
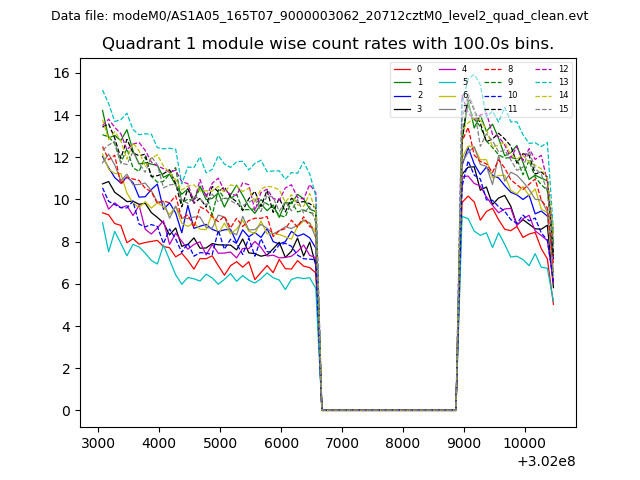 |
 |
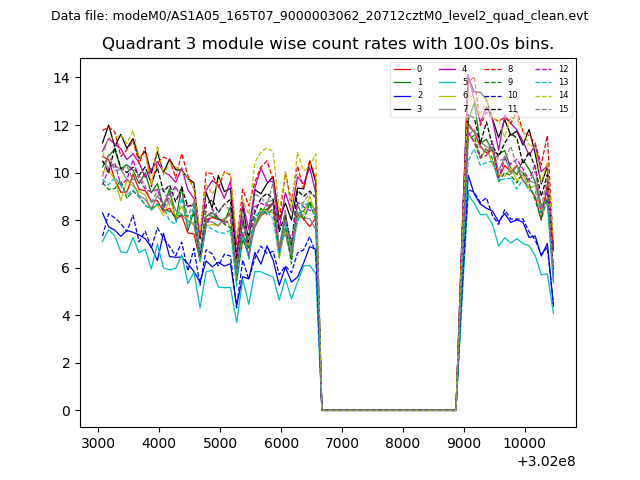
| Module-wise count rates for Quadrant C Data is divided into 100 sec bins |
 |
 |
| Module-wise count rates for Quadrant D Data is divided into 100 sec bins |
 |
 |
| Parameter | Plot |
|---|---|
| CZT HV Monitor | 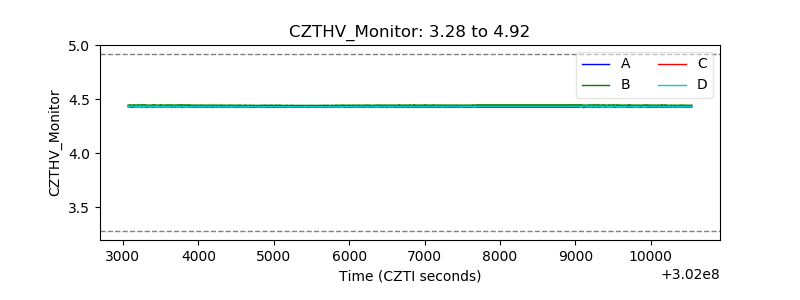 |
| D_VDD | 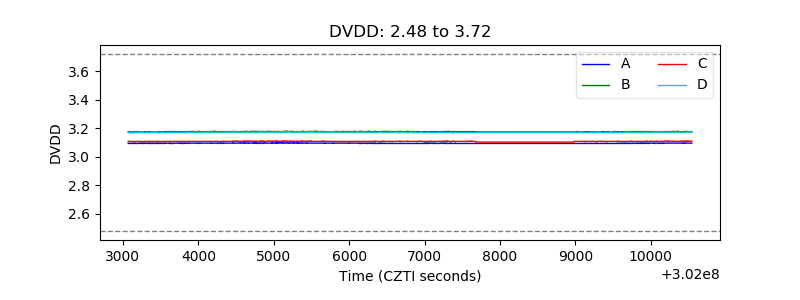 |
| Temperature 1 | 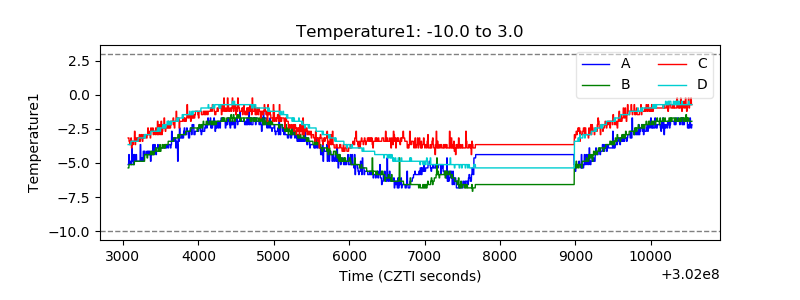 |
| Veto HV Monitor | 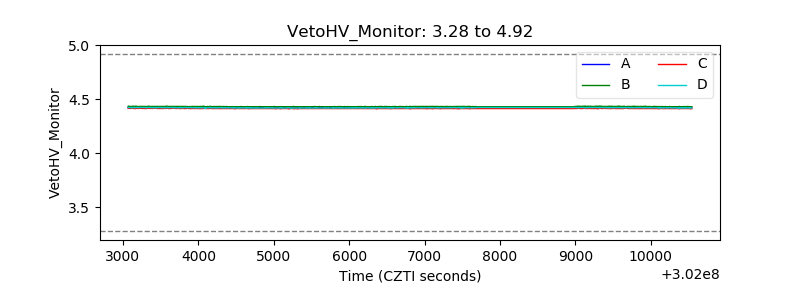 |
| Veto LLD | 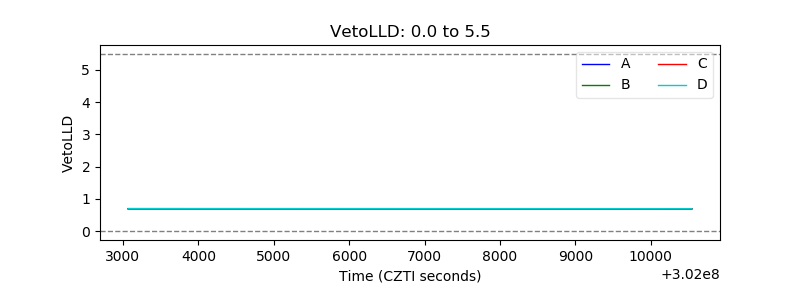 |
| Alpha Counter | 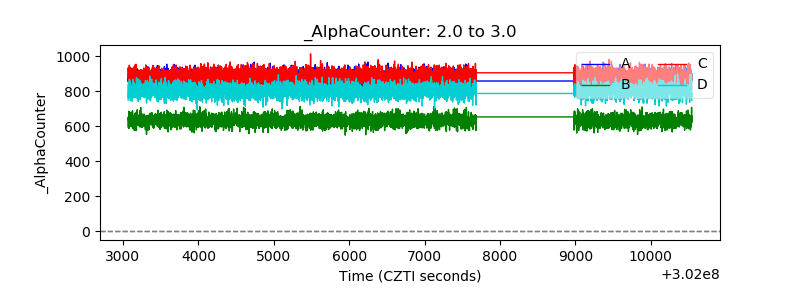 |
| _CPM_Rate | 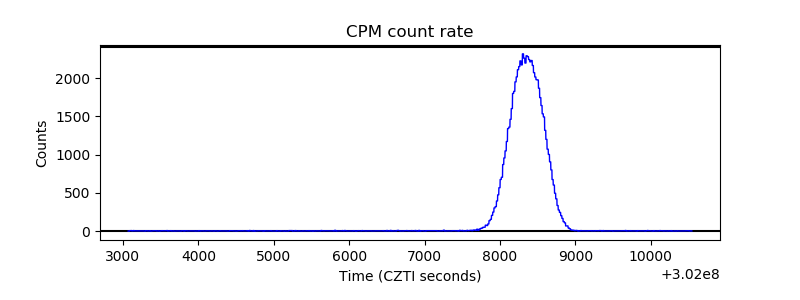 |
| CZT Counter | 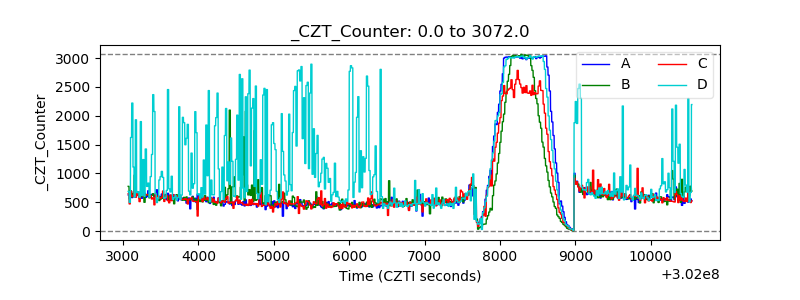 |
| +2.5 Volts monitor |  |
| +5 Volts monitor | 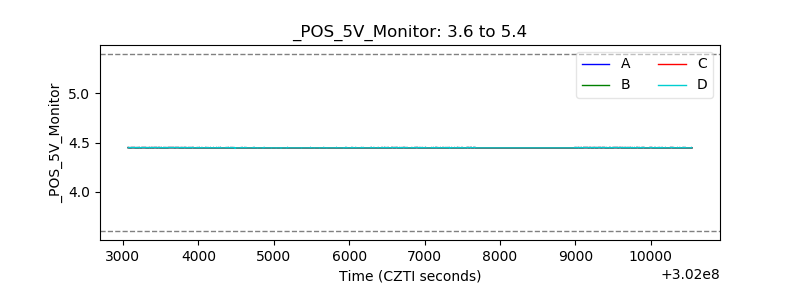 |
| _ROLL_ROT | 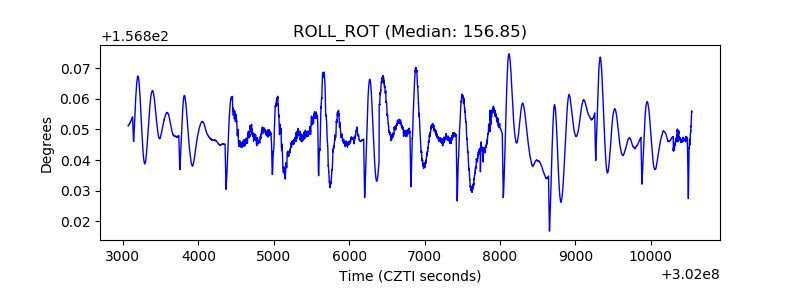 |
| _Roll_DEC | 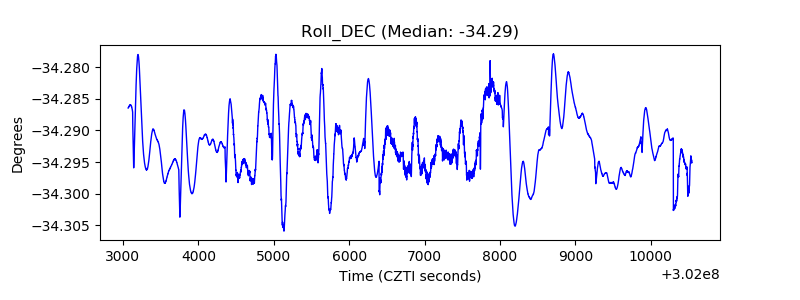 |
| _Roll_RA | 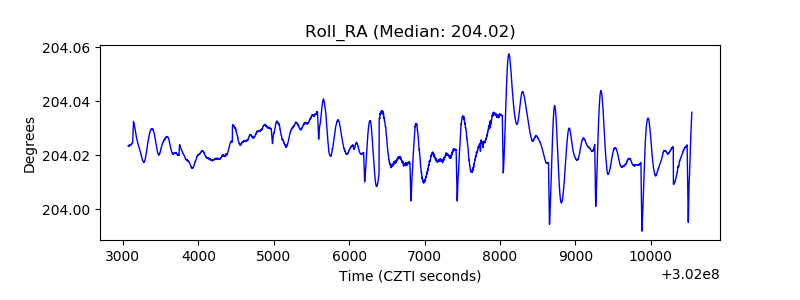 |
| Veto Counter | 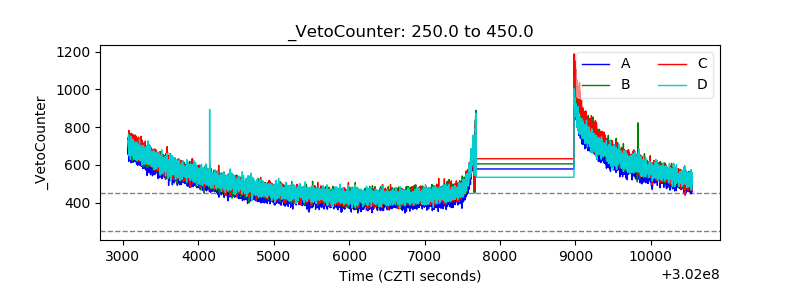 |